RBC Thought Leadership Geopolitics, Trade and the Economy

Language Flag Filename

rbc_language_toggle_menu_flag

How the political shift will impact the fractured relationship between the two nations—on trade, energy and defence.

The result could accelerate talks to push for a deal by year-end

Signals, both from Prime Minister Mark Carney and President Trump, suggest trade talks between senior Canada-U.S. officials have picked up in the past 24 hours. While a comprehensive deal before year-end remains unlikely, a limited deal, similar to the one tabled in August, could advance by then. Getting Ontario Premier Doug Ford’s support will be crucial, especially if tariffs remain on autos.

Donald Trump is expected to back away from the January 1st tariff increase but autos remain the key issue

The U.S. President’s threat to increase tariffs on Canadian autos and steel to 50% would drive up U.S. vehicle prices weeks after an election lost on affordability, and U.S. automakers oppose it. However, heavy auto tariffs remain the key sticking point in Canada-U.S. negotiations. To reach a limited deal before the end of the year, Canada may have to accept tariffs on autos in exchange for other concessions.

Trade policy still runs through the White House

Congress cannot remove the Section 232 and 338 tariffs, and it cannot block a tariff deal without a two-thirds majority in both chambers. These election results are a repudiation of Trump’s trade and foreign policy, which were consistently criticized by Democratics, but outside of indirect pressure exerted through committees, there is little Democrats can do to materially change trade policy set by the executive branch in the next two years.

Any deal will be managed trade, and tariffs will likely outlast Trump

Washington has been clear that tariffs will be part of any agreement, and Democrats have their own protectionist streak: eight of the 10 Senate votes against CUSMA in 2020 were Democrats, and Sherrod Brown (Ohio Senator-elect), Abdul El-Sayed (Michigan Senator-elect) and Josh Turek (Iowa Senator-elect) have all said they support targeted tariffs to protect U.S. manufacturing. However, over the medium-term this political shift is favourable regarding Canadian trade policy.

Canada has more allies in Congress

Candidates who blamed the trade war for higher cost of living won Senate races in Michigan, Maine, Iowa, North Carolina, South Carolina, Kansas, Ohio and Texas. Six of the new Democratic senators will replace Republicans who voted against ending the emergency tariffs on Canada. Republicans in Texas, Ohio and South Carolina now face electorates that swung sharply against their party, and more of them may be willing to break with the White House on Canada. Many Democrats are hawkish on China and likely to look at Beijing’s trade with Canada, particularly rules of origin, through that lens.

Congress will press on tariffs through votes, hearings and spending bills

Democrats remain well short of the two-thirds votes needed to override a veto. Nevertheless, in the first 100 days expect bills drafted to force recorded votes on tariffs, including on Canada, to identify Republicans willing to vote against the White House. The Office of the United States Trade Representative (USTR) must report to the Ways and Means and Finance Committees 70 days before each CUSMA review and brief them within 20 days, and Democratic chairs will use those obligations to call USTR to account.

Oversight will reach companies that made deals with the administration

House Oversight investigations begin in January, and the incoming chair, Robert Garcia, has warned the administration’s allies to “lawyer up.” Companies in tech, rare earths, financial services and pharmaceuticals, which struck deals with the administration, should expect subpoenas and document requests.

Democratic governors give Canada a stronger channel in key states

Democrats will hold most governorships for the first time since 2010, including in Michigan, Ohio, Georgia, Iowa, Minnesota and Maine—where Canada is the largest export market—and in Pennsylvania and Texas. Governors cannot change federal tariffs, but they lobby the White House and their congressional delegations, set state procurement rules, sign agreements with provinces and control energy and data-centre policy. Josh Shapiro’s June MoU with Ontario on electricity transmission, nuclear and critical minerals, though non-binding, shows the potential for Canada to work with state governments. Jocelyn Benson (Governor-elect in Michigan) has pledged to negotiate subnational agreements directly with Canada (though Republicans have said this will not be possible), and Amy Klobuchar, a leading Senate opponent of tariffs on Canada, moves to Minnesota’s governorship.

Democratic states could add legal pressure on the tariffs

A coalition of blue states, led by Oregon, joined the litigation in which the Supreme Court struck down the International Emergency Economic Powers Act (IEEPA) tariffs. Democrats have now won the Texas attorney general’s office and full control of Pennsylvania’s legislature, widening the options for state action on trade.

The data-centre backlash favours power-rich Canadian sites

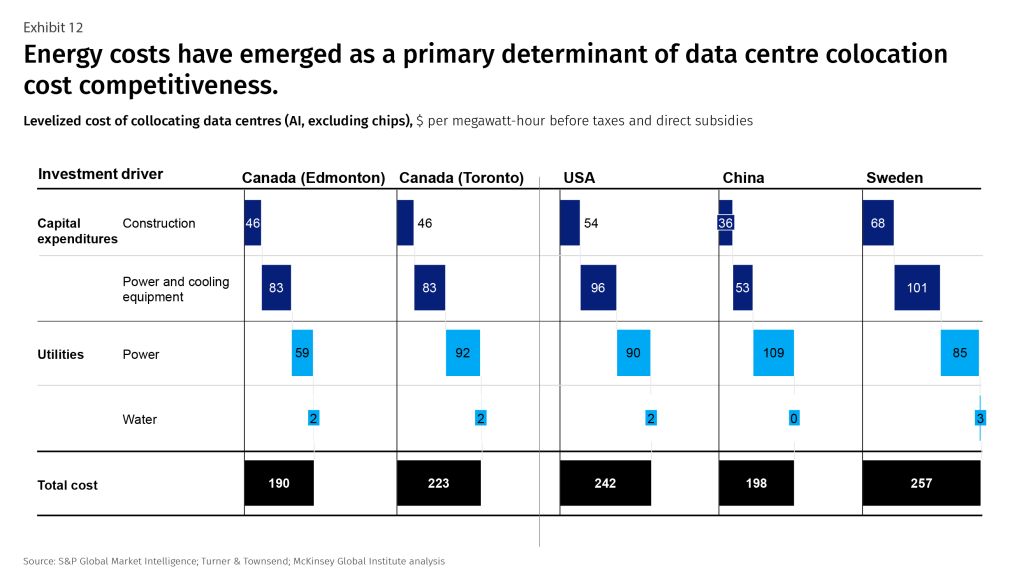
Voters rejected data centres almost everywhere the question was on the ballot, and the new governors of Texas, Georgia and Ohio, three of the largest growth markets, ran against an unrestricted buildout. Texas accounts for roughly a third of planned U.S. capacity. With states making data centres pay for their own power and federal pre-emption now unlikely, hyperscalers will choose sites by power supply, which makes Alberta Canada’s most attractive market. The opportunity is limited: Canada’s market is about 3.4% the size of the U.S. market. U.S. states’ AI rules could also impact Canadian lenders, starting with Colorado’s law on AI in financial decisions coming into effect on January 1.

The oil industry wants permitting reform before Democrats take their seats

The U.S. industry is anxious to pass the Senate permitting bill in the so-called lame duck session and expects some progressives to try to derail it. The bill would shorten environmental reviews and the window for legal challenges and expand federal authority over interstate transmission, which would help cross-border pipelines and power lines. Democrats who won in oil and farm states are unlikely to turn against Canadian crude, which supplies about 60% of U.S. oil imports. If the bill fails, the next iteration will come on Democratic terms.

The Golden Dome will shrink, and Iran remains the main external risk

Democrats will shape the FY2027 defence budget and will trade defence funding for domestic spending programs and conditions on Iran. The Golden Dome missile program is likely to be redirected toward radars, interceptor batteries and regional munitions, which weakens Trump’s demand that Canada pay US$60–70 billion to join. Trump faces fewer constraints abroad than at home, and escalation with Iran before year-end remains possible even after Vice-President JD Vance blamed the war for the losses.

Language Flag Filename

rbc_language_toggle_menu_flag

Canada and the EU already shared deep cultural, commercial, and security ties before they brokered the Canada-Europe Trade Agreement (CETA), which came into effect nearly a decade ago. And as both sides pursue a more ambitious alliance in the wake of seismic geopolitical and trade disruptions, the transatlantic collaboration is emerging as a cornerstone of economic, energy and defence on both sides of the Atlantic.

CETA laid the foundation. The deal removed 98% of tariffs between the two partners in 2017 and has since vaulted the EU into Canada’s second largest trading partner, behind only the U.S. and ahead of China. Canadian goods exports to the EU have surged 80% over that time, while imports from the EU rose 60%. Once services are factored in, Canada exports $68 billion to the EU and buys back $124 billion.1

But serious challenges persist, holding many Canadian businesses back from exporting more—or at all—to the region. To get a sense of the obstacles and opportunities, RBC conducted a market survey of nearly 1,000 Canadian business owners in September. Here’s a sampling of what we heard: 

  • “EU regulations are too complex.”

  • “China sells our products directly to EU countries, there is no room for us pricewise to compete.” 

  • “Our service could expand to [the] U.S. fairly easily, but Europe would be more difficult.” 

  • “I would sell to Europe if I could make a connection with a customer.”

While CETA has been in effect for nearly a decade, only one in five of the business owners surveyed were familiar with the deal and its benefits. And while there is interest in exporting to Europe, it often remains aspirational due largely to the time required to enter the market, distance and logistics, and a lack of access to expert support. That says nothing of the regulatory and tax burdens.

Still, as Canada focuses on a deeper alliance with Europe—one that will likely hinge on building on CETA—there is a significant opportunity. When it comes to the EU, Canada is massively under indexed on exports, and underweight on imports. If the two traded in accordance with their economic weight, Canadian exports of goods and services to the EU would more than double, rising to more than $150 billion. And EU exports to Canada would rise more than 40%, climbing north of $170 billion.

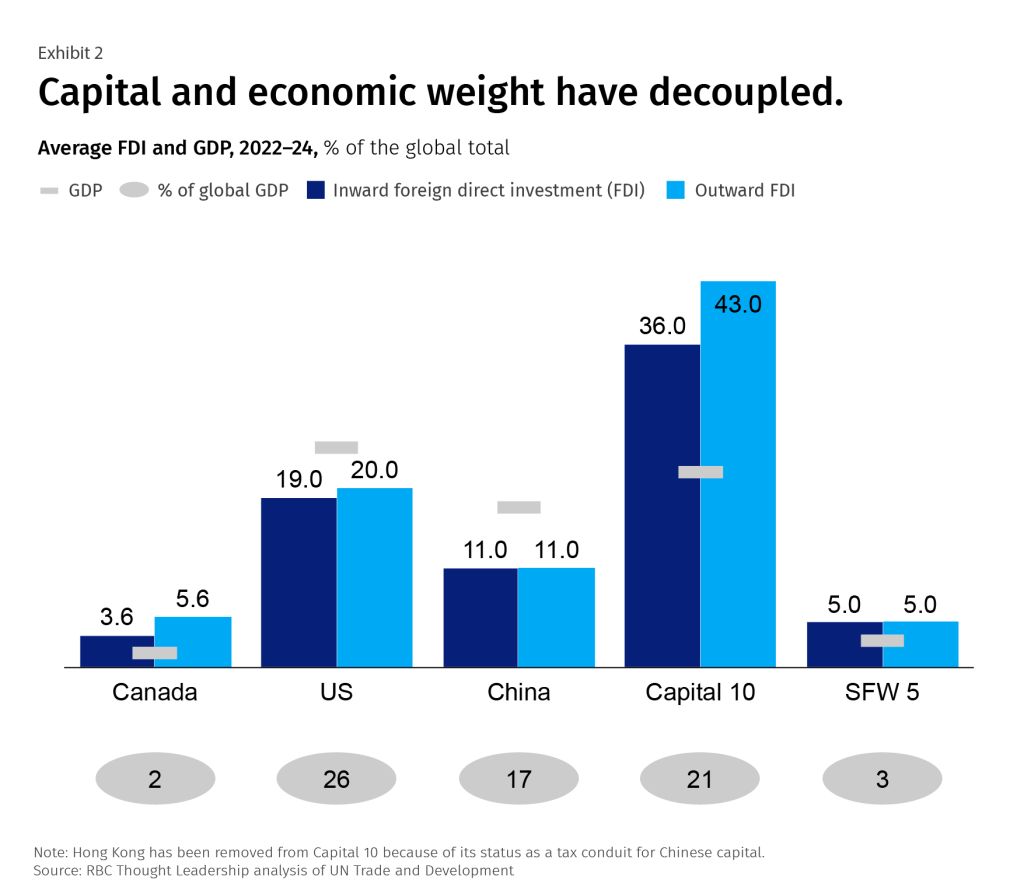
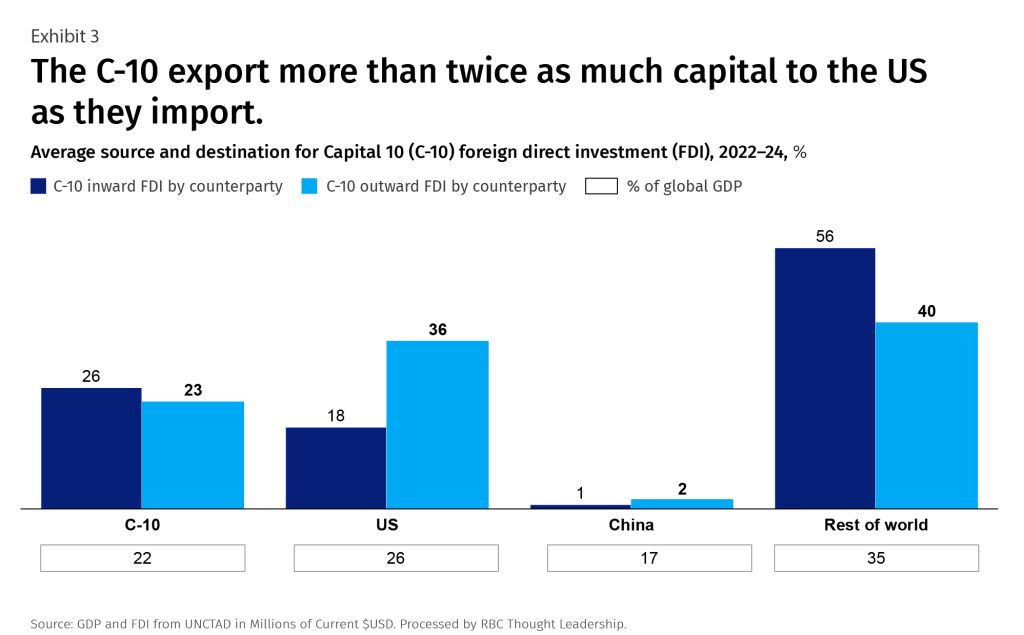
The gap in investment flows is equally stark. The EU has been exporting around US$360 billion in foreign direct investment (FDI) in recent years.2 The top destination—by far—is to other EU members, who receive 29 cents on every dollar. Canada has received just 1.4 cents on every dollar of the EU’s outward FDI, despite accounting for nearly 4 cents of every dollar globally. Likewise, the EU receives some US$300 billion in FDI, with Canada accounting for less than one cent on every dollar.

There is an abundance of cross-Atlantic opportunities to tap into: from high-tech manufacturing and defence to clean-tech energy and conventional resources as diverse as natural gas, oil and gas, potash, uranium and fertilizers. As Canada casts its net wider for new trade routes, Europe is emerging as a promising port of call.

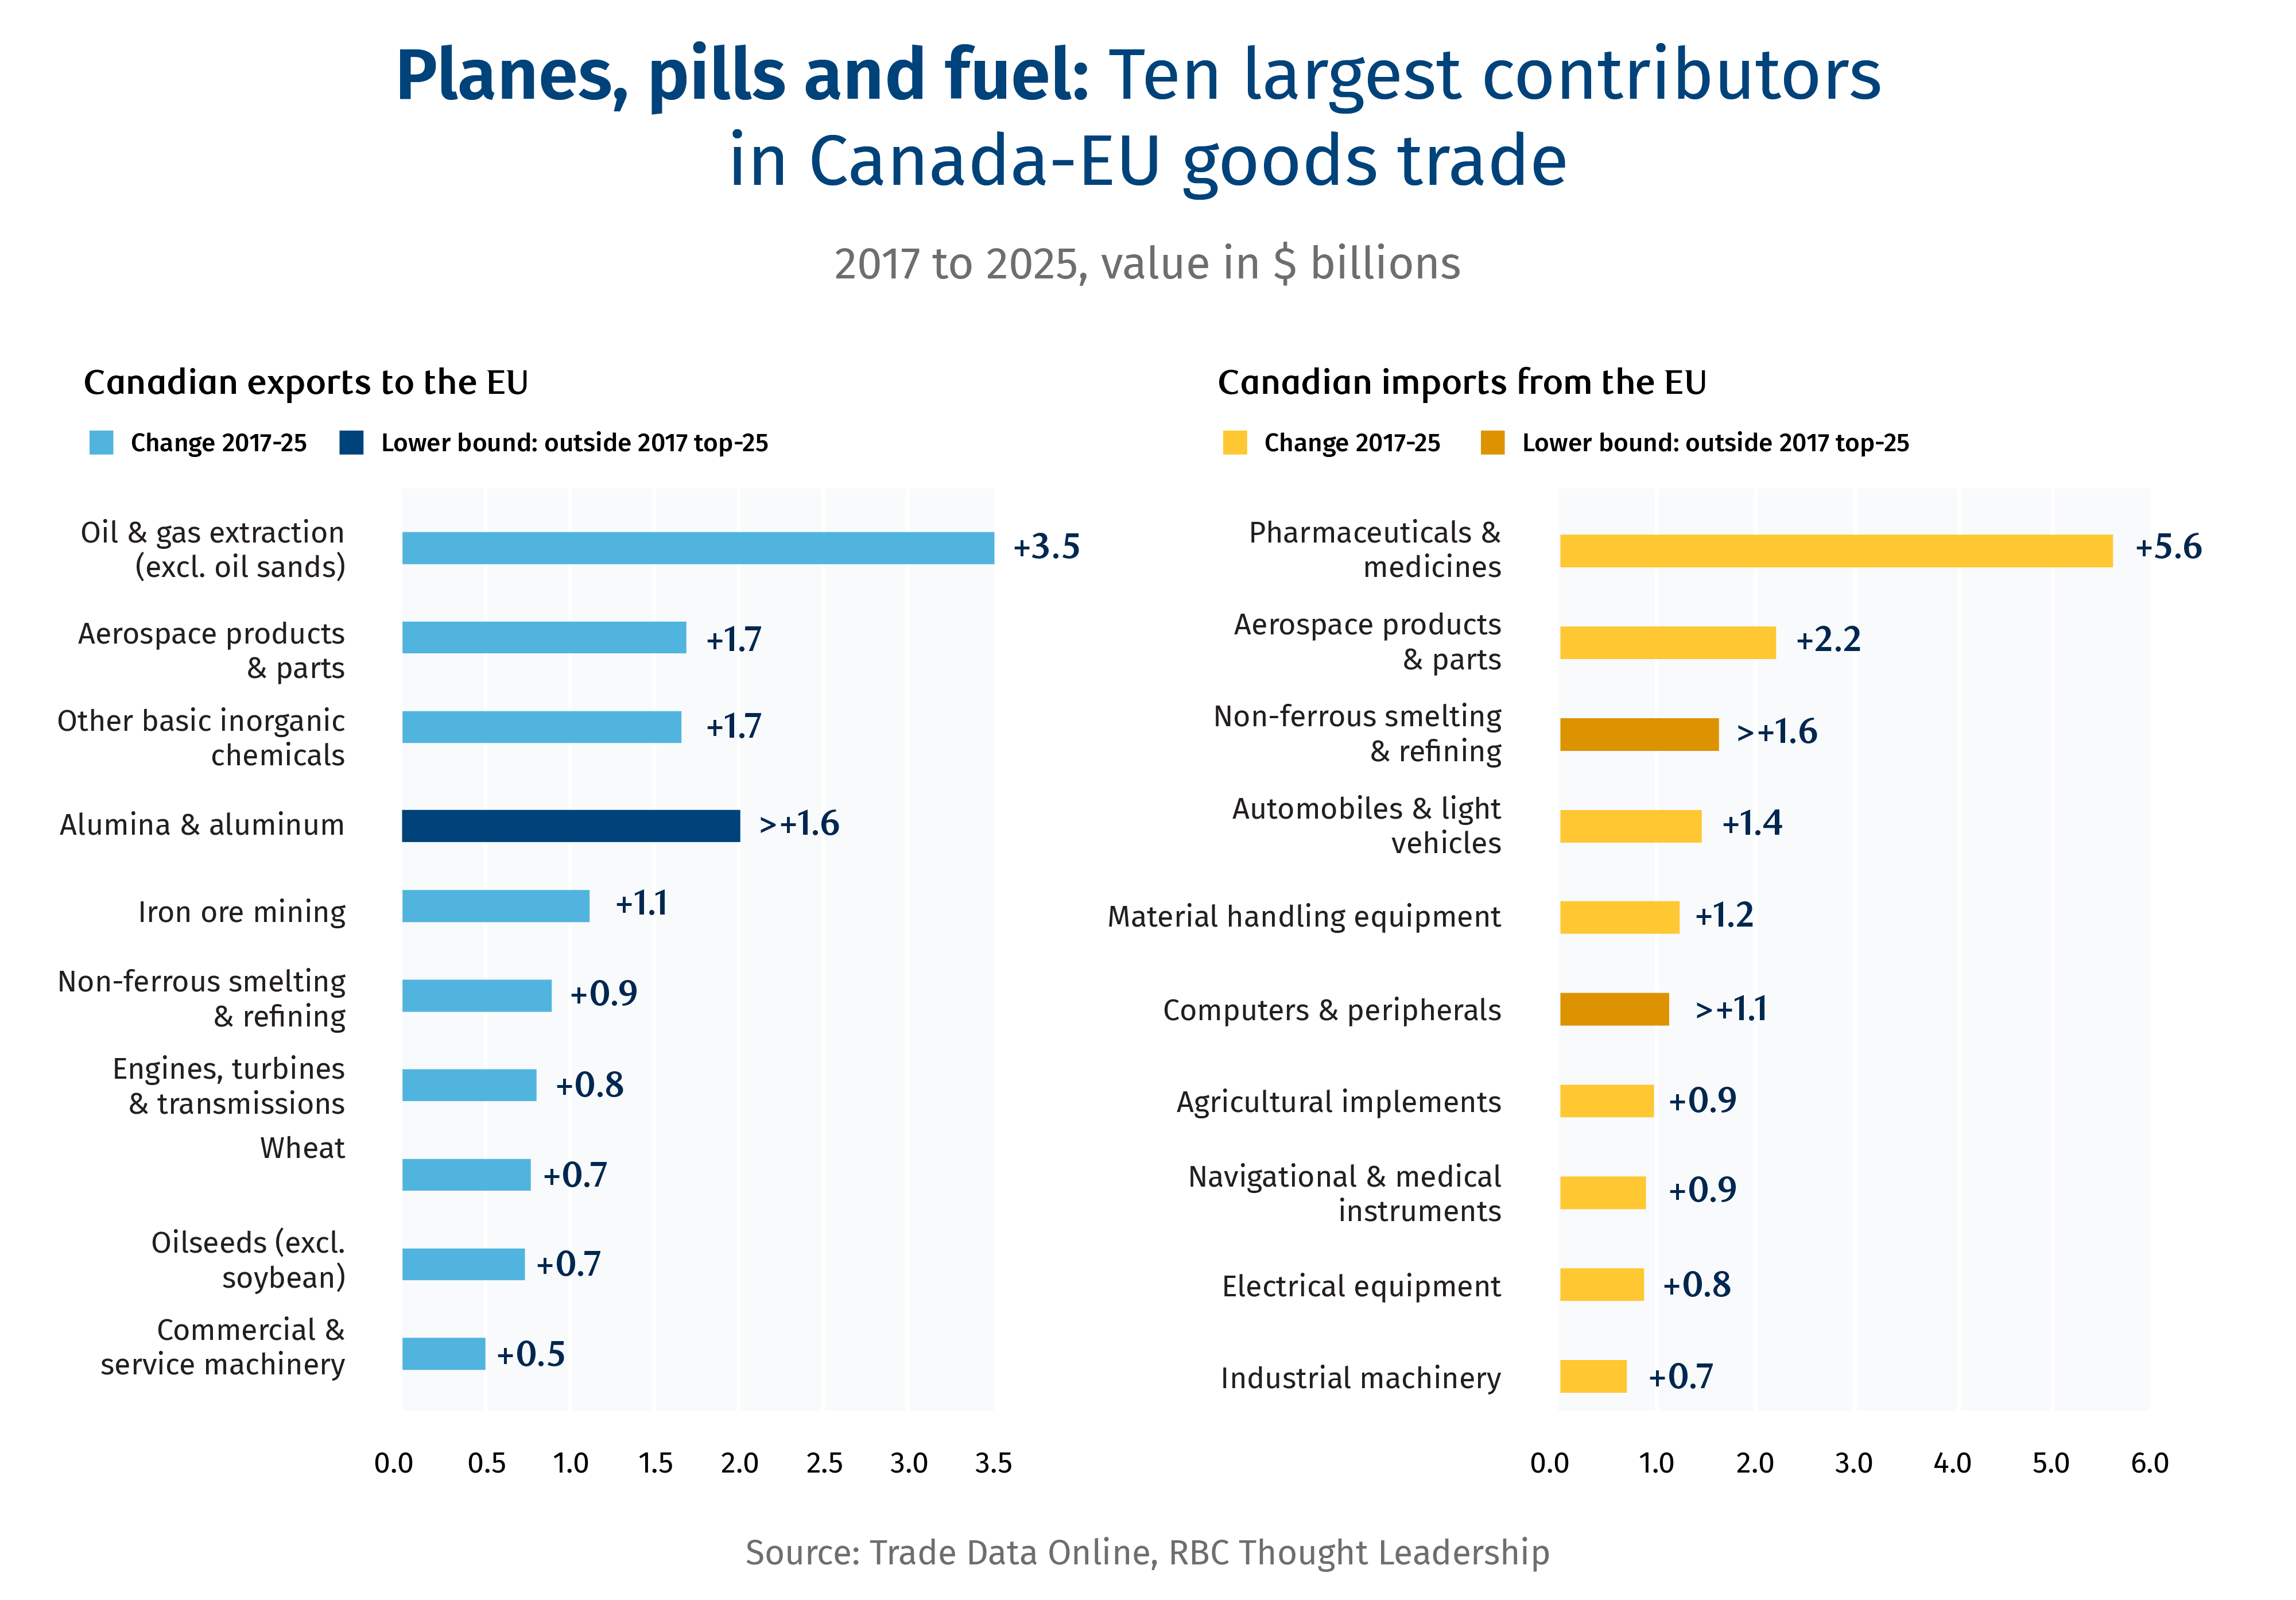
Planes, pills and fuels: Ten largest contributors in Canada-EU goods trade

Aerospace shows that two-way manufacturing trade across the Atlantic works, with further opportunity in the steel and aluminum sectors. Auto assembly is likely to remain challenged, until tariffs are lifted and the North American market electrifies.

North American and European manufacturing industries are struggling with excess capacity, weak domestic demand, and heightened competition from China. Global trade tensions complicate an already fragile economic reality. But there are opportunities for coordination in specific parts of advanced manufacturing.

Canada sells the EU raw and semi-processed goods and buys finished products. Manufactured goods are about 65% of Canadian goods exports to the EU (roughly $28 billion) but nearly all of what Canada buys back (roughly $90 billion). That $62 billion shortfall is softened by a $14 billion resource surplus, which leaves the ~$50 billion goods deficit.

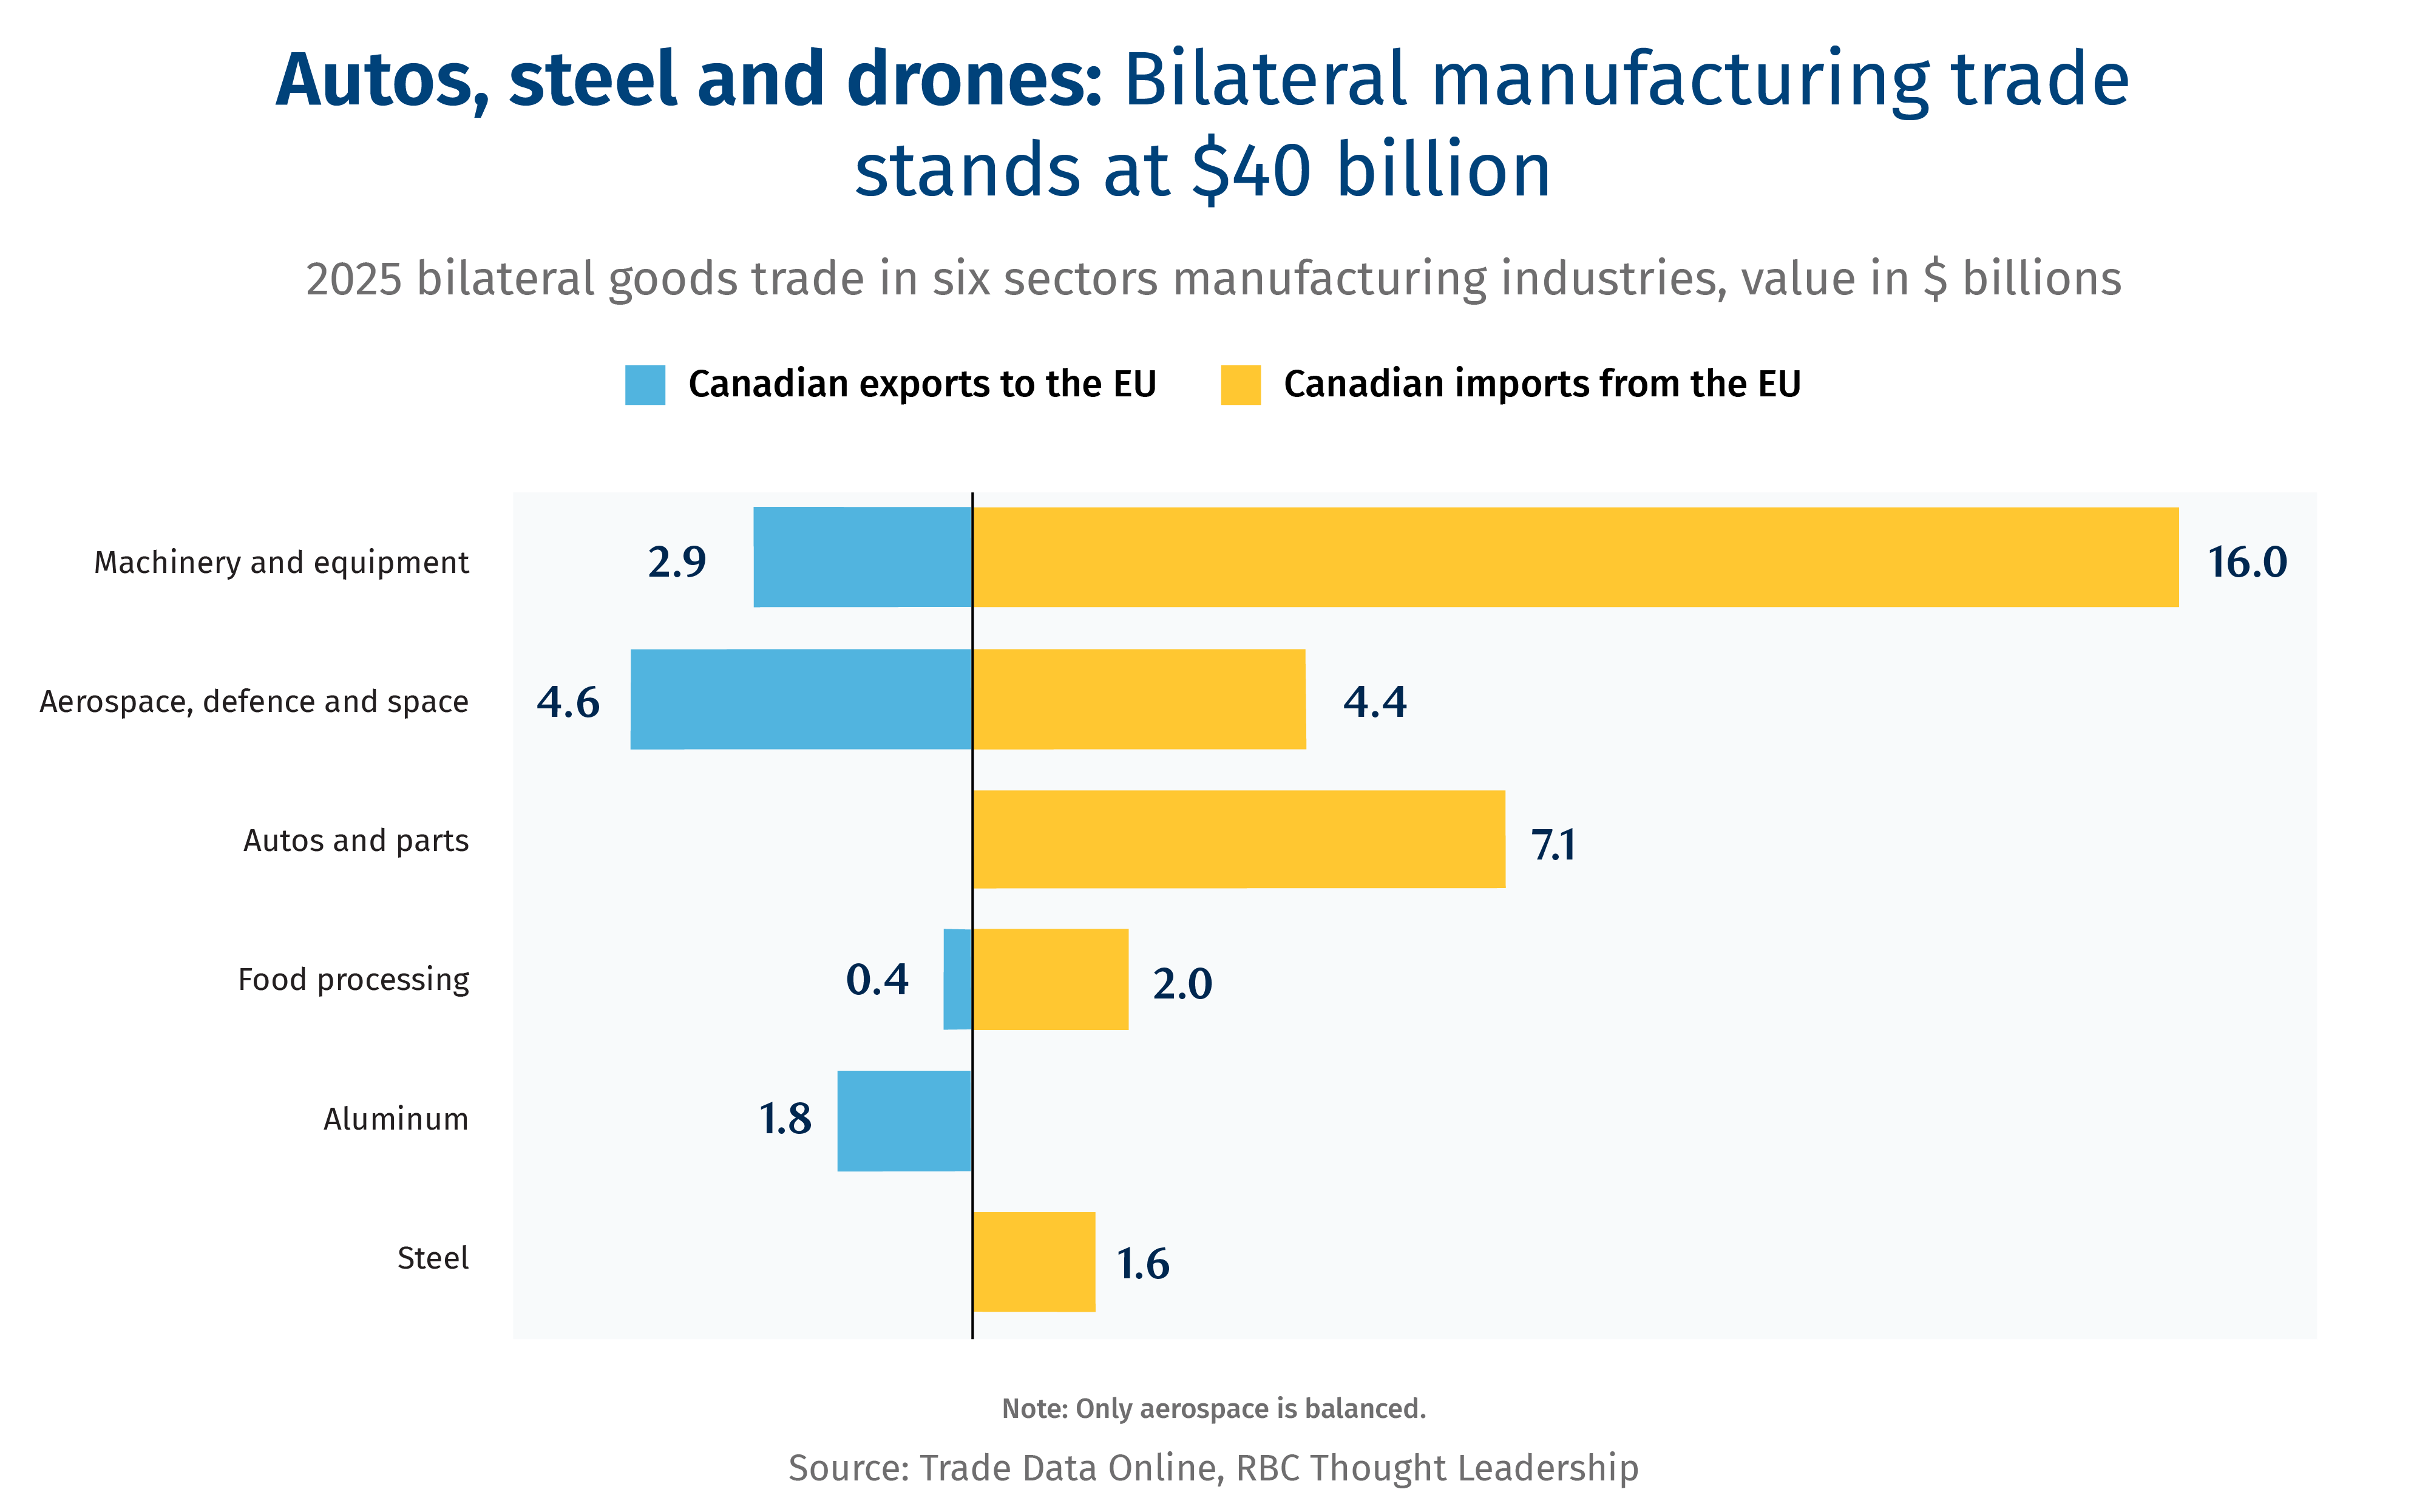
The aerospace industry is the exception to that trend, albeit a narrow one. Canada sold the EU $4.6 billion of aerospace products and parts in 2025 and bought $4.4 billion. Exports are up 60% since 2017. It could form a template for further deepening of ties when it comes to advanced manufacturing.

Autos, steel, and drones: Bilateral manufacturing trade stands at $40 billion

The growth potential

If Canada and the EU traded in accordance with their economic weight, Canadian manufacturing exports would more than double to $65 billion, while EU manufacturing imports would climb past $110 billion.

Aerospace is the template. Extend the same supply-chain model to other areas of advanced manufacturing, including defence aviation, space, electric vehicle assembly, auto parts and build on existing ties for steel and aluminum.

Low-carbon aluminum is an opening. Canada is the world’s fourth-largest primary producer (3.3 million tonnes in 2024) and reports the lowest carbon footprint among major producers. The U.S. took 90% of Canadian exports in 2024.3 The EU’s carbon border levy (CBAM) entered its definitive phase in January 2026, covering iron, steel and aluminum. Under CBAM, carbon intensity becomes a pricing differentiator. Brussels deducts carbon prices paid abroad, but only what is actually paid counts, net of rebates and free allocation, all of which must be independently certified.4

Steel is a smaller prize. Canadian mills sell little to Europe today and quotas are tight. The EU’s regime caps quota volumes at about 18 million tonnes and charges 50% above that threshold. Canada is listed as a free-trade partner but has not secured any quota of its own. The CETA goods committee has a technical meeting on overcapacity and an exchange on Canada’s melt-and-pour rules in train.5 Canada could use it to ask for a country quota, or guaranteed access to the pooled one, and offer reciprocity on Canada’s own quotas.

Autos: capitalize on existing EV investments, position to win new mandates. In Canada, final assembly is dependent on duty-free access to the American market, not CETA. Some 90% of what Canada produces is exported, and 90% of those exports go to the U.S. Parts and battery materials are less constrained. Canada’s goal of 75% EV sales by 2035 could eventually anchor demand, but is hemmed in by U.S. policy. Given the absence of EU-based assembly plants in Canada, and their absence of mention from Canada’s new auto strategy, the possibilities around enhanced partnership are limited.6 Options to catalyze investment include:

  • Co-invest with EU manufacturers. The Strategic Response Fund backed Volvo’s Prevost with $18.5 million on an $87.5 million project. Similar terms could be offered to EU parts, battery, and machinery makers.7

  • Canada’s EV incentive rules. EV incentives cap the price of imports from free-trade partners at $50,000, but not Canadian-made EVs, which face no cap.8

Burdensome regulations have limited Canada’s ability to make Europe a key export market, but there are opportunities ahead in supplying the bloc with critical agriculture commodities, including grains, protein and potash.

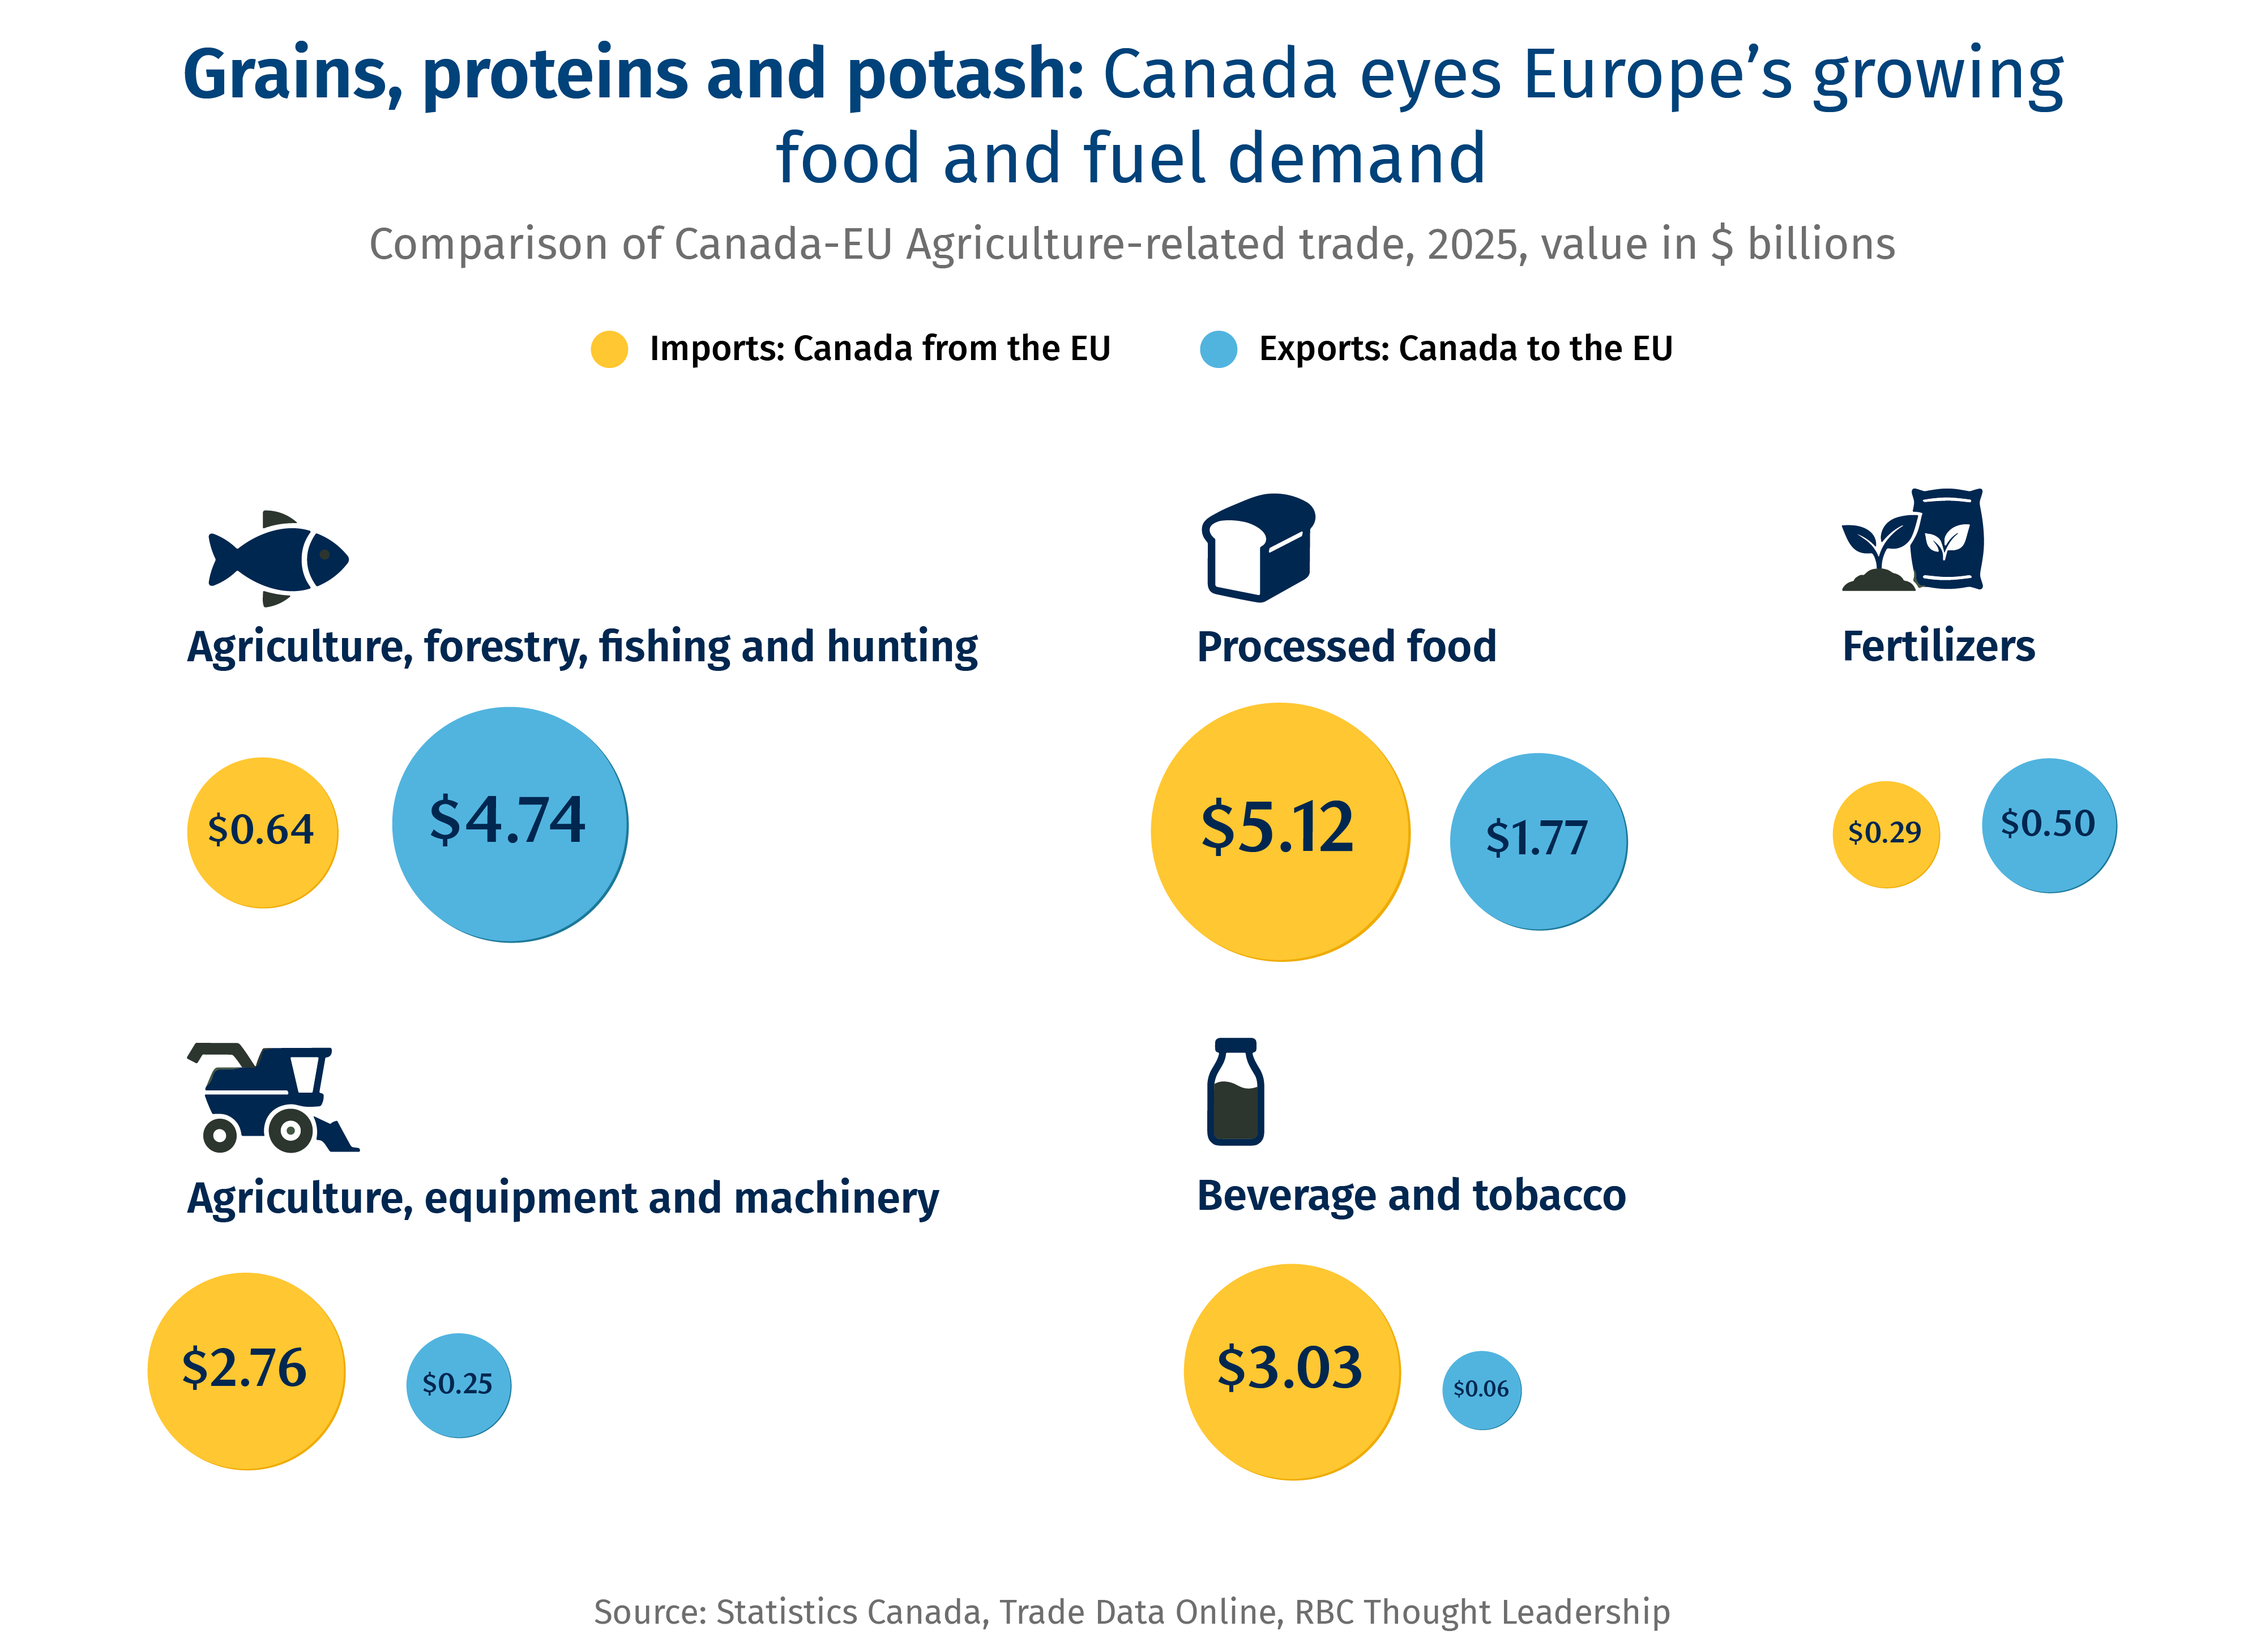
The value of the farm and food trade between Canada and the EU has roughly doubled in both directions since CETA took effect. Yet, the EU still only accounts for a small share of what Canada exports, at just over 6% of its Agri-exports in 2025. Canada sold the EU $7.32 billion of farm, fish, food and agriculture input products in 2025, and bought over $11-billion worth in return.9

The type of agricultural goods Canada and the EU exchange are very different. Europe is a large, wealthy, and mature food market that is already self-sufficient in most staples. The EU exported €238 billion worth of agrifood products last year10, with close to a €50 billion surplus, so its Canadian imports are goods or commodities it doesn’t produce in such large volumes, like primary grains. Canada’s major shipments to Europe are largely bulk grain and oilseeds, including canola, soybeans, wheat and corn, as well as potash fertilizer, while Europe’s food export basket to Canada primarily consists of prepared foods and drinks, such as wine, spirits and cheese, along with farm machinery.

Grains, proteins and potash: Canada eyes Europe's growing food and fuel demand

The growth potential

As the EU looks to improve resiliency in its agri-food supply chain, and Canada looks to grow its exports beyond the U.S., there are multiple areas that can benefit both partners.

Protein and oilseeds offer clear room to grow. In 2025, Canada bought $106 million of pork and $71 million of beef from Europe, while selling the EU just $6.5 million of pork and $24 million of beef.11 Growing those sales depends partly on Canada pressing the EU to recognize its food safety and quality standards, which currently limit Canadian exports.

Canada’s low-risk rating under the EU’s new deforestation rules, which cover cattle and soy, gives Canada a modest advantage over countries like Brazil and Argentina. Canola exports to the EU exceeded $1 billion in 2025, most of it seed crushed for biofuel, with meal going into animal feed. The EU is phasing palm oil out of its biofuel schemes by 2030, which leaves more room for sustainably produced Canadian canola.

Fertilizer is another strong opportunity. The EU began phasing in tariffs on Russian and Belarusian fertilizer in 2025, rising to €430 a tonne by 202812, to cut its dependence and Russia’s war revenue. Canada is the world’s largest potash producer, with about a third of global output13, and supplied 39% of world potash exports in 2024, about the same as Russia and Belarus combined.14 Canadian producers could sell more in Europe if they expand output and if rail and port capacity can move it east, or through the seasonal port at Churchill.

Regulations remain an obstacle. CETA did not change the regulatory requirements to access the EU market, limiting its ability to translate into higher Canadian exports. Examples of these requirements include restrictions on growth hormones in livestock, the use of peroxyacetic acid to control bacteria on meat carcasses, and testing for trichinosis, a disease Canada is free of.15 Compliance challenges are a key reason Canadian beef exporters use only about 3% of their EU duty-free quota.16 Most Canadian feedlots use growth hormones on cattle, and Canada’s two largest meat packers use sanitation products not accepted by the EU. Other EU rules, like those governing genetically modified crops, maximum pesticide residue levels, and sustainability requirements like deforestation prevention, further complicate market access and constrain export growth.

However, Canada’s National Food Security Strategy, which aims to strengthen competition in domestic food processing, could create an opportunity to develop a more flexible processing capacity tailored to export markets with distinct regulatory requirements that could help producers reach the EU in a more meaningful way.

Domestic infrastructure investment could open the doors to the EU. The United States is Canada’s largest trading partner, taking over 60% of Canada’s agri-exports in 2025.17 Canadian farms, packers and processors are built into North American supply chains that shared a common set of rules. As it stands, shipping Canadian agri-food products from points of production, which is often the Canadian Prairies, to the eastern ports that serve European markets is expensive – generally even more so than shipping across the ocean. Efficiency enhancements and other domestic infrastructure investments are core to growth in transatlantic trade.

Europe’s greatest need is energy, which is also Canada’s biggest strength, yet the two barely connect. Unlocking energy routes, and supplementing it with rising minerals, nuclear fuel and potash trade, could improve energy security and diversification for both jurisdictions.

Canadian oil and minerals are reaching Europe in record volumes, but from a low base. Mineral exports nearly doubled to $10 billion in 2025 from 2017, while energy (oil, gas and uranium) grew six-fold to $6.5 billion. Together, this makes up 38% of what Canada sells to the EU, up from 28% in 2016.

That growth says little about CETA itself. Crude oil was already duty-free, and the agreement removes tariffs only on refined and processed products, at up to 4.7% for non-crude petroleum. Canada’s energy flows are shaped more by geography than tariffs, with its oil and gas organized around the U.S. market.

Geopolitics is changing that. Europe’s hostile relations with Russia, one of its principal energy sources, and turmoil in the Middle East present an opening for resource-rich Canada. Aggressive U.S. trade policy has only added to the urgency on both sides. Europe’s demand for secure, non-Russian and non-Chinese supply is now written into law: the EU is ending Russian pipeline gas by September 30, 2027, and its raw-materials rules push buyers toward diversified suppliers.

Canada runs a goods deficit with the EU of about $49 billion, but energy and minerals enjoy a combined surplus of about $6 billion. Minerals and metals exports stand at $10 billion, with the EU taking 7.4% of Canada’s exports, though the basket is mostly iron ore ($3 billion), aluminum and nickel.

The growth potential

The EU wants to diversify its energy supply, and Canada its market base. The alignment could come from natural gas but also minerals, and nuclear fuel. With meaningful economic, emissions and energy-security gains at stake, resources could prove to be the biggest area of cross-Atlantic collaboration.

Oil demand has limited potential but could still expand. Europe favours the light-sweet grade from the Newfoundland and Labrador offshore; exports hit a high of $3.9 billion (from $2.1 billion in 2024 and $300 million in 2016), partly as U.S. tariffs pushed exporters to find other buyers. Meanwhile, much of Canadian energy infrastructure points south, with the U.S. taking about 90% of its crude, refined product and gas exports. Ironically, Canada is a net importer of refined fuel with the EU, which supplied around $2.2 billion in 2025, (mostly from the Netherlands and Belgium into Quebec and Nova Scotia), with exports at $800 million. Long-term EU demand for fossil fuels is forecast to shrink, which makes it harder to build new Canadian energy infrastructure facing east. The International Energy Agency projects a 730,000 barrel-a-day decline by 2030, while Asia sees a two-million-barrel-per-day increase. EU gas demand is forecast to fall from 275 billion cubic metres to as low as 190, by one estimate.

Canadian gas has a strategic role to play. All of Shell-backed LNG Canada’s 2025 cargoes were destined for East Asia, and its Phase 2 expansion targets Asian customers. There are circuitous routes, however, to get Canadian gas to European customers. Germany’s state-owned SEFE recently signed a conditional agreement for one million tonnes per annum (mtpa) from the First Nations-backed Ksi Lisims LNG project, and Uniper a binding 20-year deal for 2 mtpa, with first deliveries in 2032. But both are destination-flexible, and France’s TotalEnergies, with its own 2 mtpa deal, said it would serve Asian customers. Europe may end being a customer and financier of Canadian LNG, but not always its final destination.

EU’s emissions rules could favour Canadian energy. The EU’s Methane Regulation requires fossil-fuel importers to demonstrate equivalent monitoring, reporting and verification from January 1, 2027, with emissions-intensity limits from 2030. Proposed delays remain under negotiation, reflecting concerns about energy costs and supply security, but structurally this is a win for Canada either way (low intensity and politically stable). Canada’s methane controls could help its LNG suppliers meet these requirements and appeal to European buyers; electric-drive liquefaction powered by B.C.’s low-carbon electricity would place Canada amongst the lowest emissions intensity LNG, globally. This could strengthen Canadian LNG’s appeal through either direct delivery or cargo swaps, subject to EU compliance requirements.

Filling the processed critical minerals refining gap. China dominates processing of most battery minerals, so Canadian nickel or cobalt refined in China does little to reduce Europe’s dependence. The EU’S Critical Raw Materials Act’s 2030 benchmark, which states that no more than 65% of any strategic raw material can come from a single third country, could change that. A 2026 joint statement and non-binding letter of intent between the European Investment Bank and Canada could lay the groundwork, and Quebec’s Dumont nickel project is the one Canadian project the Commission has named a third-country strategic project, which can open access to EU financing. What is missing is offtake and processing: European buyers committing to Canadian nickel, cobalt and aluminum, and refining built in Canada rather than China.

Nuclear fuel is the most direct way to displace Russia. Uranium is the one commodity in which Europe is a major Canadian customer, taking as much as 45% of its uranium exports, according to one estimate. Canada is already the largest uranium supplier to EU utilities, with Saskatchewan-based Orano (25%) and Cameco (21%) providing a sizeable portion of EU’s processing needs. Russia still supplies about a quarter of EU conversion services (Rosatom, 24%) and enrichment (23%), so long-term contracts between Canadian suppliers and EU utilities are the most direct way to displace it. The Commission promised limits on Russian nuclear fuel in 2025, but there is scant evidence of alternative sources being pursued.

As the only non-European country admitted to the EU’s Security Action for Europe (SAFE) program, Canada is uniquely positioned to build a deeper partnership with its transatlantic allies.

Rising threats from Russia following its 2022 invasion of Ukraine has compelled the EU to bolster its defence industry, with spending set to rise to a record €454 billion ($704 billion) this year, from €418 billion ($648 billion) last year.

In addition to national budgets, the SAFE program lends governments €150 billion at low interest to buy weapons. Normally no more than 35% of a SAFE-funded product’s parts can come from outside Europe, but Canadian parts can make up to 80%.

So far Canada has barely leveraged that advantage: Canada’s exports make up 0.5% of the EU’s defence equipment spending, or about $900 million in 2025. That has gone primarily to Germany ($372 million) and Poland ($217 million).

As global defence needs rise in a more uncertain world, a slew of new opportunities could boost those export numbers. But first, Canada will need to bulk up: Most domestic defence firms are small, and the industry sells 70% of its goods to its Five Eyes intelligence partners: the U.S., U.K., Australia and New Zealand.

The growth potential

Embedding themselves in Europe’s defence supply chains would help Canadian companies advance Ottawa-Brussels efforts to boost security cooperation.

Canadian aerospace could fill an immediate European need. Canada supplied 8.9% of the aircraft, spacecraft and parts imported by the EU in 2025. Germany recently strengthened its independent intelligence capabilities with the procurement of at least three additional Pegasus signals-intelligence (Signit) aircraft based on the Bombardier Global 6000 business jets and is considering an expansion of the fleet by three to six additional units.

Join the Ukraine loan program to widen access. The EU has loaned Ukraine €90 billion ($140 billion) to cover about two-thirds of its financial and military needs in 2026 and 2027. That aligns with Ottawa, which has committed $8.5 billion in military aid since 2022, and with several Canadian firms, including Roshel, Dominion Dynamics and Sentinel R&D, building production partnerships with the Ukrainian industry.

Canada can also seek a cooperation agreement to explore integration into the EU’s IRIS² satellite constellation, as South Korea did in September.

Canada could use its multi-billion defence contracts to embed its companies in the EU’s supply chain. Ottawa recently awarded Germany’s Thyssenkrupp Marine Systems (TKMS) as the preferred supplier for up to 12 submarines—the largest defence procurement in Canadian history. Meanwhile, Sweden’s Saab has bid to build Gripen fighters and GlobalEye surveillance aircraft in Ontario and Quebec if Canada buys them.

Products made in EU factories count as European under SAFE and the loan’s buy-European rules, so work done at Roshel’s Czech joint venture and Davie’s Finnish shipyard qualifies. Ottawa could also leverage its submarine contract and fighter plane contracts to bring Canadian suppliers into the European supply-chain ecosystem.

Supply drones, water bombers and other defence equipment to Europe. The European Drone Defence Initiative, a network for detecting and halting hostile drones, is due to commence by the end of 2026. Ottawa is positioning to capitalize: it has awarded $50 million in contracts to six Canadian drone makers and opened a marketplace of about 400 vetted Canadian suppliers modelled on Ukraine’s Brave1defence-technology accelerator. 

Ground vehicles and their parts were Canada’s largest category of permitted military exports in 2025, worth $930 million across all non-U.S. markets. Canadian firms could also pursue opportunities to build those as part of the EU’s Eastern Flank Watch, a project to strengthen defences along the bloc’s eastern borders.

Meanwhile, as EU braces for frequent wildfires every summer, Calgary-based De Havilland has a deal to supply 22 of its DHC-515 water bombers to six EU countries, with more deals expected soon.

Collaborate on Arctic surveillance. Canada and several north European countries are concerned about environmental impacts, in addition to rising defence and logistics needs in the fast-warming region. Canada’s RADARSAT radar satellites that see through cloud and darkness and are part of European Space Agency’s (ESA) Earth-observation program, could be expanded.

New EU space rules present a new frontier for Canadian firms. Since its induction in 1979, Canada remains the only non-European cooperating state of the ESA. Ottawa’s €407-million pledge to ESA in November 2025 was its largest ever and includes ESA’s new program of Earth-observation satellites for security and defence.

The proposed EU Space Act could also be a boon for Canadian operators, as the EU would waive some of its regulatory and fee requirements for jurisdictions it deems comparable with its framework.

Canada could be a launching pad for EU space crafts. Europe has committed €902 million through the ESA’s European Launcher Challenge to buy launches from five new European rocket companies, with flights due by 2030. While Canada cannot currently launch its satellites from its home base, that could change in a few years as Ottawa is spending $200 million to help develop a launch pad at Spaceport Nova Scotia, near Canso, to be ready by the end of 2026. The Spaceport developer has already secured a contract to launch rockets for Germany’s Isar Aerospace.

As the world continues to ramp up AI spending, there’s opportunity for Canada to work more closely with the EU—but that will require some regulatory groundwork first.

Despite Canada’s privileged access to EU, bilateral tech trade remains small. Last year the EU imported computers, telecom equipment and electronic components valued at €724 million from Canada, and exported €1.6 billion here.

Since 2001, the EU has recognized Canada’s private-sector privacy law as adequate, so companies can send personal data from the EU to Canadian businesses without the enhanced legal safeguards other countries require. Building on that fast-tracked path, the two sides launched a Digital Partnership in 2023, and opened talks on a digital trade agreement in March, laying the ground for more tech-related trade.

The growth potential

Associate membership status could help open door to the EU for Canadian companies.

Europe is spending heavily on AI and cloud. The EU’s InvestAI initiative, launched in February 2025, aims to mobilize €200 billion for AI, including €20 billion for seven large AI computing centres known as gigafactories, and the EU wants to triple its data-centre capacity in the next five to seven years. Europe’s cloud market was worth €61 billion in 2024, but European providers held only about 15% of it. Canadian companies are making inroads. Toronto-based AI company Cohere plans to combine with Germany’s Aleph Alpha, which works with German public bodies, to form a Canadian-led company with headquarters in Toronto and Berlin. Canada and Germany also launched a Sovereign Technology Alliance in February to reduce reliance on foreign technology. In addition, Ericsson, the Swedish telecom-equipment maker, is spending more than $630 million on research in Ottawa and Montreal under a 2024 agreement with the federal government. Mistral AI, the Paris AI model developer, is opening an office in Montreal, plans to open another in Toronto and signed an agreement with the Quebec government in June on using AI in public services.

Few Canadian companies have the capacity to scale up in Europe. CGI earned $6.2 billion from their European operations in their latest financial year. Brookfield, the Toronto asset manager, has committed €20 billion to AI infrastructure in France and up to US$10 billion to an AI data centre in Sweden since 2025. But most companies don’t have the scale: about 99% of Canada’s 48,400 tech firms are small or medium-sized, 85% employ fewer than 10 people and only about a quarter export. The U.S. takes two-thirds of Canada’s tech hardware exports, with the EU and U.K. combined accounting for about 11%.

Europe is moving to keep government cloud and AI work with European providers. The EU’s Cloud and AI Development Act, proposed in June 2026, would generally limit public bodies to cloud providers established in the EU. For sensitive work, providers would also have to be owned and controlled in the EU, with exception only for countries the Commission approves of, and the most sensitive work would carry no exception. Canada could be one of those chosen few jurisdictions.

However, Canada’s consumer data privacy law needs an update. Bill C-36, which would update Canada’s privacy law, has not yet passed. The last update was back in 2000—way before the proliferation of social media—and there are concerns that the EU’s approval of Canada’s privacy laws could be withdrawn.For now, personal data flows freely from the EU to Canadian businesses because the EU judges that law to protect data adequately in line with its own regulations. However, that judgement is reviewed every four years (the next is due in 2028).

Secure associated country status under the new cloud rules. Under the Cloud and AI Development Act, Canada could gain this status, allowing Canadian-controlled providers to bid for critical EU cloud and AI contracts on an equal footing with EUoperators. The catch is that infrastructure, staff, and customer data must stay in the EU, so the biggest winners would be Canadian firms already operating in Europe. Ottawa would have to give something back: keep its privacy legislation up to EU standards and open Canadian public contracts, including Ottawa’s own sovereign cloud purchases, to EU providers on equal terms.

Agree to accept each other’s product testing. The Canada-EU Digital Partnership Council, which first met in Montreal in December 2025, is exploring mutual recognition of testing for AI-enabled and connected products. A deal would let Canadian labs certify products for the EU market, so Canadian makers can test once for both markets.

Language Flag Filename

rbc_language_toggle_menu_flag

  • There are more self-employed young Canadians than ever, but 40% fewer are building businesses that hire than 20 years ago. Two decades ago, 1-in-35 working young Canadians (aged 20-39) owned a business with employees. Today, it’s 1-in-57.

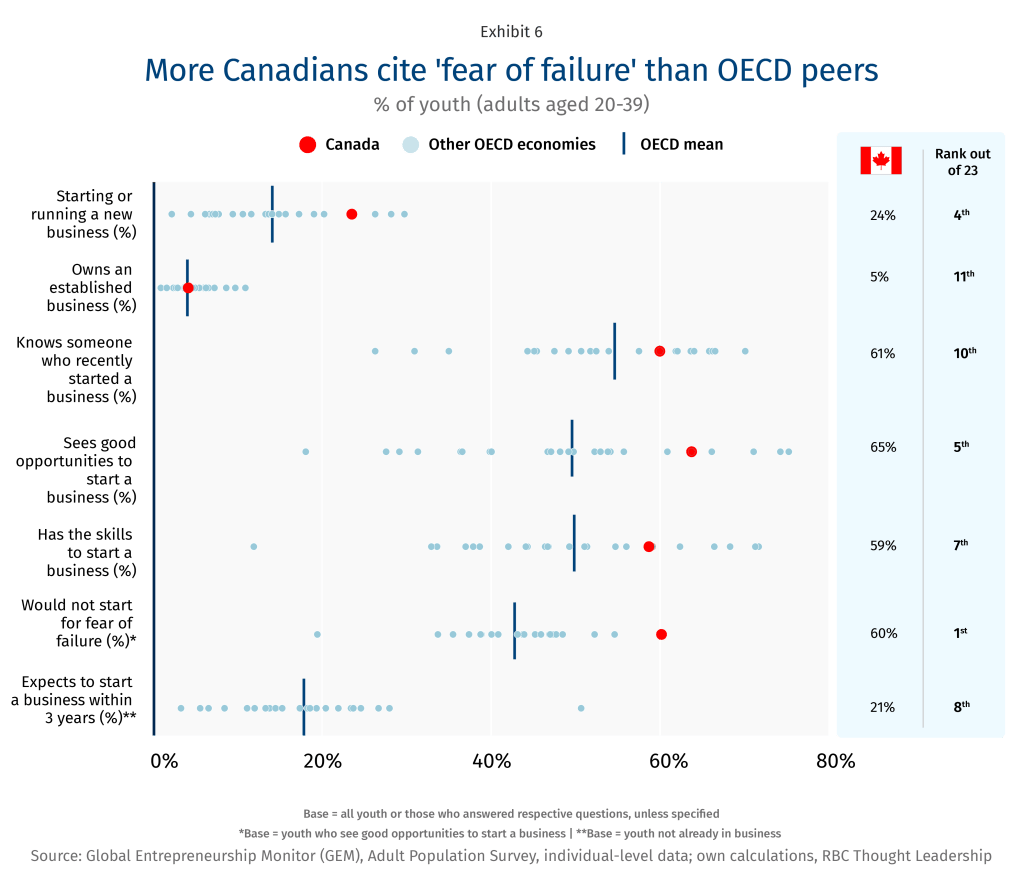
    Young Canadians have enormous entrepreneurial ambition. Two-thirds of young Canadians report seeing good opportunities to start a business, while three-in-five say they have the skills to start a business—both above the OECD average. Canada ranks fourth of 23 OECD economies on early-stage entrepreneurial activity among young Canadians (24%).1 But Canada ranks eleventh on established youth business ownership (5%).2

  • Fear is a key constraint. Nearly 60% of young Canadians would not pursue entrepreneurship for fear of failure—the highest among 22 OECD peers.3

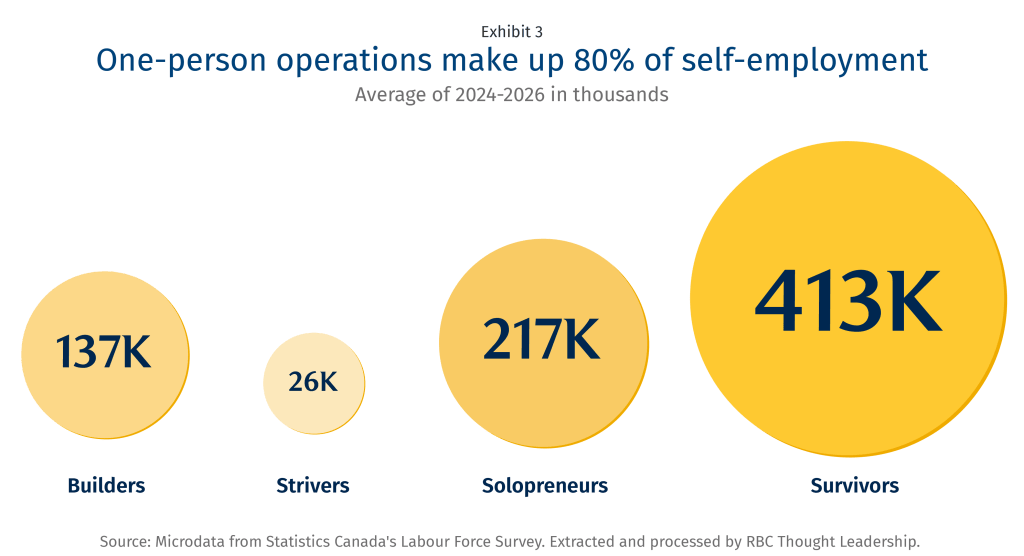
  • One-person shops account for 80% of self-employment in Canada. The types of entrepreneurs who hire have lost ground (‘builders’) or collapsed (‘strivers’). Aside from solopreneurship, the only other category to meaningfully increase is the public sector.

  • The window for transitioning from solo self-employment to employer status is narrow. More than 90% of incorporated businesses that hire do so in the first five years; but hiring rates peak in year one and drop every year thereafter.4

  • Founders describe a scale-up gap. Canada’s support ecosystem dries up at exactly the point where young firms are stalling. Supports for firms could focus on making their first hire through scale-up capital, operator-led mentorship, and lowering the personal cost of failure. 

Scan the headlines and it’s easy to assume that youth entrepreneurship is undergoing something of a renaissance. LinkedIn reported a near 70% jump in those adding ‘founder’ to their profiles last year.5 Almost 40% of soon-to-be U.S. college grads surveyed say they’re leaning towards entrepreneurship over a traditional job. Closer to home, almost one-in-four young Canadians are in the process of establishing a business (13%) or in the early years of business ownership (11%). That’s nearly double the OECD average. In fact, Canada ranks fourth among OECD countries in early-stage entrepreneurial activity.

In absolute terms, Canada has more young entrepreneurs than ever. Last year, more than 800,000 Canadians between the ages of 20 and 39 counted themselves as self-employed, a two-decade high. But digging a little deeper, our research reveals that entrepreneurship among young Canadians, in relative terms, is hovering near a 20-year low. More alarming still is that the share of self-employed young people who employ others is down 40%: 1-in-57 youth presently own an enterprise that employs others, down from 1-in-35 two decades ago. One-person shops account for 80% of all self-employment in Canada—a trend with wider economic consequences.6

Youth entrepreneurship—especially the building-companies-that-scale variety—is core to a healthy, dynamic economy and to broad-based prosperity. We‘re talking about the next Shopify, the next Cohere. It’s the young who tend to create the next big thing—the products and services of the future. Look no further than the 10 largest publicly-traded firms in the U.S.—mega-cap tech companies like Apple, Microsoft, Meta, and SpaceX. On average, the age of the founder at incorporation was under 30.

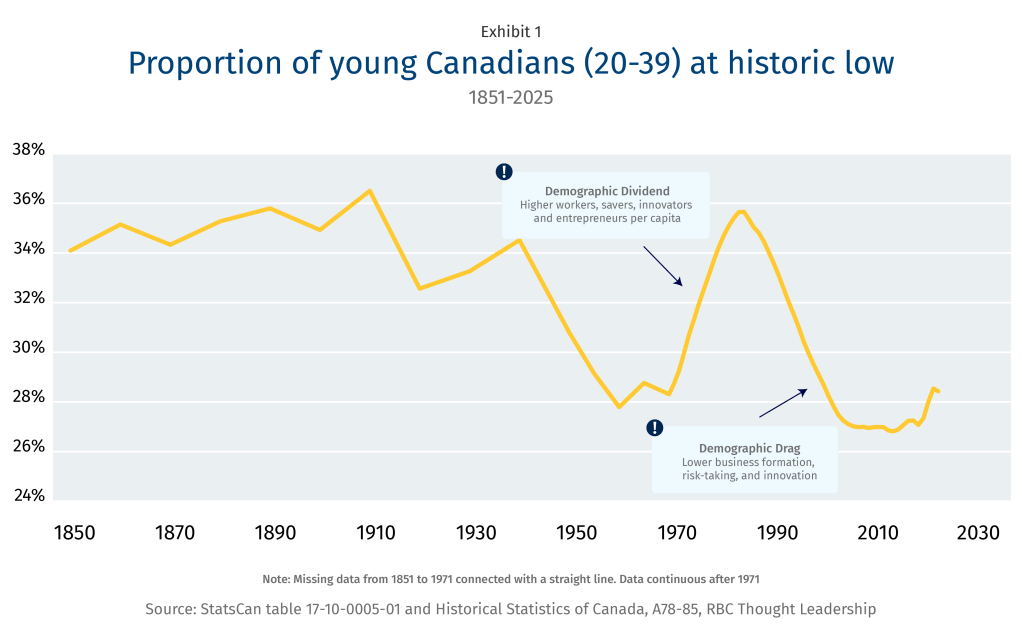
Propotion of young Canadians (20-39) at historic low

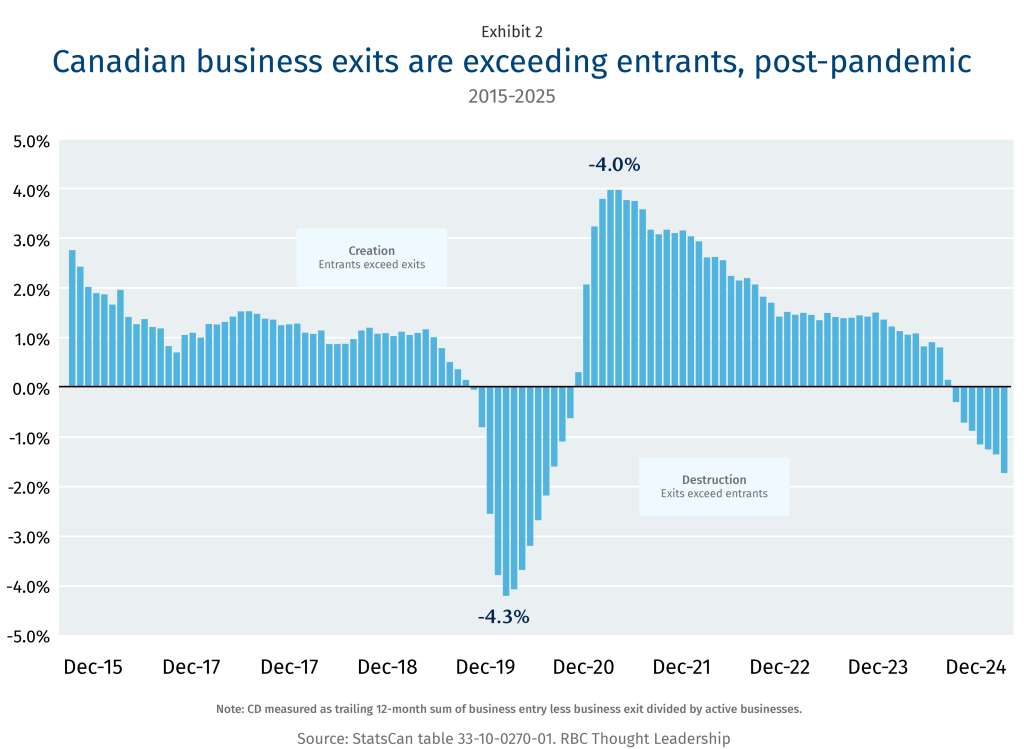
Two forces threaten to make things worse. For one, there are fewer young people in Canada as a proportion of the total population, due in part to falling birth rates (Exhibit 1). A further headwind comes with trends in business formation. The pandemic era saw excessive business destruction, unsurprisingly, followed by a surge in creation, post-lockdown (Exhibit 2). But over the past five years the rate of net new business creation has been falling. U.S. tariffs, a more restrictive approach to immigration, and a challenging policy environment could all be factors. The affordability crunch may be another reason that young people aren’t taking the leap.

Canadian business exists are exceeding entrants, post-pandemic

RBC Thought Leadership spoke to young founders across the country, representing a range of industries in different stages of growth. Many noted various obstacles when it came to scaling their businesses. While supports are available at launch—from grants to programs like Futurpreneur, Business Development Bank of Canada, Next Canada, and the League of Innovators—access to capital is a persistent hurdle, with Canada’s risk-averse investment culture identified as one factor that has pushed entrepreneurs to seek funding in the U.S., and elsewhere. Mentorship is also cited as a major gap, leaving founders navigating hiring, financing, and expansion on their own.
Given the importance of youth entrepreneurship, civil society and political leaders face a cascading set of trade-offs and strategic tensions. Navigating these is critical to reversing the decline in youth entrepreneurship.

But it’s important to first understand the landscape.

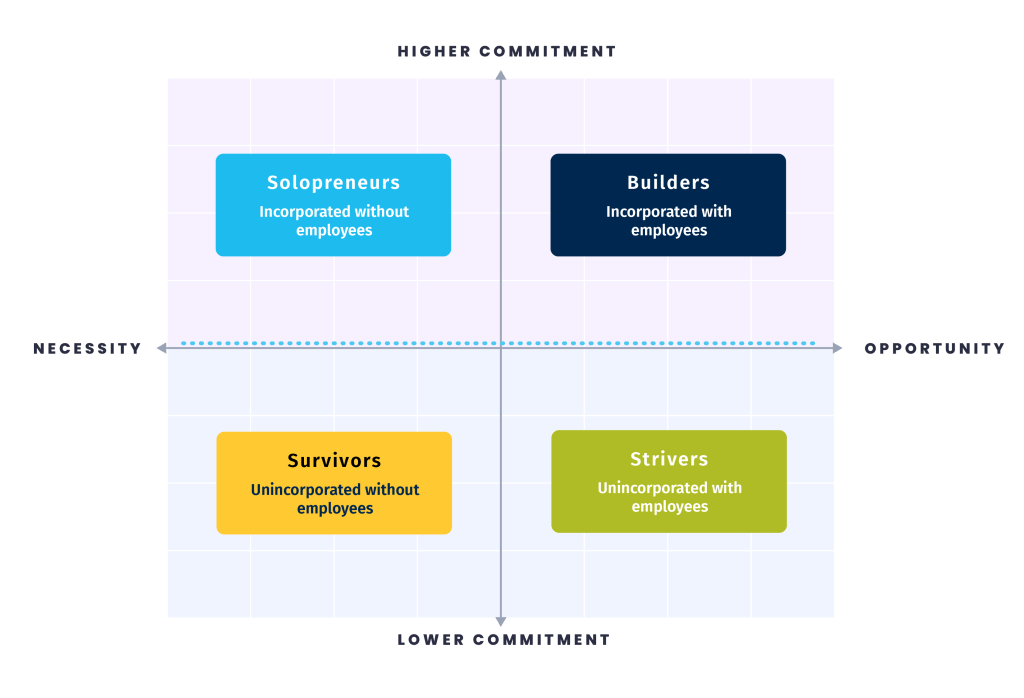
Since Statistics Canada does not break out youth entrepreneurship from the broader population of entrepreneurs, we spliced together more than 1.2 billion cells of StatsCan data to create a new multi-decade history of youth entrepreneurship in Canada. We map young entrepreneurs, between the ages of 20 and 39, into one of four categories, segmented by motivation for founding (opportunity versus necessity) and the level of commitment (lower versus higher), recognizing that the motivations and level of commitment do not cleanly fit this four-way taxonomy, not least because they blend into each other. The four archetypes include (Exhibit 3):

One-person operations make up 80% of self-employment
  • Builders (17%): Motivated by opportunity and legally committed through incorporation, this group includes incorporated business owners with employees. It encompasses a range of enterprises, including restaurants, construction companies, law firms and tech companies.

  • Strivers (3%): The business owners who, for whatever reason, have remained unincorporated while employing others. Together with the builders, these are ‘entrepreneurs’ in the traditional sense of building and scaling a business.

  • Solopreneurs (28%): Incorporated business owners without employees. This group includes professional, scientific and technical contractors and consultants, but also those engaged in gig and platform work (e.g., ride-hailing, delivery services).

  • Survivors (52%): This category has the highest turnover and is the most insecure among the self-employed insofar as the enterprises are unincorporated without employees. This includes those between paid employment, bouncing between contracts, as well as consultants, freelance writers, small farmers, street vendors, artists, and gig workers.

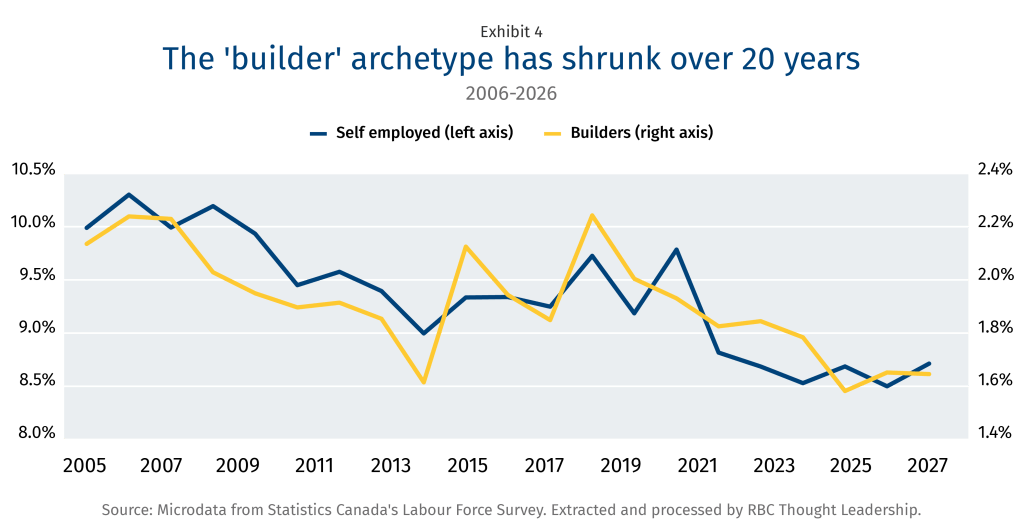
The self-employed among young Canadians skews massively toward solo forms of self-employment, with four-in-five operating a business without employees. This may limit the potential to meaningfully scale and become the type of lucrative enterprise that creates broad-based wealth through the production of goods and services, and indirectly through the payment of wages, salaries, and taxes. It’s unclear if AI will change this calculus. It’s possible that young founders can leverage this technology to scale an enterprise with few (if any) employees, given that AI is proficient at an expanding range of tasks. In the interim, it’s concerning that the share of young people who fit the builder archetype is shrinking: 20 years ago, 1-in-45 young people owned a business with employees. More recently, it stands at 1-in-63 (Exhibit 4).7

The builder archetype has shrunk over 20 years

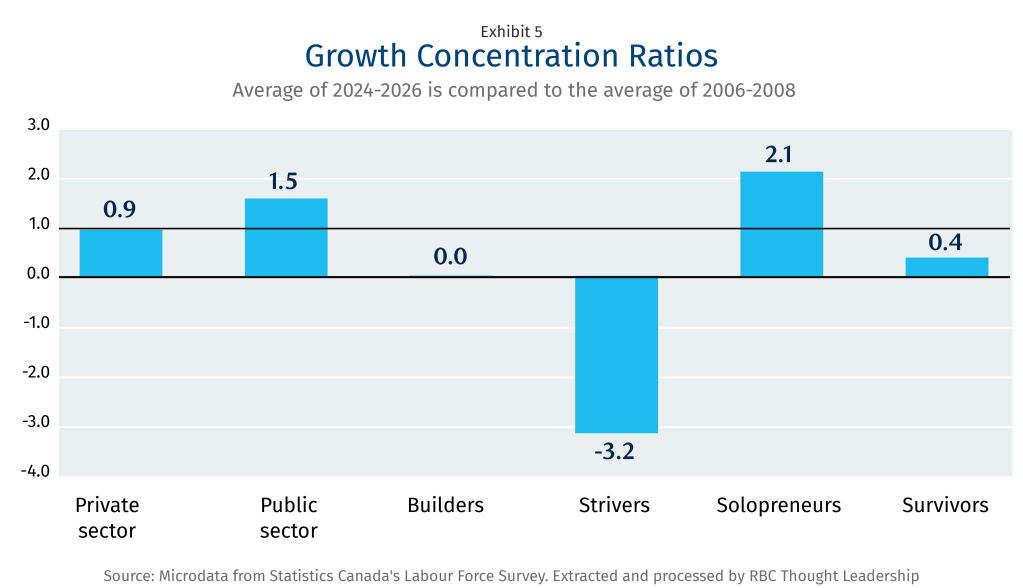
To be clear, not all entrepreneurship has stagnated among young Canadians; it has bifurcated. The types of entrepreneurship that scale enterprises by hiring employees have lost ground (builders) or collapsed (strivers). And all have been dislodged by the surge in solopreneurship. The only other category to meaningfully increase is the public sector (Exhibit 5). The reasons for this are not clear, but the public sector tends to offer higher levels of job and retirement security. Amidst an affordability crunch, growing public sector employment could be interpreted as a flight to safety.

Growth concentration ratios
A growth concentration ratio shows whether a category is gaining or losing share of the economy as it grows. A ratio above 1 means it’s capturing more than its ‘fair share’ of new employment relative to its size, while a ratio below 1 means it is shrinking as a share even if it’s adding employment in absolute terms.

The rise of solopreneurship is more challenging, partly because of the mixed motivations at play. Surveys show that young people are pulled into entrepreneurship because they value flexibility, purpose, and social impact, or because they believe entrepreneurship is simply more lucrative.8 But young people also report being pushed into entrepreneurship because many entry-level jobs are vanishing, which eliminates the traditional pathway to middle class security and prosperity.9

Despite the mixed motivations, what seems clear is that there is an elevated desire among the young to at least explore entrepreneurship.  Nearly two-thirds (65%) see good opportunities to start a business in Canada and feel they possess the skills to launch a new enterprise (59%), both of which are well above the OECD average. But as a recent survey by Ownr revealed, while 23% of those surveyed have a side hustle, only 19% of them were thinking of handing in their two weeks’ notice and taking the leap into full-time entrepreneurship.10

So what’s holding would-be entrepreneurs back?

The high cost of living—especially housing—for one thing. When food and shelter costs are rising it makes self-financing a new venture riskier—or in some cases a non-starter. A Be Giant poll of young entrepreneurs in Canada found this to be the top reason why Canada is losing entrepreneurial talent to other markets.11

Fear of failure is another factor (Exhibit 6). According to Global Entrepreneurship Monitor (GEM) data, 60% of Canadians surveyed said they would not start a business because the probability of failing is too great. Canada is an outlier on the fear metric, ranking first out of 22 peers and well above the OECD average. This meshes with what we heard from founders who said culture—including a fear of failure—may be limiting the pipeline. Matthew Hibbert, CEO of Winnipeg-based MAKA Power, said that failure is often viewed negatively in Canada compared to other countries like the U.S., for instance, where “it’s more celebrated: they had the guts to try to start a company, and that should be celebrated. There has to be a shift towards celebrating the people who tried and failed.”

More Canadians cite fear of failure than OECD peers

In speaking with young founders across the country, here are some of the other things that they faced—and in many cases overcame.

Access to capital remains a barrier. Entrepreneurs repeatedly cited difficulties in securing funding at various stages of launch. While the early-stage ecosystem offers many supports and programs, young founders often face a credibility challenge, particularly when the business is still just an idea. Canada’s scale-up risk capital eco-system is comparatively thin, which drives many founders to the U.S. Several entrepreneurs were advised to seek capital stateside, where it can be easier to access and on more favourable terms. “If we want more Canadian companies ready for growth capital, we also have to create more opportunities for promising ideas to reach the growth stage,” said Chloe Swain, 20, CEO of FutureTwin, a Vancouver-based tech startup.

Supports dry up at scaling. Capital is a particular challenge when it comes to helping businesses reach the next level. In the initial days of launching, Maguire Shoes cofounder Romy Belzile-Maguire said the company was able to use early-stage funding and pre-sales to drive growth. As the Montreal-based company grew, financing became more of a challenge. “You can get help at the beginning, and you can get help when you’re a big company and more profitable. When you’re in between, you’re kind of on your own,” she said. “You’re too big to be small, but too small to be big.”

Mentorship and network density is lacking. Every founder we spoke with emphasized a desire for more mentorship opportunities throughout the lifecycle of entrepreneurship. “Canada doesn’t only need more entrepreneurs,” said Francesca Chan, founder of Artket Goods in Toronto. “We need stronger connections between the entrepreneurs, suppliers and businesses that are already here.” Founders noted the importance of mentorship in managing the stress and difficulties associated with starting a business, as well as guidance to avoid costly mistakes. Some also expressed a desire to have entrepreneurship opportunities encouraged and tied to postsecondary programming, which is lacking. Early exposure and connections to entrepreneurs could also help spark innovation: most of the entrepreneurs we spoke to came from entrepreneurial families.

Labour and skills matching are an obstacle to hiring. As companies scale, they need to be able to hire the right talent. Some in high-tech industries said they are facing a skills gap in a rapidly changing and evolving industry. Georgiy Sekretaryuk, CEO of Vancouver-based AI startup Overdrive, said the struggle to find the right talent has pushed him to be creative when it comes to hiring, hosting hackathons and approaching those who have performed well, and offering remote work to expand their potential talent pool. Those relying on trade workers are also grappling with shortages. One founder said that recent changes to immigration policies has made it more difficult to keep some researchers in Canada.

Risk-aversion, both among entrepreneurs and their funders. From investors who may be reluctant to take a chance on an unproven idea, to young people that may be wary of the financial uncertainty that can come with launching a business, many said broad risk-aversion remains an obstacle.

1.  Measure what matters: first hires, three-year survival, and growth

Research from ISED shows that the window for transitioning from incorporated solo self-employment to employer status is narrow: hiring odds fall from 10-16% in year one to just 1% in year five.12 Financial and mentorship support could be concentrated in the early years of incorporation to help new founders not only secure their first customer, but graduate to their first hire. Funders and not-for-profits could report first hires, three-year survival rates, and revenue growth, not applications or startups launched, as the key success metrics, noting that early and scale-up supports are ultimately complementary, not alternatives.

2. Simplify federal programs and judge them on whether firm’s scale

Recent research shows the federal government currently has 166 separate programs that support firms to innovate and grow.13 A young founder must find the right program, learn its rules, and complete its paperwork, and then repeat the exercise for the next application. The associated administrative burn (time spent on paperwork and compliance) detracts from scaling their business. Our research suggests support is strongest at launch and thins out at scale-up. Programs could be reviewed against the measures in the consideration above. Programs that cannot show results should be merged or retired, with the savings redirected to the stage where founders say existing supports dry up.

3. Close the scale-up gap with anchor customers and operator-led mentorship

Canada’s capital ecosystem dries up at exactly the point where its market structure winnows: mid-size, scaling firms. Larger firms and government could commit procurement to young-founder suppliers and pay in an expedited window to ease liquidity constraints (e.g., 15–30 days). Business associations and corporate executives could commit to multi-year pairings with founders who have already scaled and build offerings that combine operational and financial expertise, tailored to the industry and stage of maturity.14

4. Match young talent with young firms

Founders said hiring skilled people is difficult, while youth unemployment runs well above national rates. A first hire of a young graduate helps both sides: the founder gets capacity, and the graduate gets an entry-level job. Large firms, colleges, and industry associations could fund co-op and apprenticeship placements at early-stage firms.

5. Lower the personal cost of failure

Canada ranks first of 22 OECD peers on fear of failure, at 60%. Founders cite the lack of six-figure reserves and a high cost of living as obstacles from launching new enterprises, and possibly, scaling them. Employers could offer entrepreneurial leave with a right to return, treat founder experience as a hiring credential, and consider extending benefits. Education and non-profit leaders could put founding on the curriculum and publicly recognise founders who recovered from failure.

RBC Thought Leadership spoke to young founders across the country, representing a range of industries in different stages of growth.

Photo Credit: Selena Phillips-Boyle

The business: A biotech company in Lavalusing food waste to create biodegradable cleaning ingredients.

How it started: Concerned by the environmental catastrophe that followed the 2013 Lac-Mégantic disaster, Balendra researched strains of microbes that could break down oils to clean up contaminated sites in a natural way as part of a high-school science project. Years later, that original idea grew into Dispersa. 

The challenge: When she started her company, she was still focused on oil spill remediation. Then the pandemic hit. “Everyone was talking about sanitation and surfaces and cleaning our hands. Our key ingredient, a surfactant, can do many things, not only clean up oil spills.” Balendra realized she was developing the right product, but that there was a more strategic market fit.

The lesson: “Agility is a startup’s biggest strength: how fast could we respond to the markets need? At a time when everyone was talking about sanitation and surfaces, I thought, why not? Surfactants are one of the most critical ingredients in everyday consumer products. Fast forward to today, we’re still operating in the cleaning product sector, because it was the right fit.”

Photo Credit: Daniel Ehrenworth

The business: A Toronto-based company that provides air quality solutions for businesses, “doing to HVAC filters what LED lights did to lighting.”

How it started: Blade Air initially started building zero-waste carbon filters aimed at what was then a rapidly growing cannabis industry. Then the market slowed, the pandemic hit, and the cofounders were forced to reevaluate.  They pivoted, expanding their focus beyond only air quality, to energy, operations and logistics using locally manufactured HVAC solutions. 

The challenge: In 2021, the company was awarded a $20 million contract, partnering with another Canadian manufacturer to provide air sanitization technology. But at that point, Blade Air had reported $1.5 million in revenue, losing money along the way. “We were like: ‘Okay, how are we going to finance this?’” 

What worked: Finding financing was difficult. “Accessibility of capital in Canada has been really, really challenging. Even when we were debating doing a raise a few years ago, everyone told us to go to the U.S.—that we were going to find cheaper capital, on more favourable terms,” Fida says. In the end, Blade Air secured funding to go through with the project. “We had to go through a mad scramble until we found a lender that was willing to take shares in our company as collateral.” 

Photo Credit: David Lipnowski

The business: The Winnipeg-based firm delivers educational workshops focused on scam prevention, financial literacy, and cyber security.

How it started: After a decade working in telecommunications, Ducharme kept meeting people who had fallen victim to scams. An Indigenous entrepreneur, he also saw that many community members, particularly Elders, didn’t have access to trusted support.

The challenge: When he was starting the company, Ducharme was negotiating a $90,000 contract that would have “really got us going.” He spent weeks on the proposal, had many positive talks with the potential client—then heard nothing. “They ghosted us,” he says. “It was so discouraging. I think I even shed a tear or two.”

The lesson: “I think it’s okay to be a bit discouraged, but you can’t just be the victim, you have to overcome these things or you won’t be successful as an entrepreneur,” says Ducharme. “After getting ghosted, I contacted my mentor, who helped me identify ways to pivot and strengthen our service. We adjusted our approach—I realized you may have to send out 20 proposals to close one or two—and we began securing new bookings. It taught me that losing one opportunity is not failure. Giving up, or refusing to adapt, is.”

Photo Credit: University of Toronto

The business: A company in Toronto that uses AI and quantum chemistry to speed up the discovery process of photocatalysts to treat water.

How it started: When she was 14, Virgovicova had travelled in India and met many women that were unable to access drinkable water. At 17, she modelled a novel sunlight-activated photocatalyst for water purification. She continued her research at the University of Toronto where she founded Xatoms.

The challenge: Selling her vision and building credibility. Virgovicova was still studying when she first started pitching her idea to investors. “The biggest challenge was we had almost nothing to show—it was really just an idea… they didn’t want to take the risk.” She says some investors were reluctant to invest in quantum technology, opting for simpler proposals and businesses.
The lesson: When you’re young and don’t have much experience behind you, it’s really about storytelling and selling your vision,” she says. Virgovicova received many rejections before she finally got a yes from Quantacet in Montreal, a specialized fund that focuses on investing in quantum technology startups.

The business: A Montreal-based women’s footwear brand that she runs with her sister, Myriam.

How it started: The sisters saw many direct-to-consumer fashion and beauty brands popping up in the early aughts and saw an opportunity to do that with shoes. Combining Myriam’s shoe design background with Romy’s marketing skills, the sisters used their savings—a $15,000 bonus from Myriam’s day job—to produce one shoe in two colours. The business grew from there, and now has four retail stores in Canada and the U.S.
The challenge: The de minimis rule changes in the U.S. upended operations for Maguire Shoes, which was in the early days of an American expansion. “Overnight, we had to completely change our operations—how we shipped, how we brought inventory to the U.S. and our costs,” says Romy. “We had to find cash flow. We had to revise our prices.”

The lesson: “When you’re a small or medium-sized business, you don’t have all the experts around the table, and you don’t have money to pay for the consultants or financers that can help,” says Romy. “So you need to figure everything out yourself.” That meant calling shipping companies themselves, trying out different ways of sending inventory, changing their fulfilment process entirely. “Nobody had the answers at the time, so we had to figure it out ourselves.”

Kickstart: How to ignite entrepreneurship among young Canadians 

Download the Report

Language Flag Filename

rbc_language_toggle_menu_flag

The Canada Investment Summit was unprecedented, on many levels. More than 100 of the world’s biggest investors came to Toronto, representing more than $100 trillion in capital. Canada put more than 500 investable projects and companies on display. Over an intense 48 hours, as people and capital flooded Toronto, the price for some downtown hotel rooms shot above $1,000. Even the fear that Donald Trump might pour scorn on the summit didn’t deter visitors, Americans included. The only no-shows were the Saudis, as their war worries mounted.

Was the summit worth the effort? The true measure of its impact won’t be known for years, through deal flows and, ultimately, economic growth. But in the short term at least, it sent a new message to the world, that Canada has capital ambitions. Here are some other takeaways from the big event:

Even in the age of AI and instantaneous communications, the summit showed how coffee chats and private dinners can still prevail. For all the talk about deals, the summit’s success was rooted in dialogue. That started with the guest list, which required a lot of advance visits, and invitations signed personally by the Prime Minister (and delivered by him in many cases). Then there was the location and vibe. Intentionally, the summit was held in one of Toronto’s fanciest hotels, the Four Seasons, and was largely sealed off to the public. Even if some of the participants complained about the chilly temperature inside, the setting set a five-star tone for a country that for years had small-changed its trade and investment outreach. Moreover, it signalled success is welcome in Canada again (a bit like the celebratory tone down the street at the city’s other big September event, the Toronto International Film Festival). And though the sleek plenary room was half empty for some sessions, that was largely because the real action was in the one-on-one meeting that were designed like rounds of speed-dating (again, not unlike TIFF and its pitch rooms). Global investors could use an app to request bilateral meetings, with many gathering at assigned tables in the hotel’s Cafe Boulud, where Swedes, Chinese, Nigerian and Arabs could be seen chatting with CEOs and cabinet ministers. Expect the summit to be repeated, on an annual or biannual basis.

For all the efforts to get global investors to Toronto, the summit was still heavily American. Roughly 40% of the attendees were from the U.S., many of them institutional investors and private equity deal makers who came for a quick overnight from New York. That’s just the nature of capital markets. Canada and the U.S. remain deeply integrated. (One of the summit’s celebrated deals was Enbridge’s Westcoast pipeline expansion, financed by the American powerhouses KKR and Apollo Global Management, who were both present.) Away from politics (and geopolitics), a bigger force prevailed at the summit: the shift away from U.S. dollar holdings, as global investors look to diversify their portfolios. They’ve already dialed back from China, for risk reasons, and they’re looking to be less dependent on the U.S. Away from those two markets, which account for two-thirds of global capital, there aren’t many low-risk, high-return opportunities, which is now Canada’s play. While we represent 2% of global GDP, and more of global markets, over the past decade we’ve attracted barely 1% of global investment portfolios. A simple calibration could lead to a doubling of inbound investment, which is one reason it’s risk on, Canada. One Trump cloud did hang over the summit. The uncertainty, and political animosity, over Canada-U.S. trade is on many investor’s minds. One industrialist put it bluntly: no matter how attractive Canadian investment looks right now, his board will not sign off on anything that jeopardizes its U.S. interests. 

No question the world still looks to Canada for natural resources: oil, minerals, LNG, fertilizer, food and more. Mining and metals led the summit’s hit parade, with 55 projects in  a “deal book” shared with investors. Some of that, like gold and nickel, has long been a Canadian forte. More novel areas such as lithium, graphite and rare earth elements will be harder to catalyze, because of smaller mines and unique market forces, like the Pentagon’s dominant buying power. Then there’s energy.  Eyes lit up when Canada was described as one of only 10 countries that control 85% of the world’s total reserves—and one of just five not in the Middle East. Beyond conventional energy, investors from the Middle East, Europe and Asia are looking to invest in renewables (wind and solar), battery storage and nuclear. All of that requires resourcefulness—chemists and coders, as well as driIlers and pipefitters—that Canada has. And it will require a more resourceful approach to trade, beyond the basics of commodities trading. Big investors are looking for deals that come with strategic buyers, ideally from their own jurisdiction. For much of the world, investment and trade go hand-in-hand and often is driven by a nation’s strategic interests. That includes strategic goals around cutting-edge technologies. The United Arab Emirates, for instance, knows a lot about renewable energy and battery storage, while Europeans know how to build and finance wind farms. They’re keen to bring that expertise to Canada, along with their capital.

Canada’s military commitments are suddenly an economic advantage, and investors are noticing. Canada has $180 billion in the procurement pipeline, and the money is starting to flow. And it’s not just what Canada’s committing. NATO spending is projected to increase from $1.5 trillion to $3 trillion over the next decade, while the number of people in NATO uniforms is projected to grow by four million. That means a lot more uniforms, a lot more training, a lot more technology—and yes, a lot more weapons. Much of that will be made in Canada, a country that has fluency, quite literally, with many NATO allies. Ottawa’s push for the Defence, Security and Resilience Bank adds to its case for defence capital. Some leading military firms, notably CAE and Bombardier, made their case to investors as to why their hubs, particularly Montreal and Toronto, will need more capital—for new factories, new R&D and new supply chains. Yes, the superpower to the south will continue to push for manufacturing on its own soil, but its labour and supply-chain constraints will mean it, too, will continue to need Canada. Beyond national commitments, there was interest in defence-industrial clusters with global capabilities and ambitions, especially when anchored with leading technologies. Montreal’s aerospace sector, as an example, drew special interest, for its cluster of strong firms, government support and specialized skills.  Canada’s strengths in other areas like drones, radar and satellites also drew attention.

Canada has what the world wants, or so the sales slogan goes. Bigger question: Can we get that stuff to the world? The summit presented a chance to look anew at trade infrastructure. While many Canadians were transfixed by the announcement over private capital for airports, many of the visitors barely noticed. It was so 1990s. Canada will need a lot more of that so-called asset recycling to catch up to the world on a broader mix of trade infrastructure. Expect more to come from seaports and cargo-oriented airports, as well as rail expansion and inland terminals. There could be even bolder moves if the provinces agree to ease up on local transit and utilities. Global investors, who were here for only a day or two, see this moment as a test of Canada’s appetite for economic reform. They’re watching. Away from big-city priorities, far bigger needs remain the Far North and Arctic, where trade infrastructure is coupled with national security, environmental protection and economic reconciliation with Indigenous peoples. Complex infrastructure builds like the Qik port and Grays Bay Road will require major capital commitments, and don’t fit the timelines and risk appetite of many global investors. So, too, will the ambitious proposal to expand the port in Churchill, Manitoba, to ship food and energy overseas through Arctic waters. It’s nation-building stuff that can transcend basic economics, and it will require even more policy and finance innovation from government to help Canadian and foreign investors commit to decades-long efforts.

The U.S. has been the super magnet for tech capital, but increasingly Canada is making a pitch for it, too. The Canadian offer is built around AI talent, reliable and affordable power, and transparent (and consistent) rules. The selling points haven’t gone unnoticed. There are currently 194 active data centres in Canada, with an additional 14 under construction, and another 199 projects that have been announced. At the summit, Bell Canada and the province of Saskatchewan announced a quadrupling of capacity for a new data centre outside Regina. The government of Alberta worked the corridors to explain its own approach to data centres, modelled on the massive $13-billion Meta project. Canada has plenty of domestic capital, with government balance sheets and pension funds, but some of the smart global capital that’s been financing data hubs in the U.S., the UAE, and elsewhere, would be helpful, as those investors bring domain knowledge and global access, including for chips. Customers are a different challenge altogether. While Canada is stepping up to the data centre plate, many large enterprises, both public and private, aren’t fully in the game. One major data centre operator said it has been forced to turn to U.S. customers to store data in Canada. That will have to change—fast. While the data centre debate is raging around much of the world, including the US, they’re still being built at a record clip. One big investor was asked how much time Canada has to prove its case. The answer: “Six to nine months.”

There may not be another G7 country making a bolder pitch for business right now than Canada. But as Canadians know, and global investors are figuring out, the direction of the Canadian economy is as much, if not more, in the hands of the provinces as it is in Ottawa’s. While the two largest provinces, Ontario and Quebec, were noticeably quiet at the summit, Alberta and Saskatchewan worked the hallways aggressively. Saskatchewan Premier Scott Moe, whose province has more than $60 billion in large-scale projects proposed or underway, hosted an Invest in Saskatchewan event to pitch for the next $100 billion. Such provincial engagement is critical. But going more local is proving just as important. Take electricity as an example. It’s a big part of the Canadian pitch, and yet is controlled pretty much by the provinces and often in the hands of local distribution companies. Adding hydro wires requires the consent of local communities, from First Nations to ranchers and small towns. Some investors asked about the capacity of provincial and local governments to engage in major project developments, especially at the speed and scale Ottawa is promising. It’s a question of capacity, and capability, and is about to be tested anew. Some good news: compared to the U.S., Canada is not a hotbed of litigation, which means more room for negotiation and compromise. Same is true for our principles-based approach to regulation compared to Europe’s prescriptive models and all the operating handcuffs they require. Another concern about the provinces is their ability to execute, from regulation to collaboration, on projects.

If global investors have a Canadian blind spot, it’s Indigenous consent. Many have heard stories about projects falling apart over disputes with First Nations, even though those same investors often know little about successes like Enbridge’s Westcoast project, which includes a 12.5% equity stake held by 36 First Nations. The summit allowed for some myths to be dispelled, and more clarity on what Indigenous consent means. For many investors, the idea that Indigenous ownership can signal consent, and also speed up projects, was illuminating. The National Indigenous Loan Guarantee, enabling many communities to raise capital to finance their share of major projects, is now seen globally as a selling feature for Canada. But there’s still a ways to go. One step would be to showcase more Indigenous-led projects for global (and Canadian) investors. That can start with the Prime Minister’s upcoming summit with the Assembly of First Nations in late October, which is a chance to lay out how communities can play a more active role in this new chapter of global capital and Canadian sovereignty. It will be an important test of the new collaboration model for development. Indigenous leaders at the summit know the spotlight is on them, not just from international investors but from their own communities looking for sustainable economic development.

There were plenty of side events, from dinners at the city’s priciest restaurants to working sessions in corporate offices. I joined one at the University of Toronto’s Munk School of Global Affairs, which brought Canadian policy experts together with some of the international teams not at the main summit. The discussion revolved around Canada as a talent hub, a suitable conversation on the campus of a university often ranked as one of the world’s best. Just a few weeks ago, U of T moved up into 24th on the latest Shanghai Ranking Consultancy’s university rankings, which also includes the University of British Columbia (54th) and McGill University (73rd). I told the Munk audience that talent was a theme that many investors brought up. Capital does indeed follow talent, as many investors pointed out when discussing new build-and-operate models for Canada. They’re looking at pharmaceutical opportunities in Ontario and quantum labs in B.C. Because of the talent bases there, often anchored in those world-class universities. And then there’s all those AI investments. No discussion of them at the summit seemed to miss the point that AI was developed in Canada. In addition to education, Canada’s record for immigration—recent challenges notwithstanding—seemed to be another success factor in the eyes of investors. Many are looking for breakthrough opportunities, and they know those often come from immigrants, as well as from companies that can move human capital, in addition to financial capital, around the world.

It may not be the cool Britannia wave of the 1990s but Canada is enjoying some global buzz. We’re suddenly the ‘It’ country. Global researchers are moving here. Celebrities like Ryan Reynolds are talking up our brand. And the prime minister is, perhaps, the coolest global leader, since, well, Tony Blair. One of the reasons so many people came to Toronto for the summit was that it is an attractive destination, again. The summit was an unusual burst of Canadian chutzpah. Parked in a luxury hotel, with dinners at Michelin-star restaurants, there was nary an apology about the expense or the exclusiveness. That’s quite a change from only a few years ago. Even the menus were unabashedly loaded with beef. The relaunch of Invest in Canada, led by Dominic Barton, is another signal of global ambition. Investors noted that countries that don’t sell themselves hard often land hard. Canada needs to seize this moment and ramp up the marketing even more. Who knows, it may even be time for a Canadian edition of Love, Actually, although for now, Heated Rivalry is doing plenty for our cool quotient.

Language Flag Filename

rbc_language_toggle_menu_flag

After hosting some of the world’s largest institutional investors in Toronto, Prime Minister Mark Carney jetted off to address the European Parliament, part of his broader effort to build stronger ties outside the U.S. 

  • Since CETA came into force, trade with the EU has boomed, with the total value of trade reaching more $134 billion in 2025. Canada’s exports to the EU grew 23% annually in 2025 to $43 billion, but the country still has a trade deficit with Europe of around $49 billion. 

  • Canada’s top export to the EU is crude oil, followed by gold, vehicles, other petroleum oils and natural gas.  

  • Within the EU, the Netherlands is the top destination for Canadian merchandise goods, with 22% of trade heading to the Dutch, followed by Germany (21%), France (12%), Italy (9%) and Belgium (9%). All other EU countries represented the remaining 26% of trade.  

  • Quebec is the largest exporter to the EU among Canadian provinces and territories, representing a 32% share of the total, followed by Ontario (27%), the Atlantic provinces (17%), Saskatchewan (9%) and Alberta and B.C. (5%).  

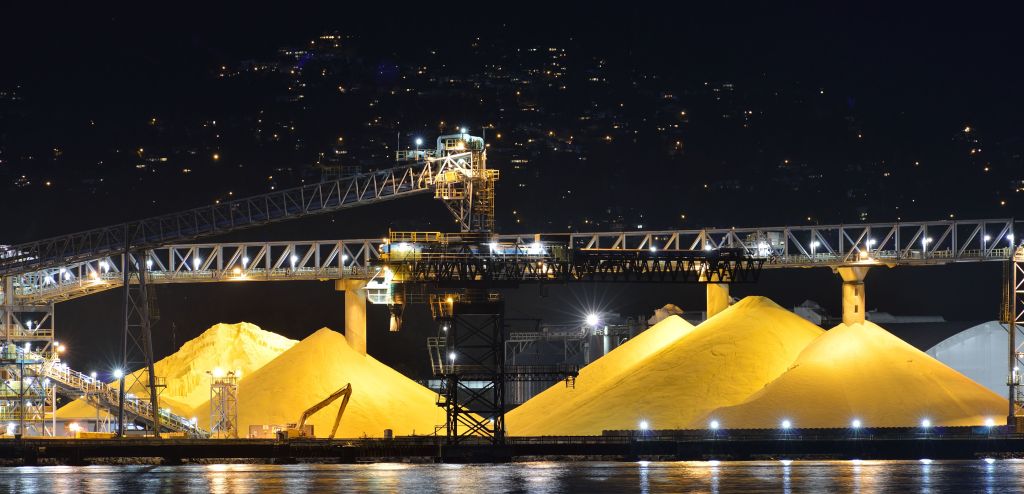
Sulphur prices skyrocketed to record levels in 2026 and remain far above historical norms, putting pressure on fertilizer and crop sectors that need as much as four tonnes of sulphur to make 10 tonnes of finished phosphates, a key fertilizer. 

GMC Trading Group estimates sulphur prices were $874 per metric tonne in June this year, six times the levels seen in 2024.  

Like many commodities, sulphur is being squeezed by shipping disruptions in the Middle East, with alternatives hard to source, supply cannot easily be ramped up to meet demand. Sulphur is largely a byproduct of the oil and gas industry, with Gulf states supplying 50% of globally marine-traded sulphur.  

To shore up its domestic sulphur stocks, China banned exports of sulphuric acid in May, with Russia following suit same on Monday, restricting global supply further.

The squeeze has forced phosphate producers in several regions to curtail production in fertilizer plants, as current sulphur spot prices make operations unprofitable1. If elevated prices continue there could be significantly reduced availability for the key crop nutrient in 2027. 

Canada is a top global sulphur supplier, primarily from oil and gas rich Alberta. Canada exported more than four million tonnes2 in 2025 to over a dozen countries, worth $1.4 billion, up 261% from the previous year3.  

Canada also boasts among the largest sulphur inventories in the world, sitting at around 11 million tonnes. The commodity can be stored cheaply in massive, solid blocks, but moving it requires re-melting and converting to pellets, and transporting long distances with specialized equipment and terminal infrastructure. Exporting costs could add up to more than $150 per tonne, according to Argus4. Capitalizing on the soaring sulphur prices by drawing down on the inventory has therefore been limited, with Alberta’s inventory blocks only changing from 11.4 MT in January to 11.1 MT by the end of July.5 

However, higher prices improve the economics of recovering and removing sulphur that couldn’t be justified before, encouraging more investment. 

— Wilson Fink, Agriculture Policy Lead

Trump and Sheinbaum spoke amid trade talks  

  • U.S. President Donald Trump and Mexican President Claudia Sheinbaum discussed a trade deal that remains in the works. A fourth round of formal discussions related to the U.S.-Mexico-Canada Agreement review will take place at the end of the month.   

Canada’s international trade minister went to Asia  

  • Minister Maninder Sidhu travelled to India and the Philippines, where he was set to meet officials and advance trade deal negotiations.  

EU took aim at its trade deficit with China   

  • European Commission President Ursula von der Leyen said the EU “will use all the tools” to rebalance its relationship with China. Europe had a goods trade deficit of €1 billion a day last year.  

U.K. wants in on Brussels’ “Made in Europe” policy  

  • U.K. Chancellor John Healey urged EU finance ministers to design the bloc’s “Made in Europe” industrial policy to include Britain. The two sides have previously clashed over the policies, intended to shield the bloc’s manufacturers from Chinese competition.  

Language Flag Filename

rbc_language_toggle_menu_flag

Canada’s nation-building strategy runs through First Nations territory.

As the country embarks on a new development wave, spanning hydroelectricity grids, copper mines, and liquefied natural gas projects, Indigenous groups are front and centre in several roles: as communities, investors, and the labour force. They are also likely to be most deeply impacted by the developments.

As it seeks reconciliation, Canada has a generational opportunity to leverage Indigenous expertise, include them in the fruits of new capital injection, and make some headway in redressing long-standing issues of exclusion.

There is no nation building without First Nations, Inuit, and Métis communities being involved.

Our Nations Building report, published earlier this year, examined why the capital architecture set up to facilitate Indigenous participation in Canada’s development does not match the impending project wave. This briefing measures the mismatch.

Key Pillar: Building Canada with Indigenous participation

Prize of development$ billion
Construction cost of Major Projects Inventory developments690
Operating + sustaining costs of projects (20-year timeframe)1,053
Price of development
Equity required in MPI projects314
Indigenous equity required51
Indigenous Loan Guarantees17
Indigenous loan guarantees already deployed3

Sources: RBC Thought Leadership, Natural Resources Canada’s Major Projects Inventory, Indigenous Energy Monitor

  • New infrastructure is vital for Canada to meet its new trade goals. Ottawa’s target of $300 billion in additional non-U.S. trade over the next decade1 depends largely on expanding its energy base, scaling its minerals riches, and developing the infrastructure that moves them to overseas markets.

  • Indigenous territorial borders intersect nearly every major economic development plan in Canada. More than 70% of the Major Projects Inventory sits within 20 kilometres of an Indigenous community.2

  • Starting projects with the right stakeholders would speed up development. Similarly, more than 70% of the $126 billion fast-tracked by the Major Projects Office—launched by the Mark Carney government to fast-track nation-building projects—runs through Indigenous territories. Creating pathways for Indigenous participation could be decisive in ensuring Canada can restore its reputation as a builder of large-scale projects.

  • The financing opportunity is immense. The inventory lists 475 active projects worth ~$690 billion, requiring an estimated $314 billion in equity financing3. That would require foreign and domestic capital, interlaced with blended finance, loan guarantees and other support to bridge the gap.

  • There are more opportunities beyond the new build. The new proposed projects are only a portion of a broader opportunity. Another major untapped area are operating assets—pipelines, transmission, terminals—where the largest Indigenous equity transactions to date have occurred.

  • Nation building projects would lift the economy. Together the projects could generate $1.45 trillion in GDP, $665 billion in labour income, 310,000 jobs annually, and $170 billion in government revenue.4 This accrues to the country rather than to any community specifically.

  • Trade pressures highlight the need for speed—and financing challenges. U.S. tariffs imposed in 2025 exempted energy, potash and critical minerals—exports with the fewest substitutes, and the sectors most represented in this pipeline. Trade uncertainty raises the weight of domestic capital financing it.

  • Hydro One offers First Nations up to 50% equity in every new large transmission project. The standing policy was adopted after the Wataynikaneyap Power project, in which 24 First Nations hold 51% of a $1.9 billion system connecting 17 remote communities, demonstrated majority Indigenous ownership at scale.

  • The Haisla Nation has a 50.1% stake in the $6-billion Cedar LNG project on the West Coast. It’s a majority Indigenous ownership, financed without a loan guarantee.

  • Suncor directed 20% of its total supply-chain spend to Indigenous businesses in 2022, up from 8% in 2019—a 2.5x increase in three years.

  • Trans Mountain delivered 25% of contract value to Indigenous businesses and roughly 11% Indigenous workforce participation during construction.

  • BC Hydro and SaskPower have set minimum First Nations equity ownership requirements in power procurement, 25% and 10%, respectively, as conditions of bidding, at no fiscal cost.

Full Indigenous equity participation would require around $51 billion. That’s a 16% weighted share of the $314 billion equity requirement, and would return roughly $75 billion, net of the capital invested, over a 20-year horizon, according to our research.

While $51 billion is not a requirement for projects to proceed, it creates room for Indigenous groups to become stakeholders and play a meaningful role in the development of Canadian resources and the wider economy.

The existing architecture is not set up to match the requirements. Federal and provincial Indigenous loan guarantee programs hold more than $17 billion in combined authority. As much as $2.5 billion had been deployed across 27 transactions5 from 2009 to June 2026. The requirement is roughly three times the federal and provincial authorities that exist to support it.

Ownership does not require entry at the outset. Stakes can be acquired at financial close or in assets already operating, which is how the largest Indigenous transactions to date have been structured: an Indigenous partnership acquiring an interest in an operating pipeline system, a post-completion equity option, a federal asset signalled for divestment. Roughly one-eighth of the requirement modelled here sits in projects essentially already built and generating cash flow.

The opportunity for Indigenous groups extends beyond new projects. Corporate resource projects—oil and gas, mining, LNG—hold roughly 60% of the pipeline’s capital and carry the highest expected returns. Contracted and regulated assets, including transmission and community-scale power, return less but are more predictable. Assumed participation in this analysis varies accordingly, with capital intensity and technological maturity: highest in smaller, contracted, mature assets, lowest in the largest resource projects. A portion of the requirement also sits in Crown-owned assets, where participation would require a policy decision to open equity to outside partners—a decision with precedent, in Ontario’s transmission and Darlington nuclear projects.

Value from these projects can reach communities through four channels that can be blended or priced independently.

  • Channel 1—Ownership. Equity of $51 billion returns approximately $75 billion, net of capital, over 20 years. Even this is conservative, as transmission assets operate for roughly 70 years, hydro assets even longer, and nuclear refurbishments extend station life toward 80. The model counts no more than 20 years of distributions from any project regardless of its actual life. The economics of these assets extend well beyond the window in which this report accounts for them.

  • Channel 2—Agreements. Impact benefit agreements are negotiated payments from proponents to Indigenous governments, typically struck on a project’s revenue or production rather than its capital cost. According to the Indigenous Energy Monitor, Disclosed payments reached $847 million in 2025 and $4.2 billion cumulatively since 2017, across 231 reporting companies and 287 Indigenous government recipients. Because only mandatory disclosure is captured, these are floors. Notably, they concentrate in projects where equity participation is least common, with mining at highest risk. This study does not model agreement payments across the inventory: the dataset is built on capital cost, and no defensible bridge exists to revenue-based payment structures.

  • Channel 3—Work. Indigenous workers earn wages and Indigenous businesses win contracts on these projects irrespective of ownership. Applying capture rates grounded in disclosed outcomes—4% to 12% of labour income, and 10% to 30% of the Tier-1 domestic contract pool—yields an estimated $27 billion to $80 billion in wages and $59 billion to $177 billion in procurement over the 20-year window. The base of each range assumes nothing more than demographic parity in hiring and a procurement share below levels several major operators already report. This channel requires no capital commitment from any Nation.

  • Channel 4—The build. The aggregate is $1.45 trillion in GDP, $665 billion in labour income, 310,000 jobs annually, and $170 billion in government revenue6. This accrues to the country rather than to any community specifically, and is the reason participation question matters beyond the parties directly involved. Ownership distributions and wage flows are components of this total, not additions to it.

  • Two concerns shape real decisions and deserve direct treatment. First, taking equity might displace an existing agreement. It does not: the channels draw on different pools and pay different recipients. The national payment data confirms the separation, as disclosed agreement tracking explicitly excludes contractor and supplier payments. Second, own-source revenue from an equity stake can, over time, reduce federal transfers that fund basic services. That concern is real.

  • Look beyond equity for Indigenous participation. A project that does not suit equity by a Nation need not exclude them. Much of the mining pipeline carries commodity and construction risk that a community dependent on stable distributions may rationally decline, a judgement any institutional investor would exercise. But there are other ways Nations can participate, such as the $85 billion of estimated value through wages and procurement alone that these projects generate nationwide. That would require no capital at all from Indigenous groups, but help lift the community’s economic prospects.

  • As the world’s second-largest country by area, Canada requires infrastructure at continental scale to move energy and minerals to market. Most resource endowments, and therefore most major projects, sit outside urban Canada, on or near the traditional territories of more than 630 First Nations as well as Inuit and Métis communities.

  • Section 35 of the Constitution Act, 1982 recognizes and affirms the rights of Indigenous peoples. It is constitutional law, not policy. From it flows the Crown’s duty to consult and, where impacts are serious, to accommodate, before projects proceed. Canada has also legislated alignment with the UN Declaration on the Rights of Indigenous Peoples, whose standard of free, prior and informed consent shapes project processes. Equity participation is a financial structure; it is not a substitute for consent.

  • The legal landscape varies by region. Most of British Columbia is not covered by historic treaties, which makes title and consultation dynamics materially different from Alberta and the Prairies.

  • Federal and provincial loan guarantee programs spanning $17 billion have existed to backstop Indigenous borrowing for equity stakes in these projects. Indigenous ownership is well established with majority stakes in operating LNG, transmission and midstream assets. The federal government has also signalled selling assets to Indigenous buyers.

Download the Report

All data sourced from Indigenous Energy Monitor (IEM) unless otherwise mentioned. Indigenous Energy Monitor data is sourced from IEM’s Indigenous Energy Ownership Tracker (IEOT) module and Indigenous Resource Payment Tracker.

Language Flag Filename

rbc_language_toggle_menu_flag

The world is changing, and so is Canada.

The 2020s have already presented several waves of disruption, from geopolitical shocks and wars to extraordinary advances and discoveries in space technology, life sciences and artificial intelligence. In the midst of these waves of change, we’re seeing a shift in trade and investment flows. Canada is at the nexus of those changes.

The world’s largest investors are in Toronto this September to explore and discover that changing Canadian prospectus. Beyond the deals, you will find a country with abundant resources, a resilient rule of law, and one of the world’s most educated and globally-minded populations. This is the opportunity and the moment. This is Canada now.

Manufacturing is Canada’s largest goods-producing industry, and the country’s deepest link to the U.S. economy. Factories mostly located in Ontario and Quebec generated around $850 billion in sales last year, employing 1-in-12 Canadians, with about half of the output exported around the world.

Canada’s Windsor-to-Montreal corridor is home to auto assembly plants, aerospace firms, Tier-1 parts suppliers, machinery and equipment makers, robotics firms and tech companies. The corridor also features skilled labour and globally competitive universities, producing the skilled trades, R&D, and IP needed to support the sector.

$850B

Manufacturing sales in 2025

#1

Foreign supplier of steel and aluminum to the U.S.

5th

Largest exporter of
aerospace products

9th

Largest auto exporter

Four advanced industries anchor the sector, drawing on a base of primary and fabricated metals, chemicals and plastics that together account for nearly $60 billion in annual GDP.

A competitive auto hub

Canada is home to five OEMs—Toyota, Honda, and the Detroit Big Three—and 700 suppliers that ship more than $100 billion in vehicles and parts each year.

While vehicle assembly volumes have fallen since 2010, parts output has grown 10% in the same period, with value migrating to powertrains, electronics, battery systems and software, where Canadian firms like Magna, Linamar and BlackBerry QNX compete.

Canada’s levelized cost for EV assembly is at parity with the U.S., with cleaner and cheaper power in Ontario and Quebec.

A high-flying sector

Canada’s aerospace industry contributed $33 billion to GDP and employs nearly 220,000 people.

Defence aerospace revenue reached $6 billion in 2024, close to 15% of industry revenue, with the $40 billion NORAD modernization creating sustained demand. Demand is expected to increase domestically and globally, partly driven by higher expenditures from NATO countries.

Canada ranks in the top five globally in civil flight simulators, engines and aircraft.

A robust heavy-industry pipeline

Machinery is a $20 billion industry well positioned to supply LNG terminals, mines, grid expansion with $290 billion in defence-related capital projects in Canada’s pipeline.

Manufacturers’ unfilled orders rose 7% to $115 billion at the end of 2025, driven by shipbuilding and aerospace.

A range of value-add industries

Canada is the world’s fourth-largest aluminum producer, with capacity of roughly 3.3 million tonnes.

Chemical manufacturing adds $22 billion to GDP, while pharmaceuticals contributed $8 billion.

Canada is the birthplace of deep learning. The chief scientific advisors of all three national AI institutes: Amii (Edmonton), Mila (Montréal) and the Vector Institute (Toronto) are Turing Award laureates. Canada was the first nation in the world to adopt a national AI strategy, in 2017. And its one of very few countries outside the U.S. and China with a frontier model company. Cohere, founded in Toronto in 2019, builds language models for enterprise and government, and is differentiated by its ability to handle sensitive data in secure and onpremise environments. Talent density is another durable advantage. Toronto ranks third globally for tech talent, behind only the San Francisco Bay Area and Seattle.

3,500

AI firms

10%

Share of top AI researchers

$14.5B

Total VC funding across
2,468 deals (2014-2025)

3

Of the world’s top 10 AI
talents pools (Toronto,
Montréal and Vancouver)

Canada’s AI economy spans five layers: foundation models, the language systems underpinning most applications; physical AI, robotics and autonomous systems that act in the world; applied AI embedded in health, agriculture, finance and resources; compute and data centres; and research and safety institutions. Strength is concentrated at the top and bottom of that stack. The middle is where capital is most needed, and where returns are least crowded.

Compute infrastructure: the closest near-term opportunity

Canada has roughly 337 megawatts of AI data-centre capacity today and requires an estimated 5.5 gigawatts by 2030 to serve domestic commercial players.

Ottawa is targeting 850 megawatts of sovereign capacity by 2030, scaling toward 2.3 gigawatts, supported by more than $2 billion in federal commitments and expected to draw tens of billions of dollars in private capital.

The export opportunity, serving allied markets from Canadian soil, is estimated at a further 1.7 to 6.7 gigawatts.

Sovereign AI as an export product

Canada’s frontier model capability, clean power and democratic rule of law makes it a credible supplier to nations seeking alternatives to American or Chinese platforms.

Closing the scale-up gap

Nearly 70% of Canadian-founded startups end up headquartered abroad, a long-standing leakage Ottawa is now addressing through a $500 million Canadian Tech Growth Fund, direct equity stakes in national champions, and a newly established sovereign wealth fund.

For foreign capital, this is the arbitrage: world-class research and companies priced below U.S. comparables, with government as a co-investor.

The adoption gap in a high-value economy

Only about 12% of Canadian businesses have integrated AI, against a national target of 60% by 2034.

The five priority sectors–health and life sciences, energy and critical minerals, transportation, agriculture, and manufacturing and robotics are areas where Canada holds globally significant physical assets and proprietary data.

Canada co-invented quantum cryptography. BB84 protocol, the first practical method for securing communication through the laws of physics rather than mathematical difficulty, was co-developed in 1984 by Gilles Brassard at the Université de Montréal with IBM’s Charles Bennett. The two received the 2025 ACM Turing Award in March 2026. Canada also launched the world’s first commercial quantum-computing computer, and Toronto-based 1Qbit was recognized by the World Economic Forum in 2015 as the first company dedicated to commercial applications for quantum computers.

Canada’s quantum sector has attracted more than $2.8 billion in combined public and private funding. Between 2018 and 2022, sector revenue rose 93%, the number of companies expanded 41%, and employment grew 111%. The industry is on track to add $7.7 billion to the economy and unlock more than 157,000 jobs by 2045.

4

Quantum companies in
Canada valued above
US$1 billion, a
concentration no
country outside the
United States has
matched

300

Quantum researchers in
Waterloo, Ont., home to
20 quantum companies
and institutions

3

Number of Canadian
companies—Xanadu,
Photonic and Nord
Quantique—of the 11 that
advanced to Stage B of
DARPA’s flagship Quantum
Benchmarking Initiative
that validates commercial
claims

$695M

Total federal
commitment under the
Defence Industrial
Strategy and the 2023
National Quantum
Strategy

McKinsey’s 2026 Quantum Technology Monitor projects the global market for quantum technology will be US$60–100 billion by 2035, with computing accounting for US$43–71 billion, and estimates up to US$2.7 trillion in broader economic value by 2035.

Quantum-safe cryptography, the nearest-term revenue opportunity

The Canadian Centre for Cyber Security’s roadmap required federal departments to produce migration plans by April 2026, with high-priority systems transitioned by 2031 and all remaining systems by 2035. The Global Risk Institute’s 2026 Quantum Threat Timeline, produced with Waterloobased evolutionQ, assesses a cryptographically relevant quantum computer as “quite possible within 10 years and “likely” within 15. Because adversaries can capture encrypted data now for later decryption, migration demand exists independent of when the hardware arrives.

Quantum sensing applied to the resource base

Sensing has direct application to mineral exploration, subsurface imaging, and navigation in GPS-denied environments including the Arctic, areas where Canada has both commercial need and sovereign interest. The global quantum sensor market is projected at approximately US$550 million in 2026.

Co-investment at reduced risk

Canadian quantum firms now carry matched federal, provincial and U.S. defence funding. Nord Quantique reached unicorn valuation on less than US$60 million raised, indicating capital efficiency uncommon in the sector.

Home of the oilsands, Canada boasts the world’s third largest crude oil reserves, mostly in Alberta. Canada is the U.S.’s largest source of imported crude, with both countries benefitting from a continental and integrated energy market. Canada’s ambition to expand its market access to Asia helps oil-importing countries diversify their sources of oil supply. Its offshore East Coast reserves of three-billion barrels has also attracted attention from global oil majors.

The world’s fifth largest producer of natural gas also has ambitions to leverage its abundant conventional and shale reserves, with several multibillion- dollar gas export projects planned and underway on the West Coast.

10.3%

Canada’s share of the
world’s proven oil reserves

72,000

Oil and gas sector jobs
needed by 2035

4th

Canada’s rank among the
world’s top oil producers

$151B

value of new projects in
planning stages

Canada set a new production record of 5.35 million barrels of oil per day (bpd) in 2025, with the key oil producing regions of Alberta, Saskatchewan, British Columbia and Newfoundland and Labrador, registering growth. Canada exported crude oil, refined petroleum products, natural gas products valued at $157.5 billion in 2025 to the U.S.—a fifth of its total goods exported globally. More than 90% of Canadian oil and gas is shipped to the U.S.

New pipeline projects

The start of the 890,000-bpd Transmountain Expansion Project in 2024 helped Canada expand its exports to Asiaand find new markets beyond the U.S.

A new comprehensive partnership between Alberta and the federal government could spur a new wave of development. It includes a one million bpd Alberta-to-British Columbia pipeline proposal that would encourage more production.

There are proposals to revive the Keystone XL oil pipeline connecting Alberta to the Gulf Coast, expanding the 450,000 kilometres of oil and gas conduits connecting the two nations.

Building on its carbon capture lead

To mitigate emissions, five major oilsands companies are collaborating with the federal government and Alberta to develop the $16.5 billion Pathways Carbon Capture project with six million tonnes per year of captured CO2 capacity by the mid-2030s.

A burgeoning LNG Industry

Seven liquefied natural gas (LNG) export projects and one infrastructure project are at development stages. Together, they represent a capital investment of ~$109 billion and potential production capacity of 50.3 million tonnes per annum of LNG.

Growth beyond Alberta

The Montney formation located in the Prairies can potentially produce around 450 trillion cubic feet of natural gas—making it one of North America’s largest gas resources.

Five offshore fields off Newfoundland and Labrador have boosted production and now account for 4.5% of Canadian production. Exxon Mobil and Equinor are among global investors operating in the province.

Canada’s abundant water resources and technological innovation have transformed it into a hydro and nuclear powerhouse. Hydro accounts for 60% of Canada’s power generation, playing a key role in Quebec, British Columbia, Ontario, Labrador and Manitoba grids. Canada is also a nuclear technology pioneer with the home-grown CANDU reactors operational in six countries, while the G7’s first small modular reactor
is under construction.

Solar, wind power, and battery storage are also emerging as vital pieces of a vast network of grids and connections that power 10 provinces and three territories. Several provinces also provide power to U.S. states such as New York, Vermont, Maine, Massachusetts, and Michigan.

4th

Canada’s global rank as
hydropower producer

14%

Nuclear’s share of power
generation

28,000

Clean electricity jobs
openings expected by
2028

56%

Growth in wind, solar
and storage installation
(2020-2025)

Despite a relatively small population of around 41 million, Canada is the world’s 7th largest producer of electricity. Clean power is attracting new industries—from electric vehicles to data centres—keen to reduce their carbon footprints.

A $1-trillion blueprint

A new National Electricity Strategy aims to double the national grid by 2050, to ensure clean, reliable, and affordable electricity will continue to power the country for decades to come.

The plan would require multi-billion-dollar investments in generation, transmission, distribution, storage, grid modernization, and connecting Canada’s fragmented East-West-North grids through expanded transmissions lines.

North America’s largest clean energy investment proposal

Quebec and Newfoundland and Labrador are leveraging Canada’s formidable hydro resources to develop a series of landmark projects valued at $70 billion the largest of its kind in the continent.

The projects would include upgrades to Churchill Falls, construction of a new 2,700MW hydroelectricity facility, new transmissions lines, and onshore wind projects that will boost the region’s critical minerals and infrastructure corridor.

Ontario’s all-of-the-above strategy

The country’s largest provincial economy will see power demand rise 65%. It intends to meet this demand with hydroelectric and nuclear facilities, and natural gas, but also wind and solar, with an estimated investment of $450 billion. Nuclear is a key pillar, with plans for large scale nuclear facilities and proposals for two new sites in the province. It’s also building the G7’s first grid-connected small modular reactor (SMR) at the new Darlington nuclear site.

Regional expansion

BC Hydro is investing $36 billion over the next decade to upgrade grid capacity, plus new electrification expansion and greenhouse gas reduction efforts.

Quebec’s Action Plan 2035 will oversee the development of 11,000 MW of clean energy through investments totalling $200 billion.

With production of 60 minerals and metals from more than 200 operating mines, Canada is seen as a viable commodity source for countries looking to diversify their critical mineral supplies. Canada is already the world’s largest producer of potash, the second-largest producer of uranium, and the second-largest exporter of aluminum. Meanwhile, deposits of lithium, graphite, nickel, copper, cobalt, and rare earth elements across the country offer fresh opportunities.

Federal policy is now focused on providing direct capital and faster permitting to accelerate critical mineral development. Canada combines a diversified resource base with growing policy support, allied demand and major processing opportunities.

$162B

Mineral and metal exports

140

Number of mining projects
planned between 2024-2034

171

Number of advanced
projects

$72.4B

Value of critical mineral
projects planned in
Canada through 2034

A high-grade resource

Saskatchewan’s Athabasca Basin is home to the world’s highest-grade uranium deposits. Uranium exports topped $2.9 billion in 2025.

A formidable food security resource

Potash is a vital component in fertilizers. Canada is the world’s largest potash producer and exporter and has the world’s largest potash reserves.

A copper powerhouse

Canada’s copper exports reached $11.9 billion in 2025, while nickel hit $4.3 billion and zinc $1.9 billion. The pending Teck–Anglo American merger will put the headquarters of a top-five global copper producer in Vancouver, with commitments to spend at least $4.5 billion in Canada within five years.

Midstream processing opportunities

Canada’s strength is upstream—most of the $49.4 billion in critical mineral exports are primary, smelted or refined products. There is a gap in process and specialty materials. Federal capital and allied offtakes are focusing on processing, as it offers a strong investment case.

The northern Ring of Fire

The Ring of Fire, about 500-kilometres northeast of Thunder Bay, Ont., is home to many critical minerals. While no mine operates there yet, Ontario is advancing several road projects to the region, which has the potential to create 70,000 jobs and generate more than $22 billion over 30 years.

Rare earths and magnets resource

The Saskatchewan Research Council’s Saskatoon facility was the first in North America to produce rare earth metals at commercial scale. Substantial completion of the facility is scheduled for September, and it will be fully operational in 2027.

As the world’s second largest country by size, Canada’s infrastructure is in a constant state of construction, expansion and revitalization. It began with the 4,600-kilometre Canadian Pacific Railway in 1871, which bound the country together. The country’s railways network is now the world’s fifth largest, supplemented by a one-million-kilometer road network, the 8th largest globally.

And there’s more construction ahead. Canada’s infrastructure deficit—also spanning airports and seaports—is estimated at up to $270 billion, with Transport Canada projecting $4.4 trillion in trade-enabling investment by 2070. That gap is beginning to be addressed with both funding and policy.

7th

Canada’s rank in the
World Bank’s Logistics
Performance Index, ahead
of the U.S.

224

Number of airports across
the country

$300B

Value of goods shipped
through Canada’s 17
seaports annually

$4.6B

Federal investment
pledge to expand the
National Trade Corridors
by 2028

The federal budget for 2025 committed $6 billion to a Trade Infrastructure Strategy covering ports, railways, airports, highways, and northern corridors, while a Major Projects Office was created to streamline permitting timelines and target $500 billion in private investment in the next five years.

A continental rail network

Two major railways, Canadian National (CN) and Canadian Pacific Kansas City (CPKC) represent more than 75% of the total tonnage moved by rail.

With 70% of Canadian exports destined for the U.S., much of the rail and road infrastructure is built around that market. But Canada’s national target to double non-U.S. exports within a decade and generate $300 billion in new trade requires moving far more volume east and west rather than south. Rail, ports, and roads will need major investment to accommodate these new volumes.

Seaport expansion to help cast a wider trade net

Seventeen Canada Port Authorities operate in marine shipping, led by Vancouver, moving $300 billion in goods a year, alongside Prince Rupert, Montreal, Halifax, and Saint John. Nation-building seaport projects, such as Montreal’s Contrecoeur Container Terminal Project, and the Roberts Bank Terminal 2 project in the Port of Vancouver, are set to accelerate development of the country’s diversified trade routes.

Proximity to Asia

B.C. coast LNG projects are 10 shipping days from Asia versus 20 days from the U.S. Gulf Coast; Eastern Canada is 6 to 8 shipping days from Europe—the shortest distance of any North American LNG project.

Bringing Arctic and Northern Corridors riches to market

The $1-billion Arctic Infrastructure Fund is poised to kickstart investment into logistics, but private capital will be required for scaling development of the north.

The airport privatization opportunity

Canada’s major airports are run by not-for-profit authorities that are closed to private equity since the model was created in the 1990s. More than $28 billion in upgrades are needed over the next decade to revitalize major airports. The federal government has committed to introducing legislation in 2026 to review ownership and lease reform, potentially creating significant opportunities for private investors.

Surrounded by three oceans, and a vast Arctic territory, Canada is exposed to a rise in military activity. As allied defence spending surges, Canada is stepping up military innovation and laying the ground for a globally competitive defence industry.

Canada shares responsibility for continental defence with the U.S. through the North American Aerospace Defence Command, and is part of the Five Eyes intelligence network, and a founding member of NATO. In the past 18 months, Canada has secured more than 20 international defence and security partnerships and agreements, and has become the only non- European state with preferential access to the European Union’s €150-billion SAFE defence procurement program.

5%

Canada’s pledge to raise
defence spending as a
share of GDP (from less
than 2%)

2nd

Rank among exporters of
armoured vehicles

$290B

Value of defence-related
capital investment
opportunities

600

Defence firms, employing
an 81,000-strong
workforce

The surge in Canada’s defence spending includes a $180 billion defence procurement pipeline and a projected $290 billion in defence-related capital investment opportunities.

A new Defence Industrial Strategy

The new strategy aims to accelerate domestic revenue by 240%, while raising domestic procurement share to 70% and boosting defence exports by 50%.

A new dedicated Defence Investment Agency aims to streamline major procurements targeting 10 key sovereign capabilities, including aerospace, ammunition, and specialized manufacturing.

The multilateral Defence, Security and Resilience Bank will be headquartered in Canada, while the Business Development Bank of Canada and Export Development Canada have established dedicated defence platforms.

Command, Control, Communications, Computers, Intelligence, Surveillance and Reconnaissance (C4ISR)

Canada’s $38.6 billion, 20-year NORAD modernization creates sustained demand across sensors, secure communications and space-based surveillance. Unmanned Autonomous Systems (UAS) will play a key role in these networks and represent a growing sector of Canada’s defence industry.

A training and simulation hub

Canada ranks in the top five globally for in-flight simulation, with an export-oriented base for training and mission rehearsal.

Training and simulation are designated sovereign capabilities, while new defence programs are expanding access to operational environments, ranges and test infrastructure for Canadian technology developers.

Raising dual-use industrial capacity

A $5-billion industrial fund was launched to support retooling (including to the defence sector) in steel, aluminum and other tariff-exposed industries. And in April 2026, Canadian manufacturers established the country’s first integrated ballistic-steel production venture.

Defence infrastructure spending includes a $3.7-billion pipeline to build military housing, using modular construction and Canadian steel, lumber and building systems. $40 million has also been allocated to assess microreactors for remote and Northern operations.

Canada has a proud history as a spacefaring nation dating back to 1962, when it became only the third nation to successfully orbit a satellite with Alouette 1. A decade later, Canada became the first country to launch a domestic communications satellite into orbit. And in 1981 when the Canadarm technology made its debut on NASA’s second Space Shuttle mission, it revolutionized space exploration and satellite maintenance.

More recently in 2020, Canada joined the NASA-led multinational Artemis mission to return humans to the moon and prepare for crewed missions to Mars. Earlier this year, Canadian astronaut Jeremy Hansen flew on the Artemis II mission looping behind the far side of the moon, making him the first non-American to ever travel beyond low Earth orbit.

200

Organizations

$5B

Annual revenue
(43% from exports)

170%

Increase since 2019
in upstream revenue
from space-systems
manufacturing, navigation
and Earth observation

413

Number of space-related
patents in 2024, a 21%
increase year-on-year

Launching a commercial space system

Canada is already globally recognized for its expertise in sensing technologies. The country is building one of the largest commercial space systems around a sovereign low Earth orbit broadband constellation and expanding satellite manufacturing.

Space data, sensing & in-orbit infrastructure

Canada has long-established Earth observation capability and new systems are moving data and computing into orbit.

A higher orbit

Canada is targeting initial sovereign orbital launch capability by 2028 from its Atlantic coast with geography that places satellites into polar paths that can scan the entire globe.

A stellar communications opportunity

Roughly $12 billion in new capital for Canadian space ventures over the next decade, could in turn generate more than $20 billion in annual industry revenue building on these capabilities and unlocking new opportunities.

Now, Canada is investing in programs focused on nextgeneration technology in robotic space exploration, sovereign orbital infrastructure and
satellite communications. Last month, the government awarded an initial $2.3 billion contract to expand Arctic low Earth orbit satellite systems entirely to Canadian firms.

A North American opportunity

NASA’s US$24-billion budget for 2026 includes more than US$7 billion for lunar exploration and US$1 billion in new investments for Mars-focused programs. Private developers also have multi-billion-dollar plans spanning satellite communications, spacecraft development and space travel. Several of these plans span the continent.

A burgeoning export industry

While 68% of Canada’s space-related exports are destined for the U.S., Europe has emerged as Canada’s second-largest market. Last year, Canada invested more than $660 million in European Space Agency programs to advance research and development of Canadian-made space technologies for both civilian and defence purposes.

Canada’s abundant and fertile lands have transformed it into one of the world’s biggest food exporters. The sector employs more than two million people, making up 7% of the country’s GDP. Agricultural innovation has long been a Canadian strength—it is where canola, named after the nation, was invented in the 1970s. Canada is now the world’s largest canola exporter.

Today, Canadian agriculture continues to undergo a technological transformation, with AI, drones, robotics, genetics, biologicals and precision tools playing increasing roles in production, and creating significant opportunities for Canada.

1 in 9

Jobs that are supported by
Canadian agriculture

$100B

The value of Canada’s
agri-food exports

#1

World’s top producer of
canola and pulses

6.2%

Canada’s land area
covered by farms

Value-add and processing

Food and beverage processing is the second largest manufacturing sector in Canada, with sales reaching $173.4 billion in 2024.

Canada is now home to 15 canola crushing and refining plants that process 14 million tonnes of canola each year, helping meet growing demand for biofuels and cooking oil. Similar opportunities exist across other commodities.

The era of agri-tech

Agricultural technology is transforming farming, through the use of AI, drones, robotics, as well as the use of genetics and biologicals. The precision farming market—using technology to make the process more efficient—is growing and expected to reach $4.9 billion by 2030.

Public research capacity in seed genetics and crop protection is well established in Canada and closely tied to industry, with companies eager for capital to scale their solutions.

Infrastructure expansion plans

Agricultural value chain opportunities are rife, such as the Westside Irrigation Rehabilitation Project in Saskatchewan that is expected to open 90,000 acres of irrigated land, contributing $12.9 billion to GDP.

Most of Canada’s agri-food is produced in regions that depend on railway systems and inland terminals. Infrastructure will have to keep up with rising global demand, requiring investments in capacity, terminal throughput and storage.

Export opportunities

Global demand for food continues to rise, while arable land and freshwater is scarcer—and Canada holds both in a surplus. Canada is the ninth largest exporter of agri-food, fish and seafood products, exporting to more than 200 countries as of 2024. While the U.S. is the destination for most agri-food exports, Canada has been diversifying to other markets.

Canada’s life science sector is a growing economic and innovation centre, featuring a world-class research network and top pharmaceutical, biotechnology and medical technology firms. Canadian researchers have made foundational contributions to public health—including the discovery of insulin, stem cells and the GLP-1 hormone—and have contributed to major advances in vaccine development and disease treatment.

With billions of dollars invested in research and development, the sector combines scientific expertise with commercial potential. Innovative research, major multinational presence and government investments aimed at growing the sector position Canada to become a more prominent player in the years to come.

+15K

Number of clinical trial
researchers

$51B

Pharmaceutical sales

23.6%

10-year internal rate of
return

$250-
300B

Economic value that
Canadian innovations are
projected to generate by
2035

A pharmaceuticals and biotechnology hub

The worldwide pharmaceutical market exceeded US$1.7 trillion in 2025 and continues to grow. Last year, roughly 95% of innovator drugs in major pharmaceutical pipelines traced back to smaller biotech firms. As pharmaceutical firms diversify their innovation activities, Canadian companies and research organizations are taking on an increasingly important role in R&D.

Canada’s pharmaceutical sector is the 9th largest in the world and has been growing rapidly at 9% per annum since 2020.

Since 2021, more than $15 billion in Canadian biotech value has been acquired by global pharmaceutical players— including Trillium (acquired by Pfizer, 2021), Inversago (Novo Nordisk, 2023), Chinook (Novartis, 2023), Bellus Health (GSK, 2023), Fusion (AstraZeneca 2024).

Some of the world’s largest global firms—such as AstraZeneca, Merck, Novartis, Pfizer and Sanofi—have made significant investments in operations, as well as research and development in Canada.

Clinical trials and R&D

Canada ranks No. 1 in active clinical trial productivity (number of trials per capita) among G7 nations. It’s No. 4 in the world in terms of clinical trial sites. In 2025, there were approximately 3,100 clinical trials taking place countrywide.

Canada offers world-class research infrastructure, with an extensive network of academic institutions conducting clinical research, including 17 medical schools, 40 academic healthcare organizations and more than 15,000 researchers.

Expertise in oncology, immunotherapy and specialty medicines positions Canadian companies to attract international partnerships and investments in these highvalue therapeutic areas.

Health Canada’s Agile Licensing pathway allows for promising therapies to be accelerated, with some treatments getting authorization in as little as 200 days, comparable to the Food and Drug Administration (FDA), but with early access to the Canadian market.

Foreign investors can tap various government organizations and programs to mitigate risk and help enhance return on investment.

First-loss / concessional risk absorption

Public capital can be structured to absorb a disproportionate share of downside risk

The Canada Growth Fund (CGF) was incorporated in 2022 with $15 billion to invest in strategic sectors, using public capital to absorb policy, execution, and market risks.

  • The Fund’s investments will look to accelerate the deployment of key technologies, support emissions reduction, scale up companies, encourage the domestic retention of intellectual property, capitalize on Canada’s natural resources, and strengthen supply chains.

In some cases, the CGF will “invest concessionally by accepting, where necessary, below-market returns relative to the risk it incurs,” using the lowest discount or risk absorption necessary to allow a project to move forward.

  • Private investors will not get disproportionate returns compared to the risk they carry and must share in the downside even if the Fund absorbs first-loss.

Common equity

Public institutions can anchor or enlarge the equity pool

In April this year, the federal government announced Canada’s first national sovereign wealth fund: the Canada Strong Fund (CSF), seeded with $25 billion over three years.

  • The CSF is intended principally as a commercial equity co-investor in nation-building projects, alongside private capital.

  • It will be designed to allow retail Canadian investors to participate, and the government has committed to delivering “commercial market-rate financial returns” for Canadians.

The Canada Infrastructure Bank (CIB) was created in 2017 to help address Canada’s infrastructure deficit, supporting revenue-generating projects “in the public interest.”

  • The CIB is focused on supporting community and housing infrastructure and clean energy development. It has committed $18.6 billion across 112 projects worth $55 billion.

  • It can take equity positions where an infrastructure financing gap prevents a project proceeding.

The Business Development Bank of Canada (BDC) is Canada’s national development bank mandated to help Canadian entrepreneurs and small and medium-sized enterprises create and develop stronger businesses, with $58.6 billion committed to clients.

  • Its subsidiary, BDC Capital, takes equity positions primarily in Canadian growth companies.

Export Development Canada (EDC) is Canada’s trade and export financing agency to help Canadian companies access and expand in foreign markets with over $52 billion in assets.

  • EDC can make equity investments where there is a relevance to Canadian trade or export activity.

Preferred / hybrid equity

Public institutions can provide capital between common equity and debt

The CGF can use preferred shares and hybrid securities with negotiated priority, return or conversion rights.

The CIB can similarly utilize preferred or hybrid equity to absorb specific project risks that deter private investors.

The CSF is expected to have flexibility within equity structures.

In some cases, EDC can take preferred or hybrid equity positions to match the lead investor’s commercial terms.

Subordinated / mezzanine debt

Junior debt from public institutions can add loss-absorbing capital beneath senior lenders

The CIB provides subordinated and mezzanine debt on concessionary terms for projects and will accept commercial risk that other investors are unwilling to bear, at a reasonable price, to crowd in private lenders.

At the corporate level, BDC Capital can provide junior debt to Canadian growth companies.

Senior debt

Public lending can extend financing capacity

Senior financing is generally supplied by commercial banks and institutional lenders.

EDC can lend directly alongside them where Canadian trade or export activity is involved, including structured and project finance.

The CIB can also provide senior project loans where financing constraints such as tenor or risk allocation prevent sufficient private lending.

Revenue / price floors

The CGF can support project investment through contracts for differences and offtake agreements.

  • These instruments may apply to industrial carbon credits and commodities and are designed to underwrite demand, insulating investors from future policy or regulatory changes.

Credit / political-risk protection

Defined credit or political risks can be transferred to a public balance sheet

EDC can provide trade and credit insurance, political-risk protection, and guarantee commercial lending; its credit insurance can typically cover up to 90% of an insured loss.

  • This can include trade credit insurance for when a foreign buyer does not pay, political risk insurance to cover currency inconvertibility and transfer restrictions, and expropriation, and commercial lending guarantees.

The CIB can also provide project loan guarantees on major infrastructure to crowd-in private lending on higher-risk projects.

Indigenous partner-level credit support

Sovereign guarantees can finance Indigenous equity ownership in projects

Indigenous land rights are constitutionally embedded in Canada, and the Crown has a duty to consult Indigenous groups which can lead to delays or halt infrastructure projects with government backing.

  • Most Indigenous reserve assets cannot be pledged as collateral, previously leaving communities largely unable to finance equity positions in projects.

  • Loan guarantees programs, designed to supply that financing while giving communities an ownership stake in a project’s performance, have proliferated across Canada to address this issue.

Through federal and provincial Indigenous Loan Guarantee Programs, an Indigenous community, or group of communities, can form an entity that borrows money to buy an equity stake in a project, with the government guaranteeing the lender.

  • If the project fails, the Indigenous partners’ equity is lost in the same order as other common shareholders, and the lender is repaid by government.

  • There are six government Indigenous Loan Guarantee programs in Canada (one federal, five provincial holding $18 billion of combined authority). Federal and provincial guarantees can be combined on a single transaction.

An Indigenous partner may also borrow directly. The CIB’s Indigenous Equity Initiative lends $5 million to $100 million for up to 90% of an equity purchase price where the CIB is already investing in the same project.

Permitting / schedule risk

A new government office will accelerate regulatory timelines for major projects

Established in August 2025 to cut regulatory and permitting bottlenecks impeding the development of critical national infrastructure, the Major Projects Office (MPO) assesses project proposals against national resilience and security, economic benefit, likelihood of successful completion, Indigenous benefit, and climate objectives.

  • Successful projects will be listed as a project of national interest, with the office mandated to cap the review timeline for these at a maximum of two-years compared to previous timelines of five years or more.

  • The process must run alongside Indigenous consultation and provincial permitting where relevant.

Download the Report

Language Flag Filename

rbc_language_toggle_menu_flag

Next week in Toronto, the Canada Investment Summit will bring together 100 global investors—managing over $1 trillion each—with Canadian leaders and CEOs. Energy, critical minerals, defence, and advanced technologies are a few of the key areas of focus.

RBC’s John Stackhouse shares what you should be thinking about on the cusp of this first-of-its-kind event.

Language Flag Filename

rbc_language_toggle_menu_flag

The world has entered a new chapter of capitalism. More savings are flowing into new sectors and frontier technologies. More governments are leveraging their balance sheets again to direct economies. And more investors are looking anew to a range of mid-sized economies and resource basins to hedge against geopolitical disruptions.

Canada is at the centre of it all, competing for the trillions of dollars of capital at play.

Ahead of the Canada Investment Summit, in Toronto in September, RBC Thought Leadership and McKinsey & Company teamed up to assess the new global map of capital and Canada’s place in it. This unprecedented project is built on the McKinsey Global Institute’s seminal report, Catalyzing competitiveness: Where investment happens and why, which reframed the competitiveness question around a simple test: where is productive capital being invested, and why? Its analysis looked beyond broad measures of competitiveness to the economics of real investment decisions across sectors.

A McKinsey & Company and RBC Thought Leadership research team layered on to that methodology a rich set of Canadian insights and data. We sought to understand how investors might assess Canada when deciding where to put their next dollar of capital. The resulting research illustrates that Canada is quite competitive with its peers, particularly when it comes to some key future-focused sectors.

The report aims to help public- and private-sector leaders better understand this new age of capital—and Canada’s opportunity in it. 

John Stackhouse, Senior-Vice President, Office of the CEO, Royal Bank of Canada

Zak Cutler, Senior Partner and Toronto Managing Partner, McKinsey & Company

  • Global capital is scarcer and increasingly channelled to a handful of innovative sectors. About three-quarters of announced foreign direct investment (FDI) since 2022 has gone to data centres, semiconductors, electric vehicles (EVs) and batteries, pharmaceuticals, and enabling industries, such as critical minerals and energy.

  • The global capital map is shifting, with middle powers such as Canada emerging as heavyweight investors. The Capital 10 (C10), the ten largest players outside the U.S. and China, produce one-fifth of global GDP but control 43% of outward FDI, far more than the U.S. and China combined despite having half the economic mass.1 The C10 also comprises Japan, Singapore, Germany, France, Australia, Spain, Brazil, Sweden, and South Korea.

  • These global shifts have resulted in many large, institutional investors looking to diversify. Greater returns, speed, certainty and market access are key ingredients to success. But the competition for global capital has never been more intense.

  • Canada could become the G7’s growth leader if it changes its playbook. Unlocking $1 trillion in incremental capital expenditure over five years could translate into $950 billion in GDP and up to 1.4 million direct jobs.

  • Canada has a powerful story to tell as an investment hub. Canada, abundant in resources, is most competitive where power costs dominate. However, it will need to raise its game on labour costs and scale economics. The country can capitalize on several opportunities, including in these five sectors:

    • Liquefied natural gas (LNG): Canada’s west coast sits at one of the cheapest cost-levelized positions for LNG producers exporting to Asia, and its east coast is strategic for European nations seeking to diversify their energy supply.

    • Mining: Canada combines an enviable endowment with deposits that are competitive to operate, a skilled workforce, a dense supplier base, and research partnerships that it can leverage to scale its established industries (potash and uranium) and minerals that are critical to meeting projected global demand shortfalls (copper, nickel, and zinc).

    • Electric vehicles: Canada could transform into a tech hub by focusing on high-value auto components (powertrains, electronics, battery systems, and software-intensive parts), increasing its potential for export diversification.

    • Pharmaceuticals: Canada ranks favourably relative to the U.S., Ireland, and Germany on manufacturing costs per unit and could leverage its highly skilled labour force built from a network of world-class universities and hospitals.

    • Data centres: Canada could become a preferred data-centre location with its cool climate, available land, relatively low-cost energy, grid stability, and skilled construction workers. Levelized costs to build a data centre in Canada stands at $190 per megawatt hour (MWh), compared with $242 for the U.S.

The geopolitical realignment currently unfolding has dramatically changed how investors assess risk and rewards, with many institutional players with large pools of capital looking to diversify. For proof, look no further than the Canada Investment Summit, attracting some of the world’s biggest investors, with a total of more than $100 trillion under management.

With so much capital in search of a new home, and nation building very much in style, competition is heating up. Many countries, looking to shore up their domestic economies, are trying to create the necessary conditions to attract large amounts of foreign direct investment (FDI) to fund critical infrastructure and technology. The big winners will be those who best combine higher returns with speed, certainty and market access.

Canada is well positioned for this new dynamic.

Our analysis indicates that with some changes to its playbook, Canada could unlock $1 trillion in incremental capital expenditure in the next five years, transforming the country into the G7’s GDP growth leader. That scale of investment implies a 10-15% increase in GDP per capita and up to 1.4 million direct jobs.

But before diving into what it will take for Canada to capitalize on this generational opportunity, it’s important to zoom out. When you do, it becomes clear that global capital is caught in three crosscurrents, each pulling in a different direction.

First, global FDI is becoming scarcer and concentrating in future-shaping industries (Exhibit 1). Data centres, semiconductors, electric vehicles and batteries, pharmaceuticals, and enabling industries such as critical minerals and energy have absorbed roughly three-quarters of announced greenfield FDI since 2022.

Exhibit 1 - Canada's foreign direct investment presence is rising, even as global foreign direct investment shrinks.

Second, the U.S.—long the world’s biggest destination for FDI—is changing politically and turning inwards. Strong domestic capital expenditure in the U.S., reinforced by efforts to strengthen America’s investment competitiveness in new and old sectors, has meant Corporate America is investing more at home (Exhibit 2). The world’s biggest sources of capital have also invested heavily in U.S. assets, drawn by its deep capital markets and impressive returns. The U.S.’s share of Canada’s outbound FDI, for example, is now 36%, up from 11% over the past two decades. Many global institutional investors are eyeing new avenues to park their capital.

Exhibit 2 - Capital and economic weight have decoupled

Third is the rise of what we’re calling the Capital 10, or C10, comprising the ten largest sources of foreign capital outside of the U.S. and China. The group of middle-power nations—Canada, Japan, Singapore, Germany, France, Australia, Spain, Brazil, Sweden, and South Korea—has quietly become the super heavyweight in global FDI (Exhibit 3). Collectively, these countries produce a fifth of global GDP but control 43% of global outward FDI—over 40% more than the U.S. and China combined, despite having half the economic mass.

Exhibit 3 - the C-10 export more than twice as much capital to the US as they import

Canada is in a unique position within the C10. In recent years, the country has attracted 3.6% of the global inward FDI against just 2.0% of global GDP (and is punching even further above its weight on outward FDI, at 5.6%).2 But relative to its potential—abundant resources, a highly educated workforce, and clean, affordable power—Canada remains an underinvested jurisdiction.

Despite its many strengths, Canada’s domestic investment has trailed peers. Canada’s capital stock per worker is roughly $125,000, the fourth lowest among peers and well below the U.S. ($337,000) (Exhibit 4). And though Canada’s GDP per worker ranks fourth highest in the same group, giving Canada the second-most-efficient capital-to-output ratio in the set, the country invests too little to sustain it. Domestic capital expenditures stand at 15% of GDP, tied with the U.K. near the bottom of the peer group. On a net basis, after depreciation, Canada’s investment rate falls to just 1.6% of GDP, the third lowest of the peer group (Exhibit 5).

Exhibit 4 - Canada uses capital efficiently, but the capital base is thin and expanding slowly

Exhibit 5 - Canada underinvests in both gross and net productive investments

Canada has been doing more with less, but that’s not a sustainable growth strategy. Increasingly, Canadian capital is finding its way abroad (Exhibit 6).

Exhibit 6 - Sources of investment into Canada have diversified

Reversing that trend requires a reset.

To attract fresh capital, Canada will need to pivot toward and scale new industries. Two decades ago, thanks to the oilsands boom, oil and gas was the dominant inbound industry in Canada by a wide margin—39 cents of every inbound dollar. Today, it’s two cents.3 In contrast, Canadian institutional investors and corporations have become major participants in the global AI and data-centre build-out, causing outbound Canadian investment in data centres to hit $20 billion in 2025—a sum that nearly equals cumulative inbound data-centre investment since 2005.4 Some of that domestic capital seeking high-tech opportunities abroad could be redirected back home, given the right conditions and returns.5

Realizing this potential will also require Canada to improve its investment attractiveness at the industry level and address the constraints limiting capital formation. The next chapter examines five future-shaping industries to highlight Canada’s investment competitiveness against its peers.

So where might greenfield capital expenditure find a Canadian home?

This chapter examines a handful of sectors where FDI can realistically move. The selections were filtered using the McKinsey Global Institute’s three archetypes that determine investment destinations, of which Canada has all three:

  1. Anchored (resilient, localized), meaning tied to a geography by resource endowment, domestic demand, or regulation;

  2. Footloose (cost-competitive, traded), or sited on global cost-competitiveness and sensitive to input costs, tariffs, and transport;

  3. Arenas (growth, innovation), which are clusters where talent, capital, and infrastructure already co-locate.

We looked at productive, traded-activity-only sectors and excluded those with the added complexity and policy implications of limits to ownership (such as banking, telecommunications, broadcasting, airlines, and rail). The result: five sectors spanning the three archetypes:

  • Liquefied natural gas (LNG) and mining (anchored, with Canada’s endowment the draw but the constraint of getting projects built)

  • Electric vehicles and pharmaceuticals (footloose, where Canada competes on delivered cost and proximity to the U.S.)

  • Data centres (arenas, where Canada competes on power, land and speed, against a U.S. market already building at scale)

These sectors were selected not because we believe they represent Canada’s highest-potential investment opportunities, but because, together, they span different investment archetypes and provide a useful lens on Canada’s underlying competitiveness as a destination for investment.

While Canada’s cost-competitiveness varies across these sectors (Exhibit 7), myriad inherent advantages provide the country with the opportunity to expand its presence. The balance of this chapter provides an overview of each sector, outlining the investment opportunity for Canada, while the appendix to this report has more detailed analyses.

Exhibit 7 - Canada's levelized cost across projects will be benchmarked against select country base cases.

Canada has an opportunity to meet growing global demand for LNG through its abundant, low-cost reserves. The country also has a strategic advantage in delivering LNG on both its west and east coasts. What’s needed is regulatory clarity, predictable timelines, and aligned partnerships with Indigenous and other stakeholders so commercial projects can reach final investment decisions with confidence.

Behind the opportunity

  • Global demand for LNG is expected to increase to nearly 800 million tonnes a year by 2050, an increase of around 75% from 2025 levels. Current project timelines and the global locking-in of long-term contracts suggest a major global LNG supply gap may emerge after 2033 (even before the pre-2026 Strait of Hormuz crisis).

  • When delivering to Asia, Canada’s west coast sits at one of the cheapest cost-levelized positions for LNG producers; its east coast is strategic for European nations seeking to diversify from current low-cost but geopolitically high-risk suppliers (Exhibit 8).

    Exhibit 8 - Canada's levelized costs for liquefied natural gas (LNG) are lower cost than most jurisdictions, but above the Middle East
  • Canada’s LNG is also relatively low-emission. Canada is designed to produce at about 0.15 tonnes of CO2 equivalent per tonne of LNG versus a global average of around 0.35, while fully electrified British Columbia projects are even lower (at around 0.02–0.08 tonnes).6 These emission advantages reflect Canada’s cold climate and the use of low-carbon hydroelectricity to power liquefaction.

  • Increasing Canada’s LNG output to 56 million tonnes per annum (MTPA) – the capacity level modelled in a 2020 Conference Board of Canada scenario – is estimated to add more than $11 billion annually to GDP, create 96,600 jobs, and generate more than $90 billion in government revenue to 2064.7 These benefits extend across the country but also depend on terminals being built—and to fill a terminal, producers drill and process more gas, sustaining $8 billion to $10 billion per year of capital spending, jobs, and royalties.8

  • A secondary benefit is environmental. The stringent regulatory and measurement standards Canadian oil and gas producers operate under results in upstream methane leakage rates lower than many global competitors—the country’s LNG is among the lowest-emission in the world. If it can displace coal in Asian power generation, for example, natural gas could reduce CO2 per megawatt hour by 50–60%,9 an important reduction in global emissions.

  • Canada can position itself to meet upcoming demand by streamlining regulatory approvals and increasing clarity to prevent schedule delays that previously led to cancelled investments. Project viability now also hinges on modern stakeholder alignment, including effective Indigenous partnerships and the reconciliation of capacity growth with net-zero mandates to ensure Canada exports a premium, low-carbon energy product that meets environmental and social considerations.

For a deep dive on Liquified natural gas, download the report.

Canada has significant mineral reserves waiting to be unlocked, not only in areas in which it is already an established leader (such as potash and uranium) but also in those critical to meeting projected global demand shortfalls (such as copper, nickel, and zinc).10 The latter cluster in remote northern districts, where success depends on shared roads, power, and logistics, not mine-by-mine investment. Investing in shared corridor infrastructure and streamlined, district-scale permitting could move many projects forward at once.

Behind the opportunity

  • Global demand for copper and nickel are forecast to outstrip supply in the years ahead, driven by projected demand from electrification, grid build-out, data centres, and defence.

  • Although capital costs are higher, Canada combines a first-rank endowment with deposits that are competitive to operate, a skilled technical workforce, dense supplier base, and research partnerships (Exhibit 9). It has 1,097 listed mining issuers, or about 40% of the world’s listed miners, and in 2024 saw about $10.4 billion in mining equity raised.11

    Exhibit 9 - Canada's levelized cost for greenfield copper projects are lower cost than most jurisdictions, but not the United States
  • In 85 identified Canadian development projects with a publicly disclosed resource or reserve and an identifiable development concept, 88% of pipeline value sits within 18 districts with geographic proximity and shared infrastructure needs. The bottom line: Investment in infrastructure can unlock development, as can more-streamlined permitting and regulatory processes (for example, by resolving Indigenous participation and equity at district scale rather than project by project). Indeed, Canada averages 20.4 years from discovery to production, versus 13.3 years in Australia, and lead times have nearly tripled in three decades.12

  • Addressing the infrastructure gap and creating more certainty in permitting and regulatory process, could help make Canada’s resources both more accessible and affordable. For example, today, northern mines carry operating costs 30–60% higher, while critical mineral projects more than 50 kilometres from transmission record more than three times the capital cost of those within it.13

    Productivity gains could also be pursued at existing operations.North American mining productivity has been flat since 2018. Copper mill-head grades fell 17% between 2012 and 2024. Costs are forecast to rise 23% through 2035, and 78% of projects ran over on cost or time between 2003 and 2023. The cost base concentrates in five categories—sustaining capital, maintenance and spares, energy, consumables, and labour—and AI, automation, and electrification can address each.14

For a deep dive on Mining, download the report.

Canada is competitive in EV assembly, but the more attractive opportunity is upstream in high-value auto components such as powertrains, electronics, battery systems, and software-intensive parts that leverage the country’s precision engineering and supplier capabilities.

Behind the opportunity

  • Leaning into components would better protect against tariffs, competition from China, and possible wage convergence. Canada already has the base: a world-class supplier ecosystem, strong automotive R&D, access to critical battery minerals, and lower-cost low-carbon power.

  • The country’s competitiveness in full-vehicle assembly has been slipping—automotive assembly declined by 44% for Canada between 2010 and 2024 (auto parts increased by 9%). And Canada’s competitive edge in labour is lower compared with some jurisdictions, including Mexico, and may not be durable compared with the U.S. over time (Exhibit 10).

    Exhibit - 10 - Canada's levelized cost for electric vehicles is very similar to the United States as lower labour costs and higher logistics costs offset effects.
  • Evolving beyond manufacturing cheaper, commoditized car parts allows Canada to commercialize its own IP in high-value parts of the supply chain such as advanced software, proprietary battery diagnostics, and specialized recycling tech.

  • Focusing on the EV aftermarket could unlock continuous, high-margin reoccurring revenue over a vehicle’s lifespan. It could transform Canada into a sophisticated technology hub.

  • Expanding into high-end components could lower the barrier to entry for entrepreneurial innovation relative to assembly, allowing Canada to rapidly scale local tech, build specialized competencies, and attract foreign investment.

  • It also increases the potential for export diversification. Components are cheaper and easier to transport than multi-tonne vehicles. This could allow Canada to contribute to production models globally, especially in Europe and Asia, where sales of EVs are projected to grow the most—all while reducing the industry’s overreliance on the U.S.

For a deep dive on Electric vehicles, download the report.

Canada can capitalize on accelerating demand for biologics—products made from living organisms—by securing major manufacturing facilities and, in tandem, address its longstanding challenge of converting innovation to commercialization. More broadly, strengthening Canada’s pharmaceutical manufacturing base can support both domestic health security and participation in resilient global supply chains, while biologics represent a particularly attractive opportunity to build on Canada’s existing scientific and manufacturing capabilities. Canada can become a second manufacturing base alongside the U.S. or European hubs as investors add North American capacity and global manufacturers seek cost-competitive sites for expansion.

Behind the opportunity

  • Canada ranks favourably relative to the U.S., Ireland, and Germany on manufacturing costs per unit (Exhibit 11). The country has a highly skilled labour force built from a network of world-class universities and hospitals, as well as an existing pharma presence. It also offers access to the world’s two largest pharmaceutical markets—the U.S. and Europe.

    Exhibit - 11 - Canada's levelized cost for pharma is less than the United States, in line with Europe, but above China, with labour being the driving factor
  • While Canada’s pre-tax operational costs are the lowest in this peer group, this advantage can narrow on a post-tax basis; ultimate site selection often depends on the integration of federal and provincial government incentive packages.

  • Canada’s existing pharma base includes both innovative products and generics. The country could attract life sciences FDI by offering a single unified pitch: Canadian IP priority (that is, the right of first refusal), its competitive cost positioning, a coordinated Health Canada review path, consolidated provincial payor approvals, and privileged access to public research institutions that produce skilled labour for advanced manufacturing.

  • If done well, Canada could commercialize and retain more of its IP. The country’s domestic capital participation historically drops from 42% in early-stage rounds to 24% in late-stage rounds, with 75% of exit investors being foreign,15 meaning the country’s companies exit prematurely, exporting their IP and value.

  • Contract development and manufacturing organizations (CDMOs) choose sites based on production cost, regulatory track record, technical labour depth, and qualification speed. Canada is attractive on these criteria. Acting now could help the country gain a leadership position as a qualified Canadian CDMO base for antibody-drug conjugates (ADCs), training the operators, processes, and supplier networks. This may give manufacturers a reason to maintain development and clinical work in the country.

For a deep dive on Pharmaceuticals, download the report.

Canada can participate in shaping the global AI and supercomputing economy while securing its own national security and digital sovereignty through investment in data centres. With its cool climate, available land, relatively low-cost energy, grid stability, and skilled construction workers, the country can also use data centres to support downstream capture of value through talent, IP, and AI adoption across the wider economy.

Behind the opportunity

  • Global data-centre demand—measured by the energy required—is expected to roughly triple by 2030, to 278 gigawatts from around 82 gigawatts, with AI accounting for about 70% of that growth.16 It’s estimated that the cumulative investment in facilities alone could exceed US$2.0 trillion to US$2.5 trillion through 2030, multiplying to US$8 trillion to US$10 trillion once compute and IT hardware is included.

  • Canada has several competitive advantages when it comes to becoming a preferred data-centre location. The country is cost-competitive, with low-cost power on a current grid that is relatively low-carbon (Exhibit 12), a cool climate, and grid stability. It also has available land, with the opportunity for some AI data centres (including those for training) to be built away from metropolitan areas, opening parts of Canada previously less suited to development.

    Exhibit 12 - Energy costs have emerged as a primary determinant of data centre colocation cost competitiveness
  • U.S. interconnection is congested, with a median wait of about five years from request to operation.17 Canada can compete by streamlining and standardizing grid connection and permitting and by offering data-centre-ready sites with secured power and pre-cleared permits, backed by a published and enforceable connection timeline.

  • As data centres grow, Canada could work with hyperscalers, other corporate partners, and developers to add new generation of all types (including gas and nuclear), structured so that large loads help protect existing ratepayers (for example, by funding their own grid connection and, in some cases, returning revenue to other customers). In this way, the country could also capture lasting value, such as IP, talent, and sovereignty, rather than only hosting others’ capacity.

For a deep dive on Data centres, download the report.

Canada does not need another competitiveness strategy. What’s required are actions to change the outcome of investment decisions so they increasingly favour Canada. We recommend doing three things well:

  1. Finishing the play: Turning good ideas and policy commitments into truly investable projects

  2. Energizing the system: Making a few bold moves that materially alter risk-adjusted returns

  3. Clearing the bottlenecks: Solving binding constraints in each targeted sector

Many of the challenges highlighted in our analyses of investment sectors have been on government agendas for decades—from the slow, uncertain pace of permitting to a lack of enabling infrastructure, sluggish productivity, and interprovincial barriers. Canada has been moving in the right direction, standing up new initiatives and enacting supportive legislation such as the Major Projects Office, Powering Canada Strong, the National Energy Corridor Agreement, and mutual recognition under the One Canadian Economy Act.

What these announcements and enacted legislation reinforce, though, is that execution, not diagnosis, is what is holding Canada back. Investors do not reposition capital on commitments but proof of change, and Canada needs visible wins it can point to.

Setting clear objectives with milestones and accountability is one potential approach. For example, the UK’s Infrastructure and Projects Authority (IPA) and National Infrastructure and Service Transformation Authority (NISTA) produced annual reports with KPIs, dashboards, and timelines for all major government projects.18

There is a finite window to attract the capital that is rapidly reallocating to future-shaping industries. Canada’s imperative is to swiftly reshape how investors evaluate the country, especially as peers are moving quickly themselves.

For example, the U.S. instituted an “Unleashing Prosperity Through Deregulation” executive order, part of which requires agencies to repeal ten existing rules, regulations, or guidance documents for any new one.19 This ten-to-one deregulation initiative expanded on the prior two-for-one initiative with similar logic. In addition, the U.S. has used multiple tools to incentivize investment, from the One Big Beautiful Bill Act restoring full expensing of domestic R&D to initiatives from prior administrations, including CHIPS20 (combining grants, finance, and a 25% manufacturing ITC) and the IRA21 paying production credits on scaled output.22

Canada can make adjustments to energize its investment climate while also improving risk-adjusted returns along the dimensions of time, cost, certainty and addressable market. While not exhaustive or prescriptive, some actions Canada could consider include the following:

  • Improving the country’s speed by compressing the time-to-build. Regulatory reform could be undertaken to streamline laws across all levels of government or establish precertified corridors and districts where land, baseline assessment, grid, and water are resolved once, not project by project.

  • Making Canada more predictable by reducing policy and regulatory risk for nation-building projects. Canada could freeze key rules at approval (such as environmental standards, carbon pricing, assessment, and consultation) so they remain in force for the life of a project, not only until the next policy cycle.

  • Incentivizing productive investment by providing an integrated (federal and provincial) package of fiscal, financial, and market incentives for priority sectors and designed for multiple investors at national scale, rather than bespoke negotiations. For example, Canada could provide refundable investment tax credits to support upfront project economics, crowd-in financing (such as loan guarantees and cofinancing), and in-kind support, including training and reserved site and grid capacity.

Investment decisions are made at the project level, and each sector has its own bottleneck that, if removed, has the potential to unlock significant additional investment.

Investors are most focused on speed. With power grids at or near capacity across Canada and globally, the binding constraint is new generation and grid connectivity at scale. To capture the opportunity, Canada must energize in years, not decades. This may require the use of near-term gas power generation paired with a concurrent streamlined connection process, smooth regulatory process, and local community compatibility.

While Canada’s competitiveness in traditional manufacturing relies on wage differentials and, often, subsidies, the country has skilled labour and process knowledge advantages for higher-value components and systems, including for specialized manufacturing in sectors such as pharmaceuticals and EVs. Shifting up the value chain requires shovel-ready sites (for example, pre-permitted with power in place), fiscal and financial support tied to outcomes (such as qualification, export volumes, and training), and a credible plan to redeploy and reskill workers to support the shift.

Ambiguity and changing rules around factors such as permitting, requirements for stakeholder engagement, and carbon pricing may discount otherwise attractive risk-adjusted return calculations. By setting clearer rules and committing to hold them stable over time, qualified projects may proceed on commercial terms, even if timelines are longer than other jurisdictions.

Many of Canada’s undeveloped mining projects sit in remote districts where the constraint is not geology but everything after discovery. The opportunity lies in making those districts shovel-ready through corridor-scale infrastructure, coordinated permits, grid, and road access. Shared access spreads cost and risk across a cohort of projects—infrastructure that no single mine could justify alone becomes viable at district scale, and investment decisions follow.

Capital locates where risk-adjusted returns are highest, and Canada has inputs many peers lack—from endowment, to talent and market access, to clean power. Yet the country has historically been underinvested in compared with its peers. By increasing Canada’s competitiveness and, in turn, capturing its fair share of investment, investment in Canada could increase by around $1 trillion over five years, adding an estimated $950 billion to GDP and potentially lifting average annual GDP growth by 2.3 percentage points to about 4% over the period—above the OECD average of 1.5%. This could add 1 million to 1.4 million direct jobs—up to around 2 million when including induced employment.23

Canada’s path to closing this gap is both highly ambitious and achievable and will require rapid, decisive action to turn policy commitments into investable projects, make bold moves that materially alter risk-adjusted returns, and solve binding constraints in critical sectors. It’s not too late. But Canada needs to make decisions that will define the role it plays in critical industries for the next half century—and shape the country’s presence on the international stage.

Our levelized cost methodology converts a project’s full life cycle economics into a single unit of cost. It can be interpreted as the unit price that would make a project’s net present value equal to zero over its entire life cycle, making that project viable, and is in line with the macroeconomic concept of long-run marginal costs.

We model capital expenditures and operating expenditures as time-phased cash flows, discount them using the local weighted average cost of capital, and divide by discounted lifetime output to calculate the levelized cost. The line items captured in the analysis include construction costs, equipment costs, labour costs—determined by wages as well as hourly productivity and hours worked—and operating costs such as materials, energy, and maintenance. The modeling includes additional case-specific inputs such as time to market and scale effects where relevant.

To understand how each driver influences levelized cost, we compare each region to the base case by replacing one factor at a time. For example, in our electric vehicle manufacturing case, we asked how the cost of building a vehicle in Canada would change if a Canadian plant paid Mexican wages. An interaction effect captures the fact that some drivers influence each other and do not add perfectly on their own (for example, a longer construction period matters more in a region with a higher weighted average cost of capital).

The case of an integrated electric vehicle plant illustrates how the levelized cost method works in practice. We analyze a representative plant spanning stamping, body, paint, and general assembly that produces 500,000 battery electric vehicles a year and use it as a benchmark for the levelized cost of one vehicle in dollars. We compare the cost of building the same vehicle in comparable plants in Canada, the United States, Mexico, China, and Japan, the world’s largest auto makers.

In industries where market prices are comparable across economies, levelized cost is a proxy for returns on investment. Because we cost every location on a delivered basis into the same destination market, differences in levelized cost translate directly into differences in margin—which is why a gap of a few hundred dollars a vehicle can be decisive in an industry with thin per-unit margins. Trade measures can outweigh production economics altogether, so we report tariffs separately from levelized cost.

Note: All figures in the investment case are expressed in 2024 dollars, converted from local currencies using 2024 market exchange rates. Our business cases are informed by McKinsey’s work on the five industries, which provides our understanding of how much capital, labour, energy, materials, and other inputs are typically needed to produce a product—here, a battery electric vehicle—and how long the process typically takes. We price these inputs at the typical costs in a geography, also drawing on the proprietary databases maintained by MGI’s Economics Research team, and typical weighted average cost of capital, drawing on McKinsey’s Value Intelligence platform, a curated global database of corporate financials. Levelized costs are presented before taxes and direct subsidies; tariffs are reported separately.

Given Canada’s historical underinvestment and its generational opportunity, we outlined what Canada’s potential could be in quantitative terms. This analysis estimates the share of global investment Canada could attract with improved investment competitiveness and how that investment converts that into GDP and employment gains over five years. It covers the report’s five core industries, their downstream industries, and induced effects across the rest of the economy.

We conduct the analysis by estimating Canada’s investment potential compared with its existing position versus other mature peer economies. We normalize Canada’s position, using a “location quotient,” which compares the share of global investment in an industry that lands in Canada with Canada’s share of global investment overall. A value of 1 denotes that Canada’s economic share is in line with other economies; below 1, Canada is underweight; above 1, it attracts more than its share in an industry compared with other economies. 

The benchmark assumes Canada reaches the top 40% of OECD economies with broadly similar endowments in each industry. In machinery and equipment, this lifts Canada from a location quotient of about 0.1 to about 0.7, roughly where Switzerland stands today; in data centres, proxied by IT and information services, from about 0.8 to about 1.3, roughly the United Kingdom; in pharmaceuticals, from about 0.3 to about 0.6, comparable to Italy; and in basic metals, from about 0.3 to about 0.6, comparable to Sweden. Where Canada already exceeds the benchmark (for example, oil and gas extraction), its position is held rather at that level. This becomes our investment ambition.

The investment Canada can mobilize is broken down in three components. The first is the capital spending already in Canada’s baseline forecast for these industries. The second is the incremental spending needed to close the location quotient gap, calculated year by year from 2026 as the difference between the benchmark ambition level and the baseline. The third is the investment suppliers make to serve that additional demand, derived from Canada’s own industry linkages. Both foreign-direct and domestic investment are included. The final sum of the three components is $962Bn, mobilized over a five-year window.

We then convert that investment into GDP in three steps. Investment accumulates into a capital stock, which depreciates at 7% a year, so only capital still in service contributes to output. That surviving stock is multiplied by an industry-specific ratio of capital to output, estimated from investment and value added over 2010–25. Supplier and wider-economy effects are then added using the Leontief inverse of Canada’s input–output table, which gives the output every other sector must produce to support a dollar of demand in each priority industry. To reflect higher productivity of new capital we use a 15-year estimation window to derive the investment to GDP ratio instead of the full historical timeframe. The result is that new investment is 1.3 times as productive in transforming into GDP as the average existing dollar.

The resulting investment is expected to generate about two million jobs. Job creation is estimated industry by industry over the same period, applying an output-to-employment ratio. This multiplier is consistent with genuinely new productive investment, since new facilities carry more capital per worker and need fewer people for the same output compared with older, depreciated facilities. New capacity is also modeled at a higher rate of automation adoption than the existing footprint, reflecting the technology it arrives with.

To fill the labor gap generated by this investment, Canada will need to fill roles through a combination of falling unemployment, higher labor-force participation within its historical range, and a reduction in underemployment. Additionally, an increase in net immigration would also benefit the balance.

Industry investment and value added are drawn from the S&P Global Market Intelligence data set, with peer positions measured over 2019–25. Supplier and wider-economy linkages use the OECD input–output table for Canada (2022) and OECD Trade in Employment data for the same year. Labor market figures come from the Statistics Canada Labour Force Survey through July 2026, with historical ranges for unemployment and participation taken from the annual series since 1976 underemployment from the 2025 part-time employment by reason series.

FDI is often interpreted as a metric of global investment competitiveness, a signal where investors believe the best risk-adjusted returns are to be found. While true, headline FDI can conceal more than it reveals. For starters, FDI includes cross-border M&A activity—the redistribution of ownership claims—which, on its own, does not lead to capacity expansion or productivity growth. Foreign capital that buys an existing Canadian mine is materially different than foreign capital that builds a new mine. The scale of that difference, in Canada’s case, is larger than headline figures may suggest. Over the past decade, M&A activity made up about 30% of inward FDI into Canada and about 40% of outward FDI.24

FDI is a means to a higher and more lucrative end. The real prize is greenfield capital expenditure—that’s new infrastructure, plant, equipment, software, IP, and R&D—financial flows that are converted into capacity expansion, theoretical and applied knowledge, supply chain deepening, and productivity enhancements. Countries that equip their workforce with more and better machinery, equipment, and software are more productive and dynamic, all things considered.

Download the Report

1 UN Trade and Development FDI trends data.

2 UN Trade and Development.

3 fDi Markets.

4 fDi Markets.

5 There is one place where this pattern runs in reverse: Canada has been a net importer of R&D investment. Since 2005, R&D-designated capital flowing into Canada—roughly $65 billion, 13% of everything inbound—has significantly outweighed R&D capital leaving the country. Outbound R&D investment totals $10 billion, or 2% of the outbound total. Whatever else is true about Canadian capital heading for the exits, the country’s role as a place where research gets funded has not eroded; fDi Markets.

6 Mark Cameron and Arash Golshan, “Refuel,” Public Policy Forum, December 8, 2025.

7 Conference Board of Canada, 2020; Government of British Columbia.

8 “Why Canada is on the brink of LNG-driven prosperity,” Resource Works, April 24, 2025.

9 Public Policy Forum; Canadian Energy Centre; Oxford Institute for Energy Studies.

10 “Addressing Canada’s productivity gap: A journey towards global leadership,” McKinsey, November 3, 2025.

11 “Minerals and the economy,” Natural Resources Canada, updated on February 27, 2026.

12 “From discovery to delay: Mine permitting stretches project timelines,” S&P Global, July 8, 2026.

13 Levelleing the playing field, The Mining Associate of Canada, May 5, 2015.

14 Global Materials Perspective 2025, McKinsey, October 2025.

15 “Does Canada own its life sciences future?,” adMare Institute, July 2025.

16 Analysis of Maria Goodpaster, Piotr Pikul, Anna Kortis, and Olivier Bus, “Colocation data centers: The infrastructure race behind AI,” McKinsey Global Institute, June 30, 2026.

17 Queued up: 2026 edition—characteristics of power plants seeking transmission interconnection as of the end of 2025, Berkeley Lab, June 2026.

18 “Annual report 2025/2026,” National Infrastructure & Service Transformation Authority, July 2026.

19 “Unleashing Prosperity through Deregulation,” White House, January 31, 2025.

20 CHIPS refers to the Creating Helpful Incentives to Produce Semiconductors (CHIPS) for America provisions of the CHIPS and Science Act of 2022, which provided federal incentives to support semiconductor manufacturing and research in the United States.

21 IRA refers to the Inflation Reduction Act of 2022, which included tax incentives to support domestic clean-energy manufacturing and investment.

22 “One Big Beautiful Bill Act tax policies: Details and analysis,” Tax Foundation, February 10, 2026; “U.S. Department of the Treasury releases final rules to strengthen U.S. semiconductor industry,” U.S. Department of the Treasury, October 22, 2024; “The Section 45X Advanced Manufacturing Production Credit,” U.S. Congress, August 13, 2026.

23 “McKinsey Global Institute analysis.

24 Data extracted and processed from “Balance of international payments, flows of Canadian direct investment abroad and foreign direct investment in Canada, quarterly (x 1,000,000),” Statistic Canada, August 27, 2026.

Language Flag Filename

rbc_language_toggle_menu_flag

U.S. President Donald Trump put Canada “on notice” with a Venezuela pivot and plan to take control of a portion of the South American country’s oil reserves. 

But can Venezuela realistically displace the oilsands? 

Why is heavy oil so important to the U.S.?: The U.S. cannot easily replace Canadian supply: domestic production is overwhelmingly light, and heavy-crude alternatives from Mexico and Venezuela have structurally declined. 

The Venezuelan-Canadian heavy oil rivalry is not new. The two were vying for space in U.S. refineries in the 1990s and early 2000s —but that hasn’t been the case for years. Heavy crude exports from Venezuela to the U.S. has plummeted from more than 1.5 million barrels per day (bpd) in 2000 to negligible levels in recent years. However, since Washington’s toppling of Nicolas Maduro’s regime, Venezuelan crude has pushed back up, hitting  630,000 bpd in June. In contrast, Canada exported more than four-million bpd to the U.S. that month—and it remains the U.S.’s biggest source of imported crude.

The cost of boosting production in Venezuela would be staggering. It would require billions in investment over a decade, in part due to the mismanagement of infrastructure and assets in Venezuela from the mid-2000s onward, as well as the aging of many of the country’s most prolific fields, according to the RBC Commodity Strategy Team.   

A Venezuelan oil comeback “would likely be slow, expensive and politically fragile,.” wrote Shaz Merwat, RBC Thought Leadership Energy Policy Lead in a note late last year. 

Most companies are wary of returning to Venezuela—for now. Companies that previously operated in Venezuela have hesitated due to concerns including debt recovery stemming from the sanctions era. ExxonMobil and ConocoPhillips have held off returning to Venezuela after losing billions of dollars’ worth of assets in state expropriations.  

But some have jumped in. U.S. firm Chevron and Italy’s Eni are the first to return after Trump’s announcement. Chevron’s US$7 billion investment plan over the next five years could more than double its production in Venezuela to 600,000 barrels per day. 

The heavy oil fight will be more intense in the next few years. Venezuela’s supply could rise by 110,000 bpd in 2026 and another 245,000 bpd in 2027, according to the RBC commodity strategy team. With the U.S. claim that it controls 65 billion barrels of proven oil reserves in Venezuela, there’s potential for more, assuming the plan could survive legal and contractual challenges in Venezuela and the U.S., and political shifts in both countries.   

What does it mean for Canada? Canadian oil firms pumped out a record 5.35 million barrels per day in crude oil production last year, and have largely shrugged off U.S. efforts to resurrect Venezuela’s oil industry. The country’s top energy stocks have continued to rise amid higher oil prices.  

Canadian oil and gas industry is attracting U.S. and global attention. In recent weeks, firms like KKR, Apollo and Northern Oil and Gas have invested in the Canadian industry. LNG Canada’s Phase 2 project—a joint venture comprised of five global energy companies including oil major Shell—is now with the government’s Major Projects Office (MPO) for streamlined approval. 

Canada is looking to Asia. Efforts are also underway to help Canada diversify if Venezuela boost productions in a more meaningful way. The proposed West Coast Pipeline will bring one million bpd from Alberta to B.C., targetting Asia. Regardless of how U.S. policy evolves, Canadian producers are positioning themselves to secure diversified market access and greater resilience, amid the rising competition.  

Canada and the U.S. traded barbs: U.S. Treasury Secretary Scott Bessent said his country was “not at war” with Canada, mocking the threat it could pose with “submarines from the Edmonton mall.” Prime Minister Mark Carney said Americans should “stop doing memes, stop throwing shade, stop trying to be tough and start being serious.”  

Republicans backed Trump’s trade war: Republican members of Congress met with U.S. Trade Representative Jamieson Greer this week, and generally expressed support for the president’s trade strategy, blaming Carney for walking away from negotiations.  

Global finance ministers and central bankers met at the G20: China was the lone country that rejected parts of a joint statement that was released following the summit, including a paragraph that said countries would “take steps to eliminate non-market policies and practices.”  

The Canada Investment Summit draws near, as trade tensions with U.S. loom: Carney and top Canadian CEOs plan to showcase energy, critical minerals, defence and advanced technologies at the investment summit, according to a report.