Geopolitics, Trade and the Economy

Canada's New Capital Playbook

How five key sectors show what's possible

Read time 33 minutes

The world has entered a new chapter of capitalism. More savings are flowing into new sectors and frontier technologies. More governments are leveraging their balance sheets again to direct economies. And more investors are looking anew to a range of mid-sized economies and resource basins to hedge against geopolitical disruptions.

Canada is at the centre of it all, competing for the trillions of dollars of capital at play.

Ahead of the Canada Investment Summit, in Toronto in September, RBC Thought Leadership and McKinsey & Company teamed up to assess the new global map of capital and Canada’s place in it. This unprecedented project is built on the McKinsey Global Institute’s seminal report, Catalyzing competitiveness: Where investment happens and why, which reframed the competitiveness question around a simple test: where is productive capital being invested, and why? Its analysis looked beyond broad measures of competitiveness to the economics of real investment decisions across sectors.

A McKinsey & Company and RBC Thought Leadership research team layered on to that methodology a rich set of Canadian insights and data. We sought to understand how investors might assess Canada when deciding where to put their next dollar of capital. The resulting research illustrates that Canada is quite competitive with its peers, particularly when it comes to some key future-focused sectors.

The report aims to help public- and private-sector leaders better understand this new age of capital—and Canada’s opportunity in it. 

John Stackhouse, Senior-Vice President, Office of the CEO, Royal Bank of Canada

Zak Cutler, Senior Partner and Toronto Managing Partner, McKinsey & Company

  • Global capital is scarcer and increasingly channelled to a handful of innovative sectors. About three-quarters of announced foreign direct investment (FDI) since 2022 has gone to data centres, semiconductors, electric vehicles (EVs) and batteries, pharmaceuticals, and enabling industries, such as critical minerals and energy.

  • The global capital map is shifting, with middle powers such as Canada emerging as heavyweight investors. The Capital 10 (C10), the ten largest players outside the U.S. and China, produce one-fifth of global GDP but control 43% of outward FDI, far more than the U.S. and China combined despite having half the economic mass.1 The C10 also comprises Japan, Singapore, Germany, France, Australia, Spain, Brazil, Sweden, and South Korea.

  • These global shifts have resulted in many large, institutional investors looking to diversify. Greater returns, speed, certainty and market access are key ingredients to success. But the competition for global capital has never been more intense.

  • Canada could become the G7’s growth leader if it changes its playbook. Unlocking $1 trillion in incremental capital expenditure over five years could translate into $950 billion in GDP and up to 1.4 million direct jobs.

  • Canada has a powerful story to tell as an investment hub. Canada, abundant in resources, is most competitive where power costs dominate. However, it will need to raise its game on labour costs and scale economics. The country can capitalize on several opportunities, including in these five sectors:

    • Liquefied natural gas (LNG): Canada’s west coast sits at one of the cheapest cost-levelized positions for LNG producers exporting to Asia, and its east coast is strategic for European nations seeking to diversify their energy supply.

    • Mining: Canada combines an enviable endowment with deposits that are competitive to operate, a skilled workforce, a dense supplier base, and research partnerships that it can leverage to scale its established industries (potash and uranium) and minerals that are critical to meeting projected global demand shortfalls (copper, nickel, and zinc).

    • Electric vehicles: Canada could transform into a tech hub by focusing on high-value auto components (powertrains, electronics, battery systems, and software-intensive parts), increasing its potential for export diversification.

    • Pharmaceuticals: Canada ranks favourably relative to the U.S., Ireland, and Germany on manufacturing costs per unit and could leverage its highly skilled labour force built from a network of world-class universities and hospitals.

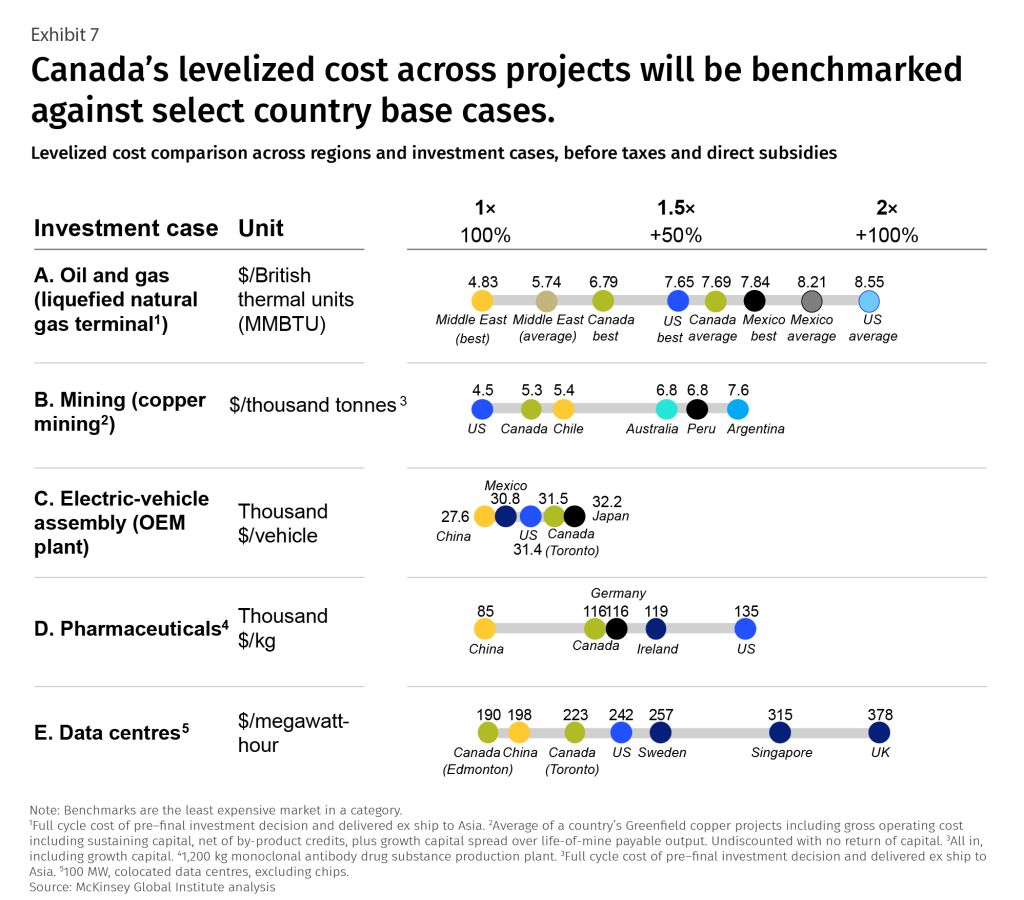
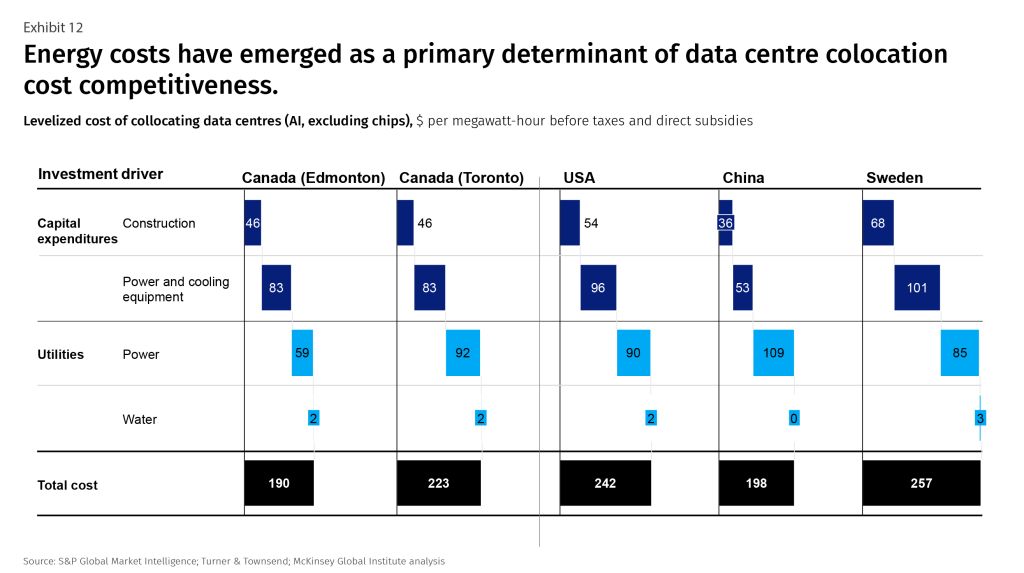
    • Data centres: Canada could become a preferred data-centre location with its cool climate, available land, relatively low-cost energy, grid stability, and skilled construction workers. Levelized costs to build a data centre in Canada stands at $190 per megawatt hour (MWh), compared with $242 for the U.S.

The geopolitical realignment currently unfolding has dramatically changed how investors assess risk and rewards, with many institutional players with large pools of capital looking to diversify. For proof, look no further than the Canada Investment Summit, attracting some of the world’s biggest investors, with a total of more than $100 trillion under management.

With so much capital in search of a new home, and nation building very much in style, competition is heating up. Many countries, looking to shore up their domestic economies, are trying to create the necessary conditions to attract large amounts of foreign direct investment (FDI) to fund critical infrastructure and technology. The big winners will be those who best combine higher returns with speed, certainty and market access.

Canada is well positioned for this new dynamic.

Our analysis indicates that with some changes to its playbook, Canada could unlock $1 trillion in incremental capital expenditure in the next five years, transforming the country into the G7’s GDP growth leader. That scale of investment implies a 10-15% increase in GDP per capita and up to 1.4 million direct jobs.

But before diving into what it will take for Canada to capitalize on this generational opportunity, it’s important to zoom out. When you do, it becomes clear that global capital is caught in three crosscurrents, each pulling in a different direction.

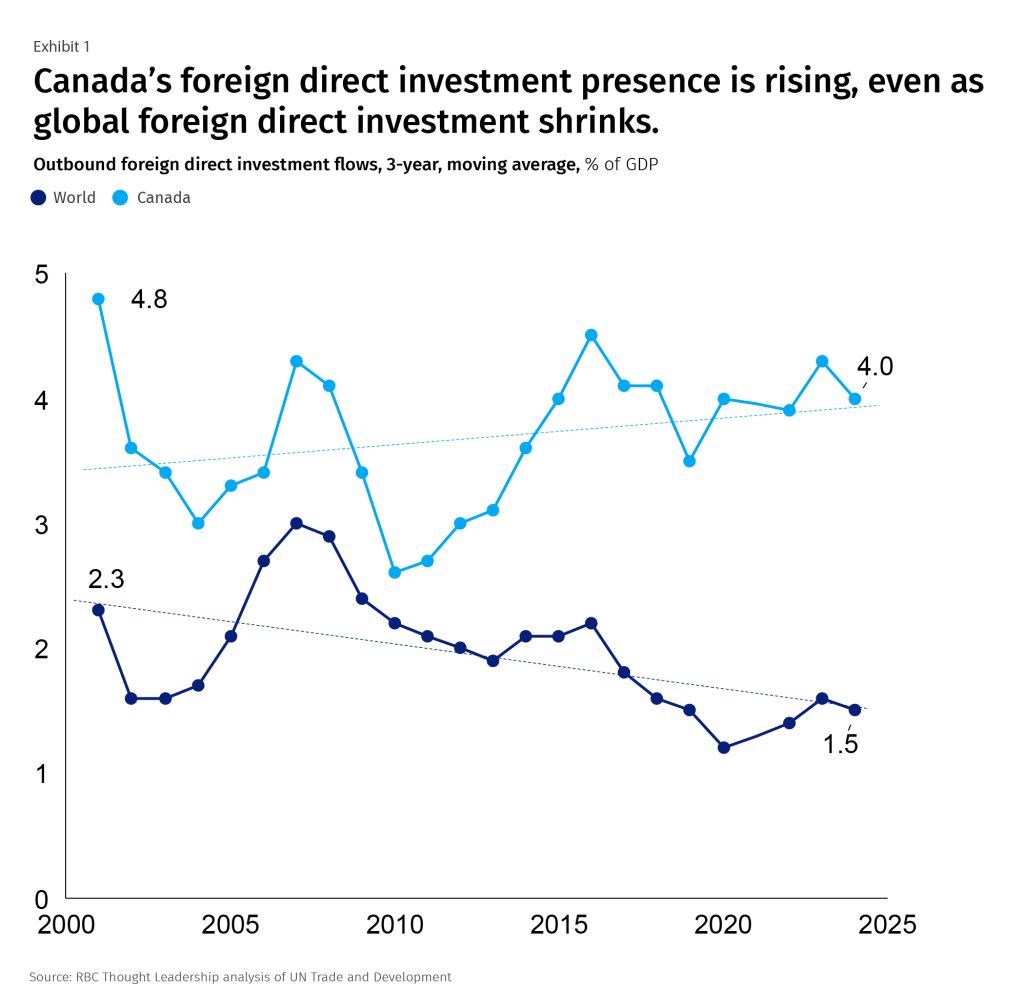
First, global FDI is becoming scarcer and concentrating in future-shaping industries (Exhibit 1). Data centres, semiconductors, electric vehicles and batteries, pharmaceuticals, and enabling industries such as critical minerals and energy have absorbed roughly three-quarters of announced greenfield FDI since 2022.

Exhibit 1 - Canada's foreign direct investment presence is rising, even as global foreign direct investment shrinks.

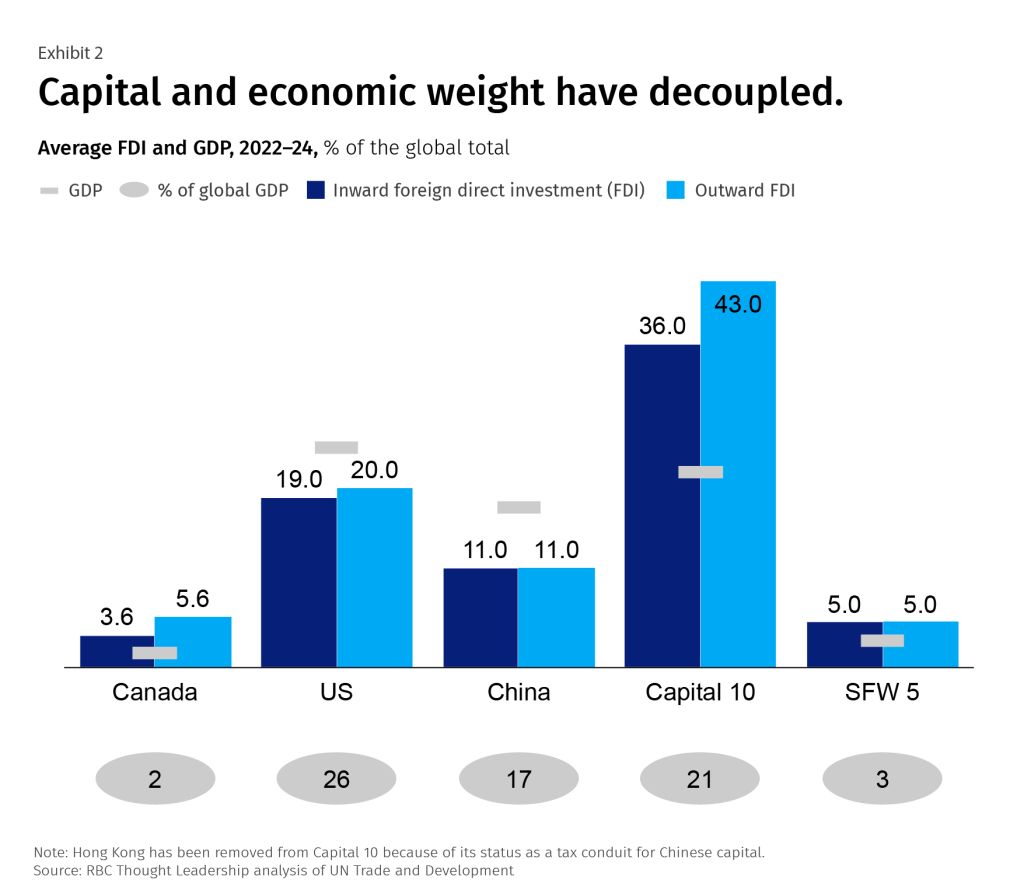
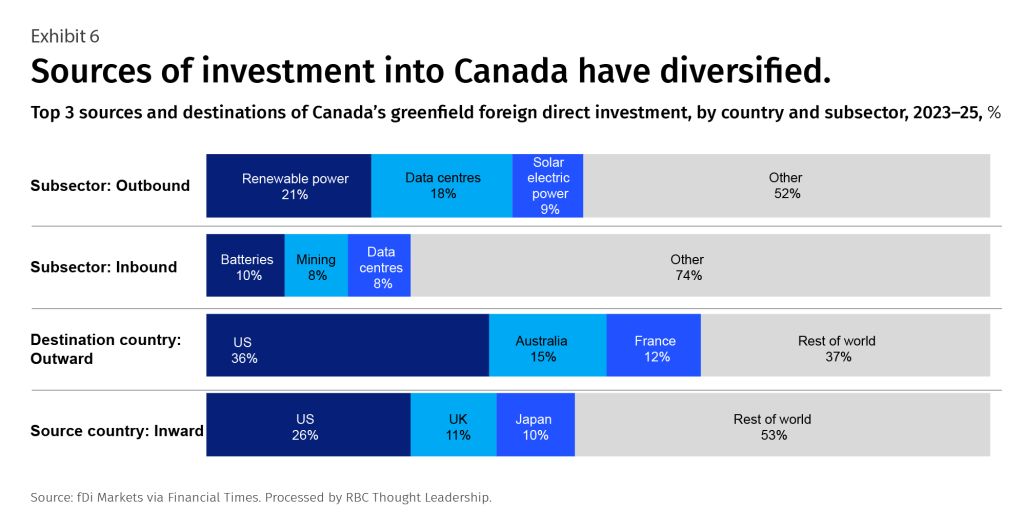
Second, the U.S.—long the world’s biggest destination for FDI—is changing politically and turning inwards. Strong domestic capital expenditure in the U.S., reinforced by efforts to strengthen America’s investment competitiveness in new and old sectors, has meant Corporate America is investing more at home (Exhibit 2). The world’s biggest sources of capital have also invested heavily in U.S. assets, drawn by its deep capital markets and impressive returns. The U.S.’s share of Canada’s outbound FDI, for example, is now 36%, up from 11% over the past two decades. Many global institutional investors are eyeing new avenues to park their capital.

Exhibit 2 - Capital and economic weight have decoupled

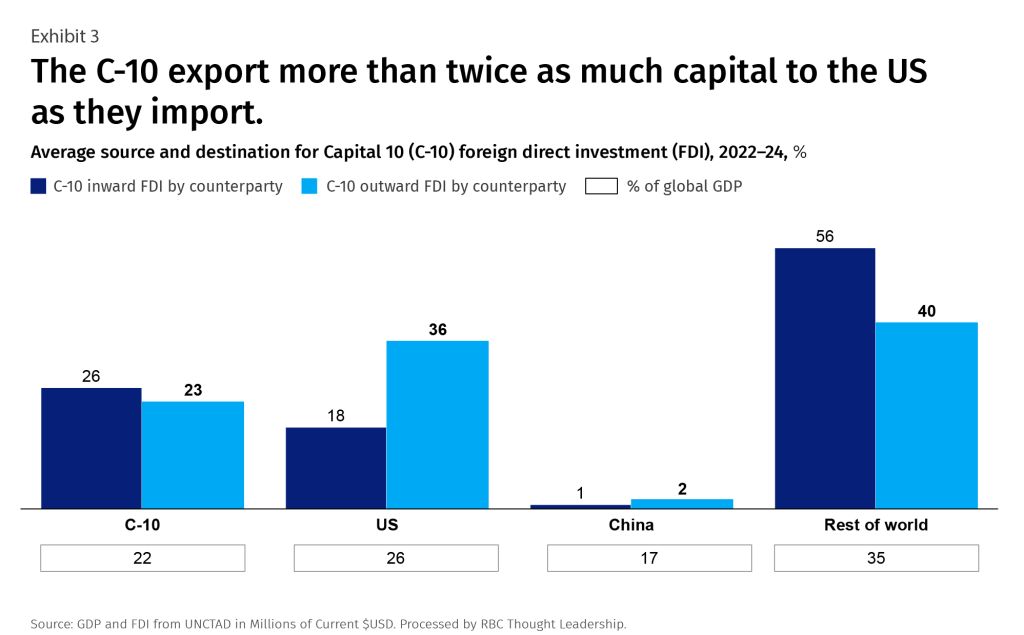
Third is the rise of what we’re calling the Capital 10, or C10, comprising the ten largest sources of foreign capital outside of the U.S. and China. The group of middle-power nations—Canada, Japan, Singapore, Germany, France, Australia, Spain, Brazil, Sweden, and South Korea—has quietly become the super heavyweight in global FDI (Exhibit 3). Collectively, these countries produce a fifth of global GDP but control 43% of global outward FDI—over 40% more than the U.S. and China combined, despite having half the economic mass.

Exhibit 3 - the C-10 export more than twice as much capital to the US as they import

Canada is in a unique position within the C10. In recent years, the country has attracted 3.6% of the global inward FDI against just 2.0% of global GDP (and is punching even further above its weight on outward FDI, at 5.6%).2 But relative to its potential—abundant resources, a highly educated workforce, and clean, affordable power—Canada remains an underinvested jurisdiction.

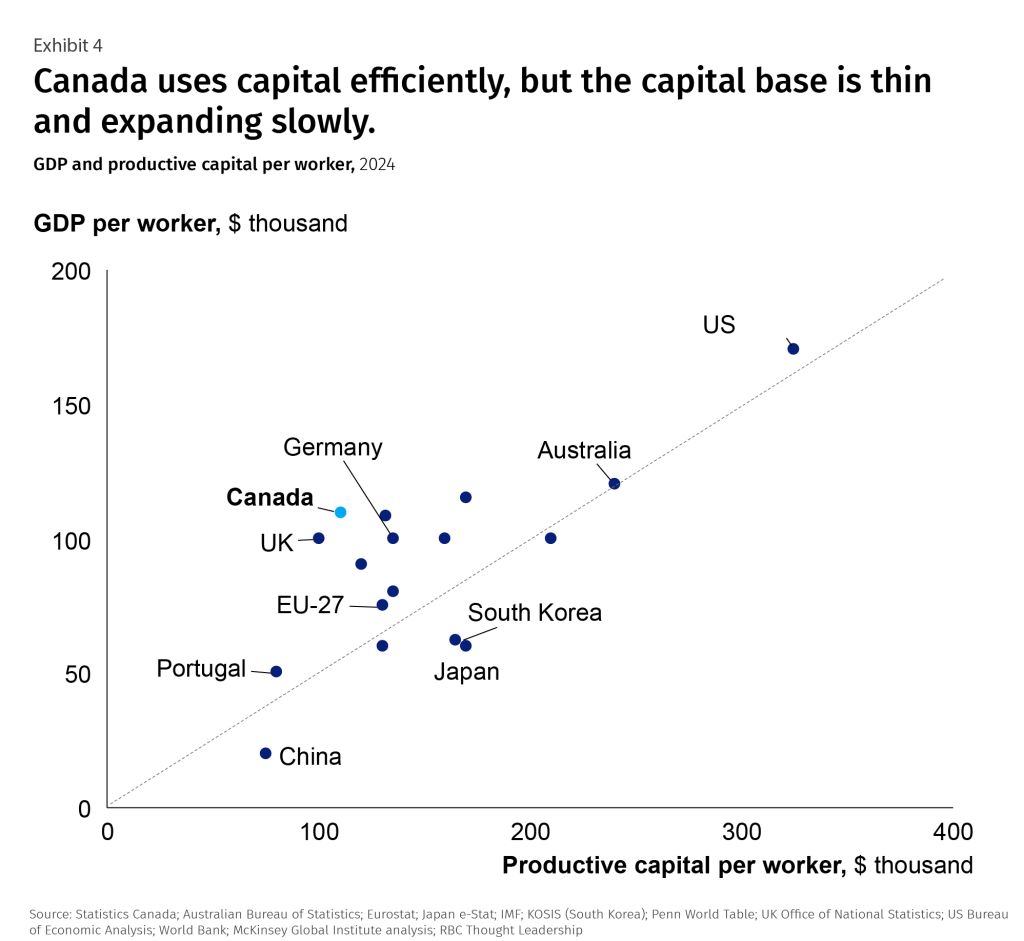
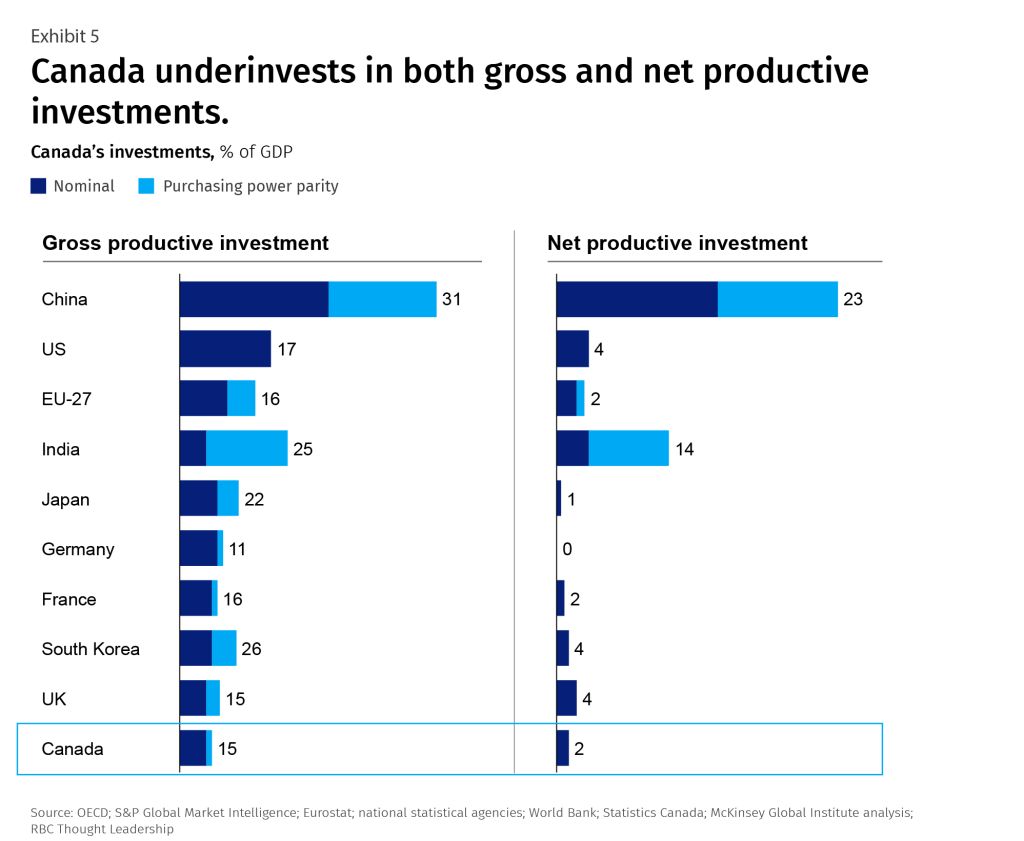
Despite its many strengths, Canada’s domestic investment has trailed peers. Canada’s capital stock per worker is roughly $125,000, the fourth lowest among peers and well below the U.S. ($337,000) (Exhibit 4). And though Canada’s GDP per worker ranks fourth highest in the same group, giving Canada the second-most-efficient capital-to-output ratio in the set, the country invests too little to sustain it. Domestic capital expenditures stand at 15% of GDP, tied with the U.K. near the bottom of the peer group. On a net basis, after depreciation, Canada’s investment rate falls to just 1.6% of GDP, the third lowest of the peer group (Exhibit 5).

Exhibit 4 - Canada uses capital efficiently, but the capital base is thin and expanding slowly

Exhibit 5 - Canada underinvests in both gross and net productive investments

Canada has been doing more with less, but that’s not a sustainable growth strategy. Increasingly, Canadian capital is finding its way abroad (Exhibit 6).

Exhibit 6 - Sources of investment into Canada have diversified

Reversing that trend requires a reset.

To attract fresh capital, Canada will need to pivot toward and scale new industries. Two decades ago, thanks to the oilsands boom, oil and gas was the dominant inbound industry in Canada by a wide margin—39 cents of every inbound dollar. Today, it’s two cents.3 In contrast, Canadian institutional investors and corporations have become major participants in the global AI and data-centre build-out, causing outbound Canadian investment in data centres to hit $20 billion in 2025—a sum that nearly equals cumulative inbound data-centre investment since 2005.4 Some of that domestic capital seeking high-tech opportunities abroad could be redirected back home, given the right conditions and returns.5

Realizing this potential will also require Canada to improve its investment attractiveness at the industry level and address the constraints limiting capital formation. The next chapter examines five future-shaping industries to highlight Canada’s investment competitiveness against its peers.

So where might greenfield capital expenditure find a Canadian home?

This chapter examines a handful of sectors where FDI can realistically move. The selections were filtered using the McKinsey Global Institute’s three archetypes that determine investment destinations, of which Canada has all three:

  1. Anchored (resilient, localized), meaning tied to a geography by resource endowment, domestic demand, or regulation;

  2. Footloose (cost-competitive, traded), or sited on global cost-competitiveness and sensitive to input costs, tariffs, and transport;

  3. Arenas (growth, innovation), which are clusters where talent, capital, and infrastructure already co-locate.

We looked at productive, traded-activity-only sectors and excluded those with the added complexity and policy implications of limits to ownership (such as banking, telecommunications, broadcasting, airlines, and rail). The result: five sectors spanning the three archetypes:

  • Liquefied natural gas (LNG) and mining (anchored, with Canada’s endowment the draw but the constraint of getting projects built)

  • Electric vehicles and pharmaceuticals (footloose, where Canada competes on delivered cost and proximity to the U.S.)

  • Data centres (arenas, where Canada competes on power, land and speed, against a U.S. market already building at scale)

These sectors were selected not because we believe they represent Canada’s highest-potential investment opportunities, but because, together, they span different investment archetypes and provide a useful lens on Canada’s underlying competitiveness as a destination for investment.

While Canada’s cost-competitiveness varies across these sectors (Exhibit 7), myriad inherent advantages provide the country with the opportunity to expand its presence. The balance of this chapter provides an overview of each sector, outlining the investment opportunity for Canada, while the appendix to this report has more detailed analyses.

Exhibit 7 - Canada's levelized cost across projects will be benchmarked against select country base cases.

Canada has an opportunity to meet growing global demand for LNG through its abundant, low-cost reserves. The country also has a strategic advantage in delivering LNG on both its west and east coasts. What’s needed is regulatory clarity, predictable timelines, and aligned partnerships with Indigenous and other stakeholders so commercial projects can reach final investment decisions with confidence.

Behind the opportunity

  • Global demand for LNG is expected to increase to nearly 800 million tonnes a year by 2050, an increase of around 75% from 2025 levels. Current project timelines and the global locking-in of long-term contracts suggest a major global LNG supply gap may emerge after 2033 (even before the pre-2026 Strait of Hormuz crisis).

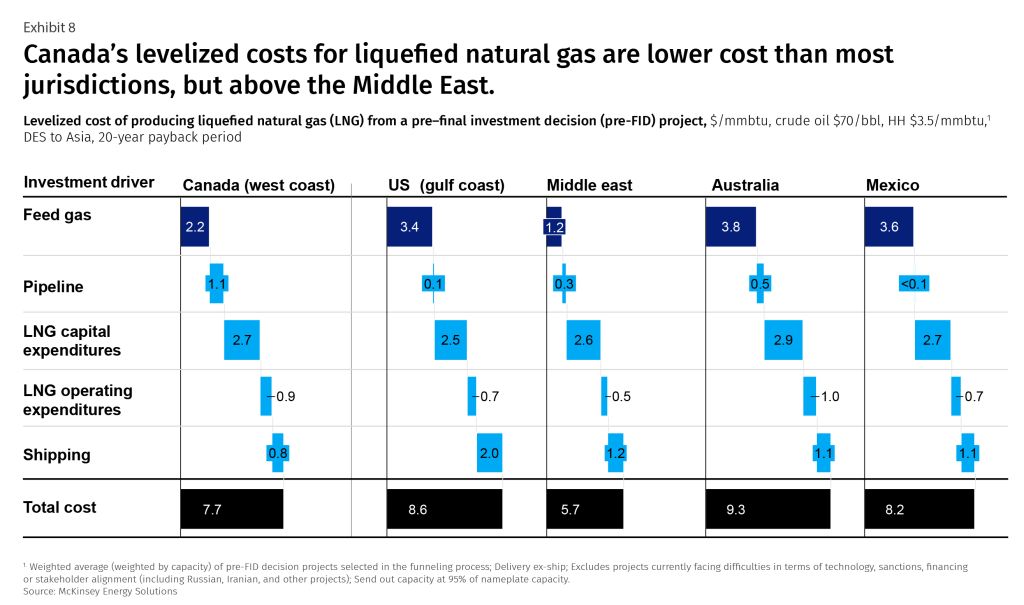
  • When delivering to Asia, Canada’s west coast sits at one of the cheapest cost-levelized positions for LNG producers; its east coast is strategic for European nations seeking to diversify from current low-cost but geopolitically high-risk suppliers (Exhibit 8).

    Exhibit 8 - Canada's levelized costs for liquefied natural gas (LNG) are lower cost than most jurisdictions, but above the Middle East
  • Canada’s LNG is also relatively low-emission. Canada is designed to produce at about 0.15 tonnes of CO2 equivalent per tonne of LNG versus a global average of around 0.35, while fully electrified British Columbia projects are even lower (at around 0.02–0.08 tonnes).6 These emission advantages reflect Canada’s cold climate and the use of low-carbon hydroelectricity to power liquefaction.

  • Increasing Canada’s LNG output to 56 million tonnes per annum (MTPA) – the capacity level modelled in a 2020 Conference Board of Canada scenario – is estimated to add more than $11 billion annually to GDP, create 96,600 jobs, and generate more than $90 billion in government revenue to 2064.7 These benefits extend across the country but also depend on terminals being built—and to fill a terminal, producers drill and process more gas, sustaining $8 billion to $10 billion per year of capital spending, jobs, and royalties.8

  • A secondary benefit is environmental. The stringent regulatory and measurement standards Canadian oil and gas producers operate under results in upstream methane leakage rates lower than many global competitors—the country’s LNG is among the lowest-emission in the world. If it can displace coal in Asian power generation, for example, natural gas could reduce CO2 per megawatt hour by 50–60%,9 an important reduction in global emissions.

  • Canada can position itself to meet upcoming demand by streamlining regulatory approvals and increasing clarity to prevent schedule delays that previously led to cancelled investments. Project viability now also hinges on modern stakeholder alignment, including effective Indigenous partnerships and the reconciliation of capacity growth with net-zero mandates to ensure Canada exports a premium, low-carbon energy product that meets environmental and social considerations.

For a deep dive on Liquified natural gas, download the report.

Canada has significant mineral reserves waiting to be unlocked, not only in areas in which it is already an established leader (such as potash and uranium) but also in those critical to meeting projected global demand shortfalls (such as copper, nickel, and zinc).10 The latter cluster in remote northern districts, where success depends on shared roads, power, and logistics, not mine-by-mine investment. Investing in shared corridor infrastructure and streamlined, district-scale permitting could move many projects forward at once.

Behind the opportunity

  • Global demand for copper and nickel are forecast to outstrip supply in the years ahead, driven by projected demand from electrification, grid build-out, data centres, and defence.

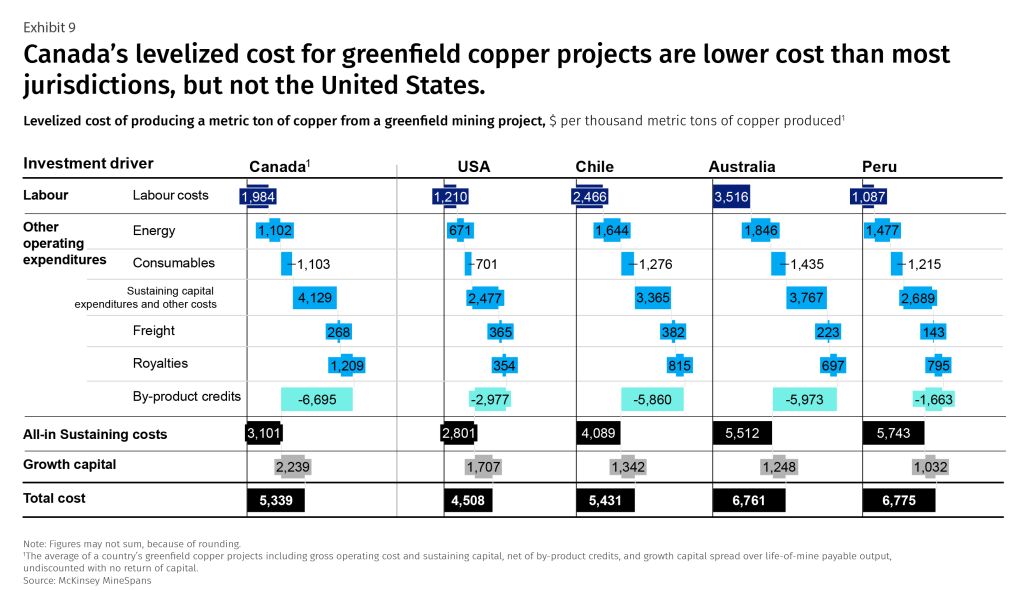
  • Although capital costs are higher, Canada combines a first-rank endowment with deposits that are competitive to operate, a skilled technical workforce, dense supplier base, and research partnerships (Exhibit 9). It has 1,097 listed mining issuers, or about 40% of the world’s listed miners, and in 2024 saw about $10.4 billion in mining equity raised.11

    Exhibit 9 - Canada's levelized cost for greenfield copper projects are lower cost than most jurisdictions, but not the United States
  • In 85 identified Canadian development projects with a publicly disclosed resource or reserve and an identifiable development concept, 88% of pipeline value sits within 18 districts with geographic proximity and shared infrastructure needs. The bottom line: Investment in infrastructure can unlock development, as can more-streamlined permitting and regulatory processes (for example, by resolving Indigenous participation and equity at district scale rather than project by project). Indeed, Canada averages 20.4 years from discovery to production, versus 13.3 years in Australia, and lead times have nearly tripled in three decades.12

  • Addressing the infrastructure gap and creating more certainty in permitting and regulatory process, could help make Canada’s resources both more accessible and affordable. For example, today, northern mines carry operating costs 30–60% higher, while critical mineral projects more than 50 kilometres from transmission record more than three times the capital cost of those within it.13

    Productivity gains could also be pursued at existing operations.North American mining productivity has been flat since 2018. Copper mill-head grades fell 17% between 2012 and 2024. Costs are forecast to rise 23% through 2035, and 78% of projects ran over on cost or time between 2003 and 2023. The cost base concentrates in five categories—sustaining capital, maintenance and spares, energy, consumables, and labour—and AI, automation, and electrification can address each.14

For a deep dive on Mining, download the report.

Canada is competitive in EV assembly, but the more attractive opportunity is upstream in high-value auto components such as powertrains, electronics, battery systems, and software-intensive parts that leverage the country’s precision engineering and supplier capabilities.

Behind the opportunity

  • Leaning into components would better protect against tariffs, competition from China, and possible wage convergence. Canada already has the base: a world-class supplier ecosystem, strong automotive R&D, access to critical battery minerals, and lower-cost low-carbon power.

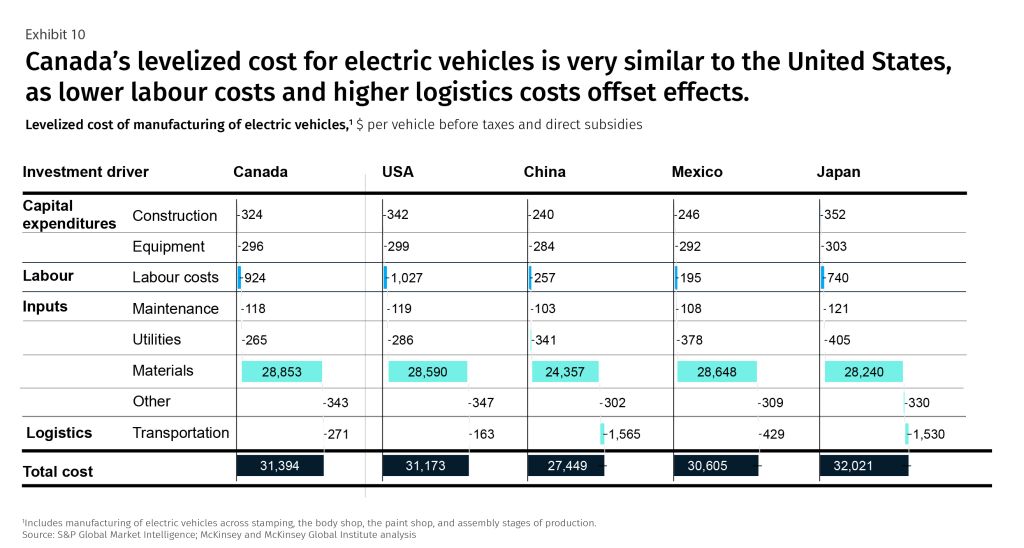
  • The country’s competitiveness in full-vehicle assembly has been slipping—automotive assembly declined by 44% for Canada between 2010 and 2024 (auto parts increased by 9%). And Canada’s competitive edge in labour is lower compared with some jurisdictions, including Mexico, and may not be durable compared with the U.S. over time (Exhibit 10).

    Exhibit - 10 - Canada's levelized cost for electric vehicles is very similar to the United States as lower labour costs and higher logistics costs offset effects.
  • Evolving beyond manufacturing cheaper, commoditized car parts allows Canada to commercialize its own IP in high-value parts of the supply chain such as advanced software, proprietary battery diagnostics, and specialized recycling tech.

  • Focusing on the EV aftermarket could unlock continuous, high-margin reoccurring revenue over a vehicle’s lifespan. It could transform Canada into a sophisticated technology hub.

  • Expanding into high-end components could lower the barrier to entry for entrepreneurial innovation relative to assembly, allowing Canada to rapidly scale local tech, build specialized competencies, and attract foreign investment.

  • It also increases the potential for export diversification. Components are cheaper and easier to transport than multi-tonne vehicles. This could allow Canada to contribute to production models globally, especially in Europe and Asia, where sales of EVs are projected to grow the most—all while reducing the industry’s overreliance on the U.S.

For a deep dive on Electric vehicles, download the report.

Canada can capitalize on accelerating demand for biologics—products made from living organisms—by securing major manufacturing facilities and, in tandem, address its longstanding challenge of converting innovation to commercialization. More broadly, strengthening Canada’s pharmaceutical manufacturing base can support both domestic health security and participation in resilient global supply chains, while biologics represent a particularly attractive opportunity to build on Canada’s existing scientific and manufacturing capabilities. Canada can become a second manufacturing base alongside the U.S. or European hubs as investors add North American capacity and global manufacturers seek cost-competitive sites for expansion.

Behind the opportunity

  • Canada ranks favourably relative to the U.S., Ireland, and Germany on manufacturing costs per unit (Exhibit 11). The country has a highly skilled labour force built from a network of world-class universities and hospitals, as well as an existing pharma presence. It also offers access to the world’s two largest pharmaceutical markets—the U.S. and Europe.

    Exhibit - 11 - Canada's levelized cost for pharma is less than the United States, in line with Europe, but above China, with labour being the driving factor
  • While Canada’s pre-tax operational costs are the lowest in this peer group, this advantage can narrow on a post-tax basis; ultimate site selection often depends on the integration of federal and provincial government incentive packages.

  • Canada’s existing pharma base includes both innovative products and generics. The country could attract life sciences FDI by offering a single unified pitch: Canadian IP priority (that is, the right of first refusal), its competitive cost positioning, a coordinated Health Canada review path, consolidated provincial payor approvals, and privileged access to public research institutions that produce skilled labour for advanced manufacturing.

  • If done well, Canada could commercialize and retain more of its IP. The country’s domestic capital participation historically drops from 42% in early-stage rounds to 24% in late-stage rounds, with 75% of exit investors being foreign,15 meaning the country’s companies exit prematurely, exporting their IP and value.

  • Contract development and manufacturing organizations (CDMOs) choose sites based on production cost, regulatory track record, technical labour depth, and qualification speed. Canada is attractive on these criteria. Acting now could help the country gain a leadership position as a qualified Canadian CDMO base for antibody-drug conjugates (ADCs), training the operators, processes, and supplier networks. This may give manufacturers a reason to maintain development and clinical work in the country.

For a deep dive on Pharmaceuticals, download the report.

Canada can participate in shaping the global AI and supercomputing economy while securing its own national security and digital sovereignty through investment in data centres. With its cool climate, available land, relatively low-cost energy, grid stability, and skilled construction workers, the country can also use data centres to support downstream capture of value through talent, IP, and AI adoption across the wider economy.

Behind the opportunity

  • Global data-centre demand—measured by the energy required—is expected to roughly triple by 2030, to 278 gigawatts from around 82 gigawatts, with AI accounting for about 70% of that growth.16 It’s estimated that the cumulative investment in facilities alone could exceed US$2.0 trillion to US$2.5 trillion through 2030, multiplying to US$8 trillion to US$10 trillion once compute and IT hardware is included.

  • Canada has several competitive advantages when it comes to becoming a preferred data-centre location. The country is cost-competitive, with low-cost power on a current grid that is relatively low-carbon (Exhibit 12), a cool climate, and grid stability. It also has available land, with the opportunity for some AI data centres (including those for training) to be built away from metropolitan areas, opening parts of Canada previously less suited to development.

    Exhibit 12 - Energy costs have emerged as a primary determinant of data centre colocation cost competitiveness
  • U.S. interconnection is congested, with a median wait of about five years from request to operation.17 Canada can compete by streamlining and standardizing grid connection and permitting and by offering data-centre-ready sites with secured power and pre-cleared permits, backed by a published and enforceable connection timeline.

  • As data centres grow, Canada could work with hyperscalers, other corporate partners, and developers to add new generation of all types (including gas and nuclear), structured so that large loads help protect existing ratepayers (for example, by funding their own grid connection and, in some cases, returning revenue to other customers). In this way, the country could also capture lasting value, such as IP, talent, and sovereignty, rather than only hosting others’ capacity.

For a deep dive on Data centres, download the report.

Canada does not need another competitiveness strategy. What’s required are actions to change the outcome of investment decisions so they increasingly favour Canada. We recommend doing three things well:

  1. Finishing the play: Turning good ideas and policy commitments into truly investable projects

  2. Energizing the system: Making a few bold moves that materially alter risk-adjusted returns

  3. Clearing the bottlenecks: Solving binding constraints in each targeted sector

Many of the challenges highlighted in our analyses of investment sectors have been on government agendas for decades—from the slow, uncertain pace of permitting to a lack of enabling infrastructure, sluggish productivity, and interprovincial barriers. Canada has been moving in the right direction, standing up new initiatives and enacting supportive legislation such as the Major Projects Office, Powering Canada Strong, the National Energy Corridor Agreement, and mutual recognition under the One Canadian Economy Act.

What these announcements and enacted legislation reinforce, though, is that execution, not diagnosis, is what is holding Canada back. Investors do not reposition capital on commitments but proof of change, and Canada needs visible wins it can point to.

Setting clear objectives with milestones and accountability is one potential approach. For example, the UK’s Infrastructure and Projects Authority (IPA) and National Infrastructure and Service Transformation Authority (NISTA) produced annual reports with KPIs, dashboards, and timelines for all major government projects.18

There is a finite window to attract the capital that is rapidly reallocating to future-shaping industries. Canada’s imperative is to swiftly reshape how investors evaluate the country, especially as peers are moving quickly themselves.

For example, the U.S. instituted an “Unleashing Prosperity Through Deregulation” executive order, part of which requires agencies to repeal ten existing rules, regulations, or guidance documents for any new one.19 This ten-to-one deregulation initiative expanded on the prior two-for-one initiative with similar logic. In addition, the U.S. has used multiple tools to incentivize investment, from the One Big Beautiful Bill Act restoring full expensing of domestic R&D to initiatives from prior administrations, including CHIPS20 (combining grants, finance, and a 25% manufacturing ITC) and the IRA21 paying production credits on scaled output.22

Canada can make adjustments to energize its investment climate while also improving risk-adjusted returns along the dimensions of time, cost, certainty and addressable market. While not exhaustive or prescriptive, some actions Canada could consider include the following:

  • Improving the country’s speed by compressing the time-to-build. Regulatory reform could be undertaken to streamline laws across all levels of government or establish precertified corridors and districts where land, baseline assessment, grid, and water are resolved once, not project by project.

  • Making Canada more predictable by reducing policy and regulatory risk for nation-building projects. Canada could freeze key rules at approval (such as environmental standards, carbon pricing, assessment, and consultation) so they remain in force for the life of a project, not only until the next policy cycle.

  • Incentivizing productive investment by providing an integrated (federal and provincial) package of fiscal, financial, and market incentives for priority sectors and designed for multiple investors at national scale, rather than bespoke negotiations. For example, Canada could provide refundable investment tax credits to support upfront project economics, crowd-in financing (such as loan guarantees and cofinancing), and in-kind support, including training and reserved site and grid capacity.

Investment decisions are made at the project level, and each sector has its own bottleneck that, if removed, has the potential to unlock significant additional investment.

Investors are most focused on speed. With power grids at or near capacity across Canada and globally, the binding constraint is new generation and grid connectivity at scale. To capture the opportunity, Canada must energize in years, not decades. This may require the use of near-term gas power generation paired with a concurrent streamlined connection process, smooth regulatory process, and local community compatibility.

While Canada’s competitiveness in traditional manufacturing relies on wage differentials and, often, subsidies, the country has skilled labour and process knowledge advantages for higher-value components and systems, including for specialized manufacturing in sectors such as pharmaceuticals and EVs. Shifting up the value chain requires shovel-ready sites (for example, pre-permitted with power in place), fiscal and financial support tied to outcomes (such as qualification, export volumes, and training), and a credible plan to redeploy and reskill workers to support the shift.

Ambiguity and changing rules around factors such as permitting, requirements for stakeholder engagement, and carbon pricing may discount otherwise attractive risk-adjusted return calculations. By setting clearer rules and committing to hold them stable over time, qualified projects may proceed on commercial terms, even if timelines are longer than other jurisdictions.

Many of Canada’s undeveloped mining projects sit in remote districts where the constraint is not geology but everything after discovery. The opportunity lies in making those districts shovel-ready through corridor-scale infrastructure, coordinated permits, grid, and road access. Shared access spreads cost and risk across a cohort of projects—infrastructure that no single mine could justify alone becomes viable at district scale, and investment decisions follow.

Capital locates where risk-adjusted returns are highest, and Canada has inputs many peers lack—from endowment, to talent and market access, to clean power. Yet the country has historically been underinvested in compared with its peers. By increasing Canada’s competitiveness and, in turn, capturing its fair share of investment, investment in Canada could increase by around $1 trillion over five years, adding an estimated $950 billion to GDP and potentially lifting average annual GDP growth by 2.3 percentage points to about 4% over the period—above the OECD average of 1.5%. This could add 1 million to 1.4 million direct jobs—up to around 2 million when including induced employment.23

Canada’s path to closing this gap is both highly ambitious and achievable and will require rapid, decisive action to turn policy commitments into investable projects, make bold moves that materially alter risk-adjusted returns, and solve binding constraints in critical sectors. It’s not too late. But Canada needs to make decisions that will define the role it plays in critical industries for the next half century—and shape the country’s presence on the international stage.

Our levelized cost methodology converts a project’s full life cycle economics into a single unit of cost. It can be interpreted as the unit price that would make a project’s net present value equal to zero over its entire life cycle, making that project viable, and is in line with the macroeconomic concept of long-run marginal costs.

We model capital expenditures and operating expenditures as time-phased cash flows, discount them using the local weighted average cost of capital, and divide by discounted lifetime output to calculate the levelized cost. The line items captured in the analysis include construction costs, equipment costs, labour costs—determined by wages as well as hourly productivity and hours worked—and operating costs such as materials, energy, and maintenance. The modeling includes additional case-specific inputs such as time to market and scale effects where relevant.

To understand how each driver influences levelized cost, we compare each region to the base case by replacing one factor at a time. For example, in our electric vehicle manufacturing case, we asked how the cost of building a vehicle in Canada would change if a Canadian plant paid Mexican wages. An interaction effect captures the fact that some drivers influence each other and do not add perfectly on their own (for example, a longer construction period matters more in a region with a higher weighted average cost of capital).

The case of an integrated electric vehicle plant illustrates how the levelized cost method works in practice. We analyze a representative plant spanning stamping, body, paint, and general assembly that produces 500,000 battery electric vehicles a year and use it as a benchmark for the levelized cost of one vehicle in dollars. We compare the cost of building the same vehicle in comparable plants in Canada, the United States, Mexico, China, and Japan, the world’s largest auto makers.

In industries where market prices are comparable across economies, levelized cost is a proxy for returns on investment. Because we cost every location on a delivered basis into the same destination market, differences in levelized cost translate directly into differences in margin—which is why a gap of a few hundred dollars a vehicle can be decisive in an industry with thin per-unit margins. Trade measures can outweigh production economics altogether, so we report tariffs separately from levelized cost.

Note: All figures in the investment case are expressed in 2024 dollars, converted from local currencies using 2024 market exchange rates. Our business cases are informed by McKinsey’s work on the five industries, which provides our understanding of how much capital, labour, energy, materials, and other inputs are typically needed to produce a product—here, a battery electric vehicle—and how long the process typically takes. We price these inputs at the typical costs in a geography, also drawing on the proprietary databases maintained by MGI’s Economics Research team, and typical weighted average cost of capital, drawing on McKinsey’s Value Intelligence platform, a curated global database of corporate financials. Levelized costs are presented before taxes and direct subsidies; tariffs are reported separately.

Given Canada’s historical underinvestment and its generational opportunity, we outlined what Canada’s potential could be in quantitative terms. This analysis estimates the share of global investment Canada could attract with improved investment competitiveness and how that investment converts that into GDP and employment gains over five years. It covers the report’s five core industries, their downstream industries, and induced effects across the rest of the economy.

We conduct the analysis by estimating Canada’s investment potential compared with its existing position versus other mature peer economies. We normalize Canada’s position, using a “location quotient,” which compares the share of global investment in an industry that lands in Canada with Canada’s share of global investment overall. A value of 1 denotes that Canada’s economic share is in line with other economies; below 1, Canada is underweight; above 1, it attracts more than its share in an industry compared with other economies. 

The benchmark assumes Canada reaches the top 40% of OECD economies with broadly similar endowments in each industry. In machinery and equipment, this lifts Canada from a location quotient of about 0.1 to about 0.7, roughly where Switzerland stands today; in data centres, proxied by IT and information services, from about 0.8 to about 1.3, roughly the United Kingdom; in pharmaceuticals, from about 0.3 to about 0.6, comparable to Italy; and in basic metals, from about 0.3 to about 0.6, comparable to Sweden. Where Canada already exceeds the benchmark (for example, oil and gas extraction), its position is held rather at that level. This becomes our investment ambition.

The investment Canada can mobilize is broken down in three components. The first is the capital spending already in Canada’s baseline forecast for these industries. The second is the incremental spending needed to close the location quotient gap, calculated year by year from 2026 as the difference between the benchmark ambition level and the baseline. The third is the investment suppliers make to serve that additional demand, derived from Canada’s own industry linkages. Both foreign-direct and domestic investment are included. The final sum of the three components is $962Bn, mobilized over a five-year window.

We then convert that investment into GDP in three steps. Investment accumulates into a capital stock, which depreciates at 7% a year, so only capital still in service contributes to output. That surviving stock is multiplied by an industry-specific ratio of capital to output, estimated from investment and value added over 2010–25. Supplier and wider-economy effects are then added using the Leontief inverse of Canada’s input–output table, which gives the output every other sector must produce to support a dollar of demand in each priority industry. To reflect higher productivity of new capital we use a 15-year estimation window to derive the investment to GDP ratio instead of the full historical timeframe. The result is that new investment is 1.3 times as productive in transforming into GDP as the average existing dollar.

The resulting investment is expected to generate about two million jobs. Job creation is estimated industry by industry over the same period, applying an output-to-employment ratio. This multiplier is consistent with genuinely new productive investment, since new facilities carry more capital per worker and need fewer people for the same output compared with older, depreciated facilities. New capacity is also modeled at a higher rate of automation adoption than the existing footprint, reflecting the technology it arrives with.

To fill the labor gap generated by this investment, Canada will need to fill roles through a combination of falling unemployment, higher labor-force participation within its historical range, and a reduction in underemployment. Additionally, an increase in net immigration would also benefit the balance.

Industry investment and value added are drawn from the S&P Global Market Intelligence data set, with peer positions measured over 2019–25. Supplier and wider-economy linkages use the OECD input–output table for Canada (2022) and OECD Trade in Employment data for the same year. Labor market figures come from the Statistics Canada Labour Force Survey through July 2026, with historical ranges for unemployment and participation taken from the annual series since 1976 underemployment from the 2025 part-time employment by reason series.

FDI is often interpreted as a metric of global investment competitiveness, a signal where investors believe the best risk-adjusted returns are to be found. While true, headline FDI can conceal more than it reveals. For starters, FDI includes cross-border M&A activity—the redistribution of ownership claims—which, on its own, does not lead to capacity expansion or productivity growth. Foreign capital that buys an existing Canadian mine is materially different than foreign capital that builds a new mine. The scale of that difference, in Canada’s case, is larger than headline figures may suggest. Over the past decade, M&A activity made up about 30% of inward FDI into Canada and about 40% of outward FDI.24

FDI is a means to a higher and more lucrative end. The real prize is greenfield capital expenditure—that’s new infrastructure, plant, equipment, software, IP, and R&D—financial flows that are converted into capacity expansion, theoretical and applied knowledge, supply chain deepening, and productivity enhancements. Countries that equip their workforce with more and better machinery, equipment, and software are more productive and dynamic, all things considered.

Download the Report

1 UN Trade and Development FDI trends data.

2 UN Trade and Development.

3 fDi Markets.

4 fDi Markets.

5 There is one place where this pattern runs in reverse: Canada has been a net importer of R&D investment. Since 2005, R&D-designated capital flowing into Canada—roughly $65 billion, 13% of everything inbound—has significantly outweighed R&D capital leaving the country. Outbound R&D investment totals $10 billion, or 2% of the outbound total. Whatever else is true about Canadian capital heading for the exits, the country’s role as a place where research gets funded has not eroded; fDi Markets.

6 Mark Cameron and Arash Golshan, “Refuel,” Public Policy Forum, December 8, 2025.

7 Conference Board of Canada, 2020; Government of British Columbia.

8 “Why Canada is on the brink of LNG-driven prosperity,” Resource Works, April 24, 2025.

9 Public Policy Forum; Canadian Energy Centre; Oxford Institute for Energy Studies.

10 “Addressing Canada’s productivity gap: A journey towards global leadership,” McKinsey, November 3, 2025.

11 “Minerals and the economy,” Natural Resources Canada, updated on February 27, 2026.

12 “From discovery to delay: Mine permitting stretches project timelines,” S&P Global, July 8, 2026.

13 Levelleing the playing field, The Mining Associate of Canada, May 5, 2015.

14 Global Materials Perspective 2025, McKinsey, October 2025.

15 “Does Canada own its life sciences future?,” adMare Institute, July 2025.

16 Analysis of Maria Goodpaster, Piotr Pikul, Anna Kortis, and Olivier Bus, “Colocation data centers: The infrastructure race behind AI,” McKinsey Global Institute, June 30, 2026.

17 Queued up: 2026 edition—characteristics of power plants seeking transmission interconnection as of the end of 2025, Berkeley Lab, June 2026.

18 “Annual report 2025/2026,” National Infrastructure & Service Transformation Authority, July 2026.

19 “Unleashing Prosperity through Deregulation,” White House, January 31, 2025.

20 CHIPS refers to the Creating Helpful Incentives to Produce Semiconductors (CHIPS) for America provisions of the CHIPS and Science Act of 2022, which provided federal incentives to support semiconductor manufacturing and research in the United States.

21 IRA refers to the Inflation Reduction Act of 2022, which included tax incentives to support domestic clean-energy manufacturing and investment.

22 “One Big Beautiful Bill Act tax policies: Details and analysis,” Tax Foundation, February 10, 2026; “U.S. Department of the Treasury releases final rules to strengthen U.S. semiconductor industry,” U.S. Department of the Treasury, October 22, 2024; “The Section 45X Advanced Manufacturing Production Credit,” U.S. Congress, August 13, 2026.

23 “McKinsey Global Institute analysis.

24 Data extracted and processed from “Balance of international payments, flows of Canadian direct investment abroad and foreign direct investment in Canada, quarterly (x 1,000,000),” Statistic Canada, August 27, 2026.

This article is intended as general information only and is not to be relied upon as constituting legal, financial or other professional advice. The reader is solely liable for any use of the information contained in this document and Royal Bank of Canada (“RBC”) nor any of its affiliates nor any of their respective directors, officers, employees or agents shall be held responsible for any direct or indirect damages arising from the use of this document by the reader. A professional advisor should be consulted regarding your specific situation. Information presented is believed to be factual and up-to-date but we do not guarantee its accuracy and it should not be regarded as a complete analysis of the subjects discussed. All expressions of opinion reflect the judgment of the authors as of the date of publication and are subject to change. No endorsement of any third parties or their advice, opinions, information, products or services is expressly given or implied by Royal Bank of Canada or any of its affiliates. This document may contain forward-looking statements within the meaning of certain securities laws, which are subject to RBC’s caution regarding forward-looking statements. ESG (including climate) metrics, data and other information contained on this website are or may be based on assumptions, estimates and judgements. For cautionary statements relating to the information on this website, refer to the “Caution regarding forward-looking statements” and the “Important notice regarding this document” sections in our latest climate report or sustainability report, available at: https://www.rbc.com/our-impact/sustainability-reporting/index.html. Except as required by law, none of RBC nor any of its affiliates undertake to update any information in this document.

Important Notice Regarding Information on this Website and Caution Regarding Forward-Looking Statements

The information on this website is intended as general information only and does not constitute an offer or a solicitation to buy or sell any security, product or service in any jurisdiction; nor is it intended to provide investment, financial, legal, accounting, tax or other advice, and such information should not to be relied or acted upon for providing such advice. Nothing herein shall form the basis of or be relied upon in connection with any contract, commitment, or investment decision whatsoever. The reader is solely liable for any use of the information contained herein, and neither Royal Bank of Canada (“RBC”, “we”, “our” and “us”) and its subsidiaries nor any of RBC’s affiliates nor any of their respective directors, officers, employees or agents shall be held responsible for any direct or indirect damage arising from the use of any information contained herein by the reader.

From time to time, we make written or oral forward-looking statements within the meaning of certain securities laws, including on this website, in filings with Canadian securities regulators or the U.S. Securities and Exchange Commission, and in other communications. Such statements are subject to our caution regarding forward-looking statements. Forward-looking statements on our website include, but are not limited to, statements relating to our economic and sustainability related objectives, vision, commitments, goals and targets as well as potential events and actions. By their very nature, forward-looking statements require us to make assumptions and are subject to inherent risks and uncertainties, which give rise to the possibility that our predictions, expectations or conclusions will not prove to be accurate, that our assumptions may not be correct, and that our objectives, vision, commitments, goals and targets will not be achieved. We caution readers not to place undue reliance on these statements as a number of risk factors – many of which are beyond our control and the effects of which can be difficult to predict – could cause our actual results to differ materially from the expectations expressed in such forward-looking statements. ESG (including climate) metrics, data and other information contained on this website are or may be based on assumptions, estimates and judgements. For cautionary statements relating to the information on this website, refer to the “Caution regarding forward-looking statements” and the “Important notice regarding this report” sections in our latest sustainability report, available at: https://www.rbc.com/our-impact/sustainability-reporting/index.html.

Except as required by law, none of RBC nor any of its affiliates undertake to update any information on this website.

All expressions of opinion on this website reflect the judgment of the authors as of the date of publication and are subject to change. We do not guarantee the accuracy of the information or expressions of opinion presented herein and they should not be regarded as a complete analysis of the subjects discussed. No endorsement of any third parties or their advice, opinions, information, products or services is expressly given or implied by RBC or any of its affiliates.

All references to websites are for your information only. The content of any websites referred to on this website, including via website link, and any other websites they refer to are not incorporated by reference in, and do not form part of, this website.  This website is also not intended to make representations as to sustainability-related initiatives of any third parties, whether named herein or otherwise, which may involve information and events that are beyond our control.