Even as the world reels from tariffs, there’s a new levy lurking on international borders: a carbon duty on imports.
The EU rolled out its Carbon Border Adjustment Mechanism (CBAM) in 2023; Mark Carney’s government is considering a Border Carbon Adjustments (BCA) to level the playing field for domestic energy and heavy industry against foreign competitors; and a handful of bills in the U.S. at the federal and state level are proposing fees on imports with weaker climate compliance.
The idea of a border carbon fee is simple: ensure that manufacturers from, say, Montreal or Berlin, that spend money and effort to adhere to their domestic robust carbon policies are not disadvantaged against competitors that benefit from weak climate policies in their jurisdictions. Combined, a domestic carbon policy and a border carbon fee is a one-two punch that forces foreign competitors to raise their environmental standards, and ensures domestic industries are not unduly penalized for pursuing decarbonization strategies. Think of Ottawa taxing coal-powered Chinese steel to ensure its not unfairly advantaged against Canadian steel that’s forged by low-carbon but highly capital-intensive electric furnaces.
While a border carbon fee would be a natural extension to Canada’s industrial carbon policy, its implementation is tricky. For starters, it could further inflame Ottawa’s already tense relationship with the Trump administration, which has cracked down on climate policies.
Canada’s carbon policy is in a state of flux, too. Earlier this year, the federal government scrapped a fuel charge—widely known as a carbon tax, followed soon after by British Columbia that had one of the longest and most stable emissions pricing systems globally. The past year has seen Canadian policymakers wobble on industrial carbon pricing: commitment to carbon pricing in Quebec and British Columbia all the while Alberta froze its carbon price at $95/tCO2e earlier in the year, and Saskatchewan cancelled its industrial carbon pricing system.
Canada’s industrial carbon policy has had mixed success to date—it has helped fund renewable energy projects, but with limited direct impact on emissions reduction to date. As the federal government and some provincial jurisdictions look to adjust their industrial carbon pricing strategy, they will also need to factor in shifting trading patterns, changing global economic priorities and the competitiveness of Canada’s industries.
Carbon pricing crosses the border
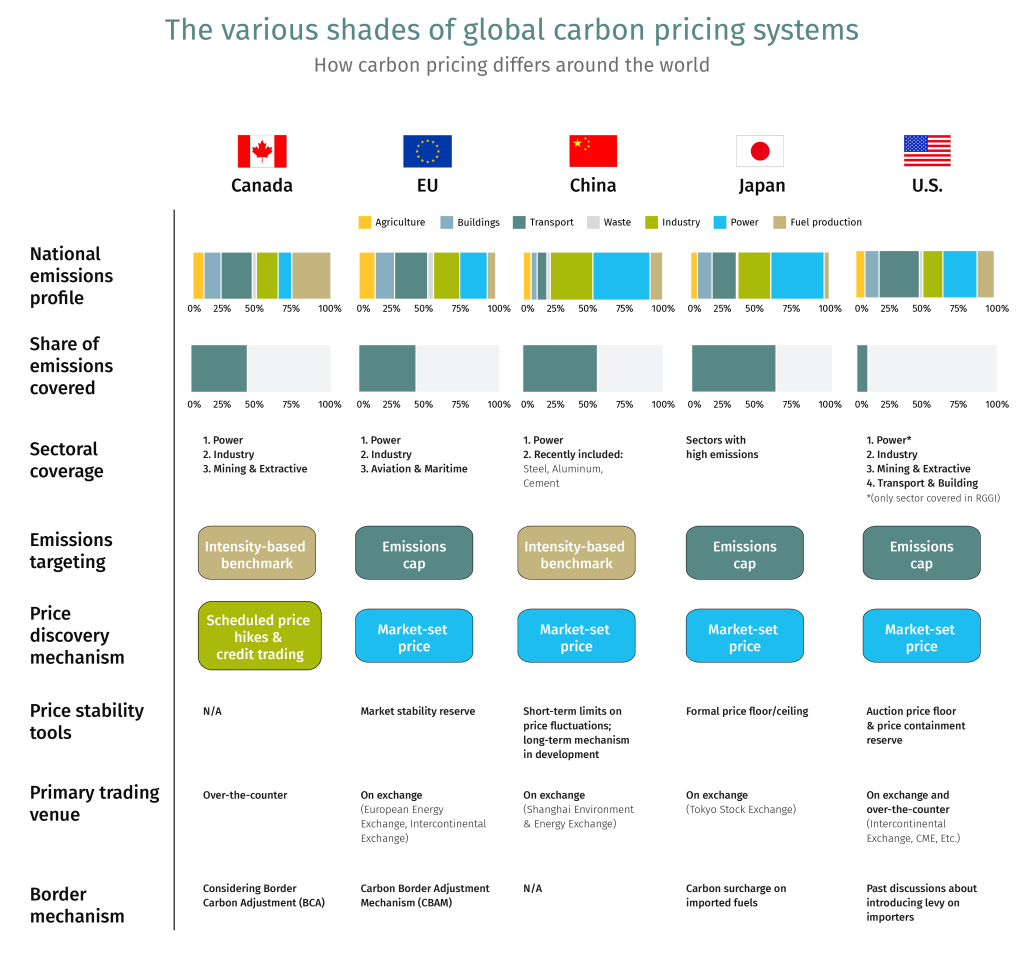
Canada is one of 40-plus countries that have deployed a version of carbon pricing, covering 28% of global emissions.1 Several are now also exploring or advancing domestic carbon pricing systems in response to the European Union’s CBAM:
Emerging markets such as India, Türkiye and Brazil are pursuing domestic carbon pricing mechanisms to ensure their exports comply with EU rules.
The U.K. is in the process of linking its carbon market to the EU to streamline its climate policy with the economic bloc.
China recently expanded its carbon pricing coverage to include cement, steel and aluminum sector emissions.
Japan is consolidating its carbon pricing regimes into a single market as part of its Green Transformation (GX) plan, starting early 2026.
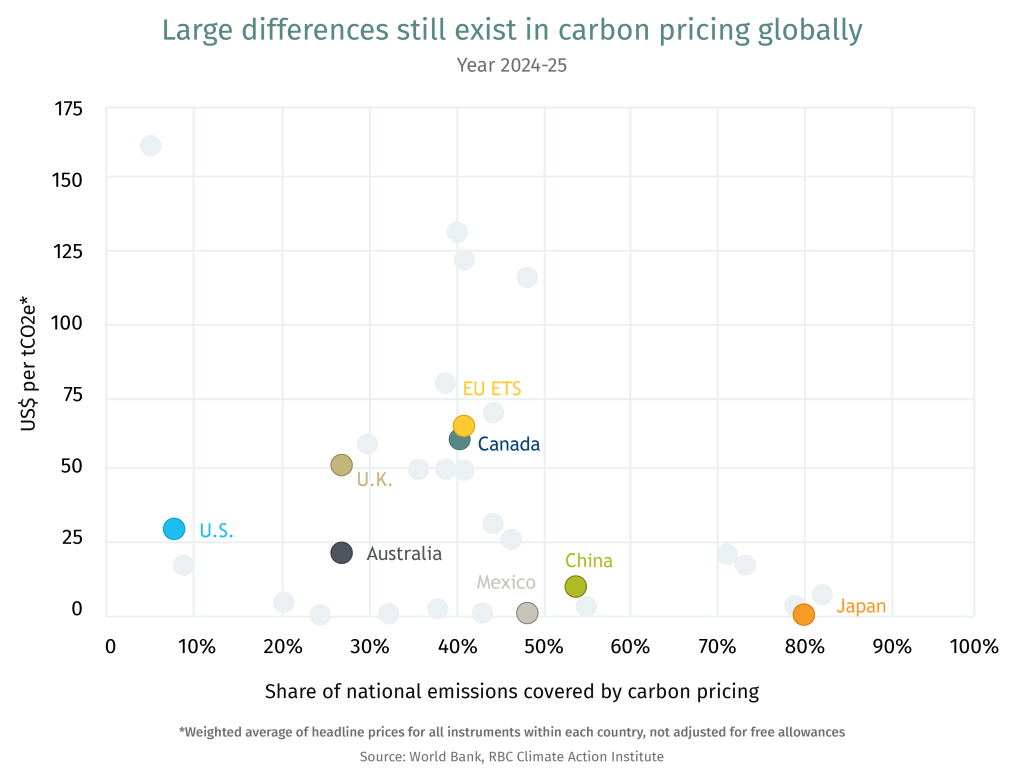
Still, pricing of carbon remains varied. Emissions trading schemes (ETS)—the most common carbon pricing system—rely on market signals to determine the pathway for emissions reduction. As the chart below shows, different jurisdictions assess their sectoral emission profiles, emission reduction potential and costs, that has led to significant differences in how they price carbon.
The U.S.’s Border Carbon Policy Proposals
The Foreign Pollution Fee Act (of 2025) is making its way through the U.S. Senate. It’s a policy designed to impose hefty levies on carbon-intensive imports from primarily China and Russia. But Canada could also get caught in the crossfire, and potentially face carbon tariffs ranging between 17%-33% on its industrial exports to the U.S.2
American policymakers have also been looking to shield domestic industries through a slew of other carbon policy proposals. These include:
The FAIR Transition and Competition Act aimed at ensuring American businesses are not undercut by unregulated importers by imposing a border carbon adjustment on carbon-intensive imports.
A U.S. Clean Competition Act would establish US$55 per tonne carbon tax on domestic producers and protect them from imports through border adjustments.
PROVE IT Act, if enacted, will facilitate the collection of emissions intensity data for energy intensive industries across major trading partners to ensure global transparency on carbon emissions. It was considered a precursor to the Foreign Pollution Fee Act.
The Foreign Pollution Fee Act, reintroduced on April 8, 2025, by Republican Senators Bill Cassidy and Lindsey Graham, seems most advanced. The structure avoids domestic carbon tax, and creates a linear relationship between the levy on importers and their emissions intensity gap. While the bill is unlikely to proceed, it’s seen as another form of protectionism under the guise of climate change policies.
Canada’s carbon pricing patchwork
Alberta and Quebec kicked off Canda’s carbon pricing journey in 2007, pursuing two different ways to apply carbon levies on their large industrial emitters. Now, a patchwork of federal and provincial carbon pricing regimes in Canada apply to a range of sectors including power, industry, mining and extraction, and covering nearly half of the country’s total emissions.
With some exceptions, the emissions trading system is Canada’s preferred carbon pricing mechanism. This is how it works: a greenhouse gas emissions performance benchmark places allowance limits on a company’s emissions. Companies emitting beyond those benchmarks buy permits from other companies with emissions that are under the prescribed level. The policy is designed to incentivize investments in low-carbon technologies that would help sharpen Canada’s competitive edge.
The system has encouraged capital to flow to sustainable projects: More than $80 billion worth of projects in carbon capture, utilization and storage (CCUS), wind, solar and bioenergy were either shovel-ready or under consideration and poised to benefit from carbon credit revenues, according to the Major Projects Inventory in 2024.3 Similarly, Emissions Reduction Alberta, funded through the province’s industrial carbon pricing, has facilitated over 300 clean technology projects, valued at more than $10 billion.4
Setting performance benchmarks means not all emissions are subject to carbon pricing, only those beyond the allowance limit—by design. Average cost in Canada, when adjusted for free pollution allowances, stood at $10 per tonnes of carbon dioxide equivalent (tCO2e) in 2024, a fraction of the $80 headline carbon price, according to latest estimate by the Canadian Climate Institute.5 This helps limit carbon leakage (i.e., manufacturers moving to jurisdictions with lower compliance).
Impact on emissions reduction
Carbon pricing reduces emissions with limited or no impact on the economy, according to several studies. But the scale of emissions reduction remains relatively small, with up to 2% annual GHG reduction on average across a range of countries with carbon pricing, including Canada.6 Emissions will need to climb down 6% annually for Canada to reach its climate goals by 2030, as set out in its Nationally Determined Contribution (NDC) commitment to the United Nations.
But there’s a reason the impact on emissions has been muted over the past two decades: Carbon prices were kept low as most clean technologies were nascent with high costs and in early-adoption stage. That’s slowly changing, with solar and wind becoming competitive with fossil fuels, and electric vehicles poised for price parity with conventionally-powered cars; in places like China, EVs are cheaper than gas-powered vehicles. Meanwhile, carbon-capture capacity has doubled globally over the past 10 years.
What’s at stake?
Major discrepancies in carbon pricing with its trading partners can impact Canada’s competitiveness at a time of a structural global upheaval.
Overall, about a fifth of Canada’s imports and exports are from jurisdictions that don’t price carbon. In the U.S.—where policy vary by state—the average carbon price is only US$6 per tonne when adjusted for Canada-U.S. trade flows at the state level.
Here’s what Canada should watch for as its looks to maintain its global competitiveness amid fragmented trade and climate policies:
Diversify trade partners: This won’t be an easy task with 75% of goods destined for the U.S. But nearly a third of Canadian export categories are more diversified; even oil and gas exports are finding new customers in Asia since the expansion of the TMX pipeline and the start of LNG Canada. Beyond the U.S., the global rise of climate-compliant products could give Canada an edge. For instance, Japan’s evolving carbon pricing policy favours cleaner fuel sources.
Foster predictable policy: Access to capital was the top challenge businesses faced in their emissions reduction goals, as noted in our Climate Action Report 2025. Large-scale investments to advance low-carbon technologies require strong and stable price signals to lower risk and allow capital to flow. Policy certainty could help pave the way for capital to be directed towards Canada.
Streamline provincial systems: Reducing barriers and inefficiencies could help de-risk the investment environment. Businesses operating in multiple jurisdictions face different rules, varying price levels and limited or no ability to transfer credits between their facilities. We have previously emphasized that harmonizing fragmented markets could offer considerable economic upside. Removing interprovincial trade barriers could offer greater market access and liquidity.
Beware the wrath of the U.S.: Reconciling carbon policy differences with the U.S.— where less than a tenth of total emissions are priced and at a much lower rate—is eventually required. With 80% of Canada’s oil production, 90% of aluminum, about half of steel and a third of cement shipped to the U.S., Ottawa needs to be mindful of how the U.S. reacts to changes to our policies. For some industries like the oilsands, compliance with emissions obligations costs about $1 per barrel, and less than 50 cents when using carbon offsets. This limits the competitiveness concerns. However, other industries already under tariff pressure and commanding much lower profit margins might require more support.
U.S. trade irritants cut both ways: Extending carbon pricing to imports through BCA is effectively a tariff. With Canada already at odds with its biggest trading partner, any attempt to level the playing field with American companies might be viewed as a trade escalation.
Resolve administrative complexity: From reporting to verifying, BCA is a daunting administrative task. Especially with varying provincial prices, coverage and benchmarks. It’s another reason to pursue harmonization as we wrote previously. The EU excluded SMEs and individual importers from CBAM to avoid regulatory complexity and reduce their costs. Canada should also strive for simplicity of rules.
Beware of unintended consequences: Emissions-intensive trade-exposed (EITE) sectors account for only 5% of Canadian GDP. However, those materials feed into an array of downstream industries. In effect, BCA could cascade through the supply chains. Raising costs for imported steel, for example, while protecting domestic manufacturing may raise costs for automakers, and construction companies, among others, as estimated by the Bank of Canada.7
Canada’s $30-billion supply management system has underpinned national food sovereignty and security for more than 50 years. Covering dairy, chicken, turkey and eggs, the system has ensured price and supply stability for food staples.
The system recognizes that producing food is costly. The arrangement fosters supply-chain stability, however, it could lead to higher consumer prices, especially amid rising input costs.
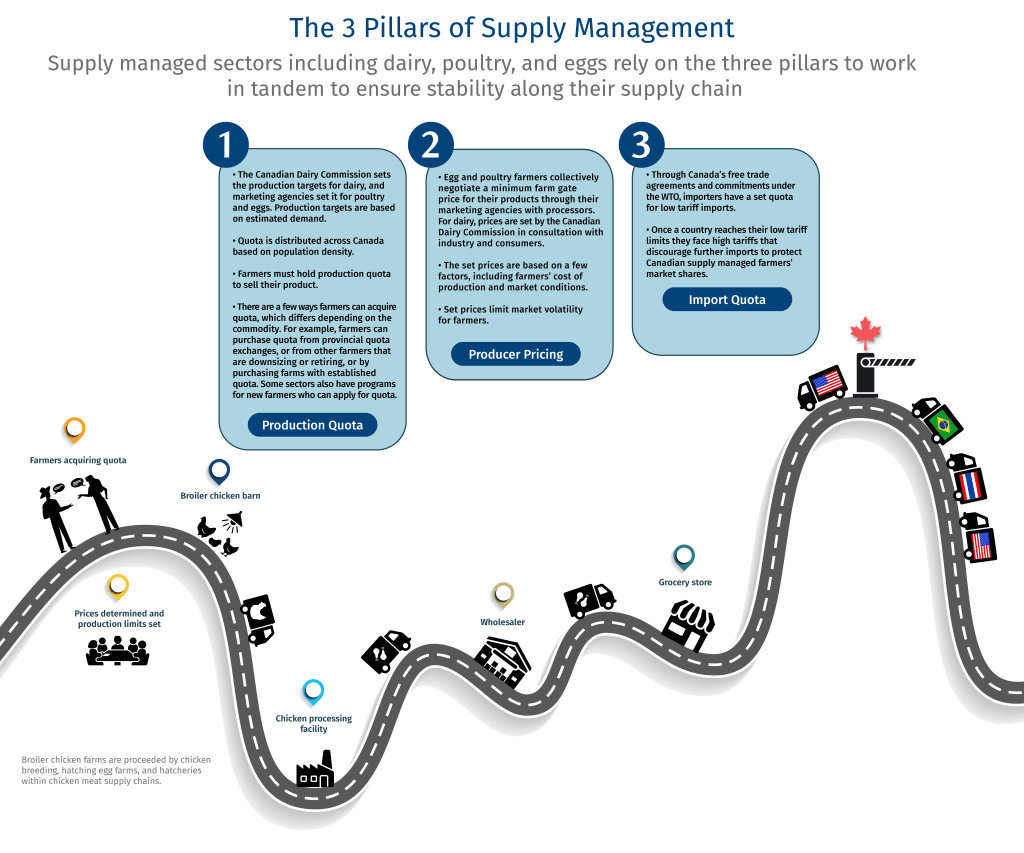
Supply management’s three foundational pillars are under attack—again. Production quotas, set pricing, and import quotas ensure the system’s integrity. But all three are facing calls for reform within Canada and from its biggest trading partners, including the United States (U.S.).
A new law limits Ottawa’s ability to open up the sector. The system’s advocates say Bill C-202 prioritizes national food security and restricts the Foreign Affairs Minister from making new concessions in any trade deal. Other experts say it could hurt Canada’s position in trade negotiations, including the impending Canada-U.S.-Mexico Agreement (CUSMA) review next year.
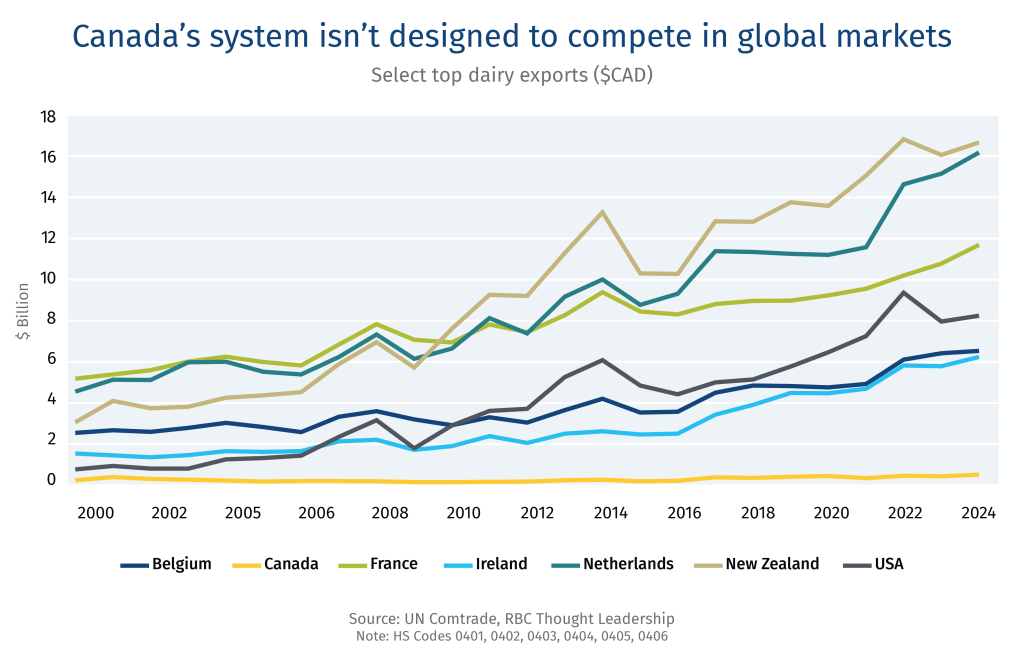
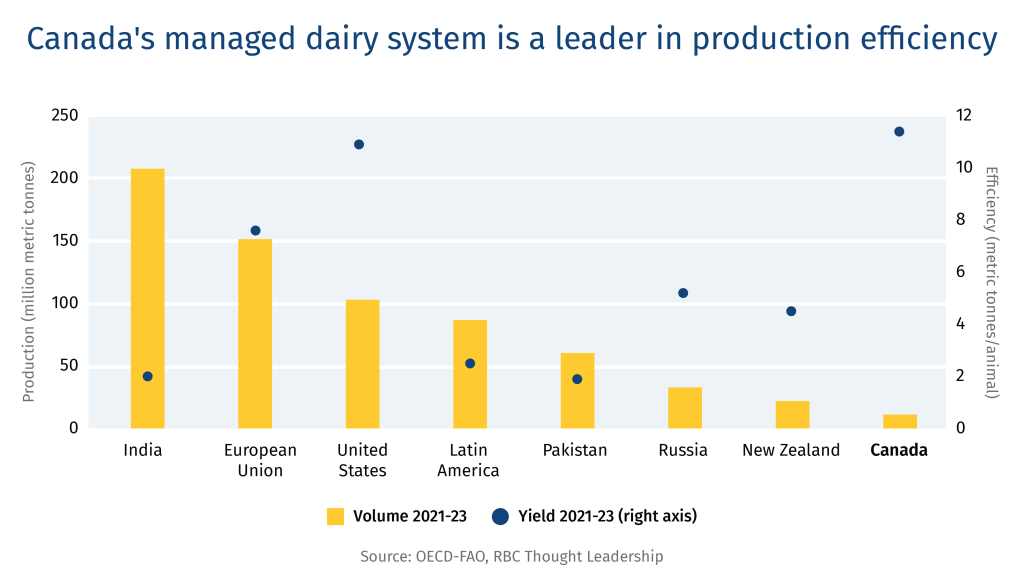
Trade deals are chipping away at Canadian producers’ dominance. Yet, expanded global market access for Canadian supply managed farmers may run counter to the system’s design. A small production base tailored to domestic consumption makes them ill-equipped to compete as exporters in global markets, where high volume and competitive pricing are crucial.
Canada is not alone in facing tough policy choices on agriculture. New Zealand agriculture is grappling with its outsized greenhouse gas footprint, while the United Kingdom is finding its feet post-Brexit. Brazil, second only to the U.S. in total agri-food export value, is eyeing greater global market share. Canada could draw some lessons from these international shifts as it evolves its domestic food sector.
Shifting trade policy landscape for supply managed industries
Canada’s supply management has caught the eye of the Trump administration, again, which has identified it as a major irritant as the two countries renegotiate their trade deal.
That has led to a new debate about Canada’s supply managed food industries, including dairy, chicken, turkey and eggs, that has been a staple of Canadian policy since the 1970s.
At its core, the system provides a stable price that fairly compensates farmers for producing high-quality food. The system’s advocates say it boosts food security, supports domestic producers, and ensures consistency of quality and supply for consumers, while critics say it stifles innovation, inflates prices and limits competition.
The system has come under scrutiny in nearly every trade negotiation and economic downturn, and will likely be a discussion item at the impending Canada-U.S.-Mexico-Agreement (CUSMA) review next year. It’s also being debated amid a domestic push to develop a unified market for goods and services. The conversations are evolving from polarizing calls between dismantling the system and business-as-usual, to a wider spectrum of ideas on reforming the system that’s been around for more than half a century.
Those looking to preserve the system are on the move. In June, Bill C-202 received Royal Assent with strong support from Canada’s supply-managed farmer associations. The Act instructs the foreign affairs minister to stop opening more dairy, poultry or egg quota to trading partners through international trade agreements. Still, the debate continues as stakeholders carve out specific areas for discussion, from the regional milk pooling systems to debating which part of the supply chain should get access to the foreign quota allotment.
The debate is not just bouncing off agriculture’s silo walls. It impacts many aspects of the Canadian economy, including food prices, choices, supply-chain jobs, and Canada’s trade diversification and growth prospects.
What’s at stake?
Supply management in numbers:
1%. The managed sectors’ contribution to Canada’s GDP, amounting to more than $30-billion. The entire agriculture and agri-food sector accounts for more than 7% of Canada’s GDP.12
339,000. The number of full-time jobs in supply managed industries, from farm to processor to distribution.3
14,699. The number of supply managed farms in Canada, or 8% of nearly 190,000 farms across the country.4
9,430. The number of dairy farms, primarily in Quebec and Ontario. Dairy farm numbers across Canada are down by more than 50% since the early 2000s, due to market consolidation.5
7%. The growth in the number of poultry and egg farms over the past two decades. They are largely concentrated in Ontario, British Columbia, and Quebec, with Prairie provinces also seeing an uptick.6
The 3S of supply management
The Canadian system is designed to uphold food sovereignty, stability and standards, which helps the industry prosper, but also presents challenges in a changing global food market.
Sovereignty
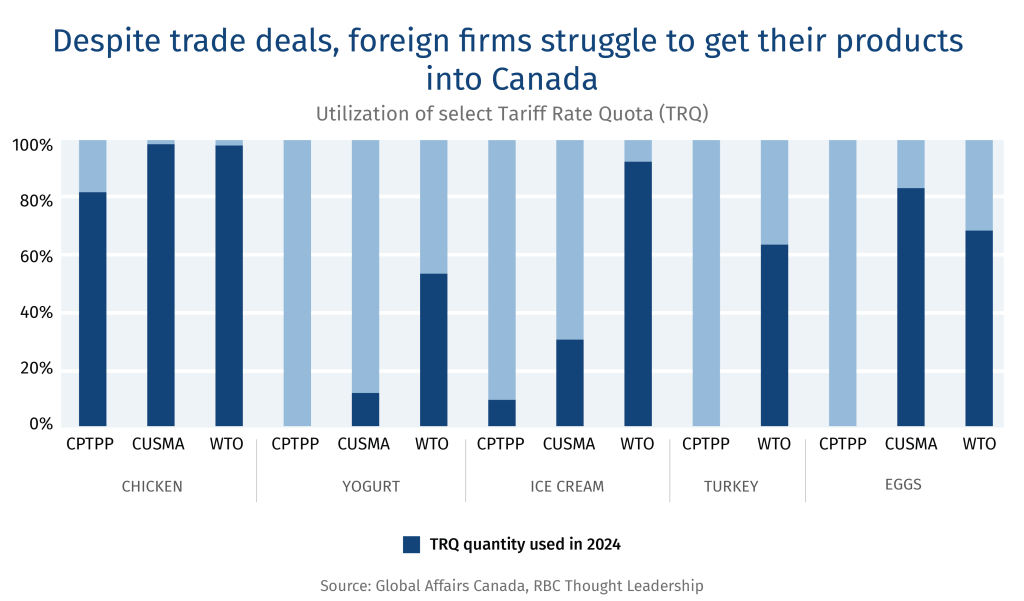
Supply management ensures stable prices and a robust domestic supply chain to meet demand. But as Canadian processors hold the majority of the tariff rate quota (TRQ), which is a set amount of low tariff imports, foreign importers have argued that they have limited access to Canada’s markets to fulfill their non-tariffed trade volumes negotiated in the agreement.
Supply management has emerged as a point of friction with Canada’s largest trading partners, especially the U.S., the European Union (E.U.), and, more recently, New Zealand. A key sticking point: Canada’s restrictions on import quotas.
The quotas are intended to limit imports within Canada’s supply management industries. In recent trade negotiations, however, Canada has made greater concessions, for example, in the Comprehensive and Progressive Agreement for Trans-Pacific Partnership (CPTPP) negotiations Canada agreed to provide participating countries, with an estimated 3.25% of Canada’s domestic dairy market.7 But as Canadian processors hold the majority of tariff import quotas, foreign importers have argued that they have limited access to Canada’s markets to fulfill their non-tariffed trade volumes negotiated in the agreement.
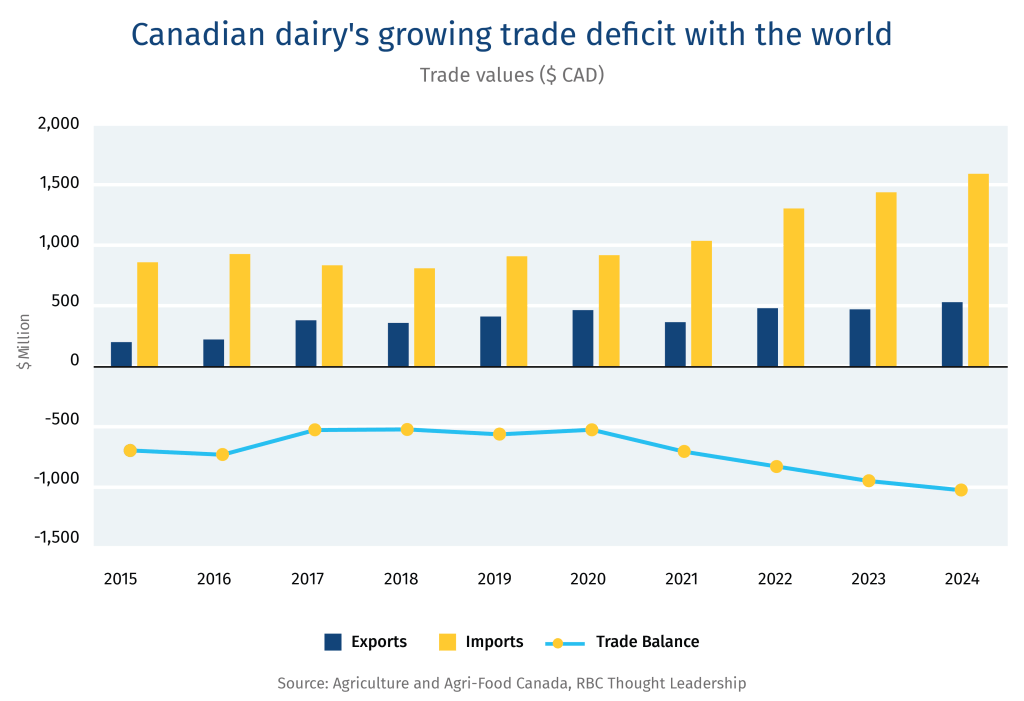
Trade deals are chipping away at domestic producers’ dominance: Trade concessions have resulted in Canada running a small trade deficit on all supply managed products, except chicken meat. For example, imports now represent roughly 4% of Canada’s dairy market.8 This has led to government payouts to dairy, poultry, and egg farmers and processors of $4.8 billion to compensate the industry’s forgone profits from foreign competition.9 Such payouts means Canadians are paying for their supply managed food at the cash register—and additionally through taxes.
Between 1995 and 2017 foreign access to Canada’s dairy TRQ was limited to commitments under the World Trade Organization (WTO). As CUSMA, the Canada-European Union Comprehensive Economic and Trade Agreement (CETA) and CPTPP are phased in over the next ten years, Canadian foreign market access is expected to climb to roughly 10% of Canada’s dairy production.10 In return, Canada has expanded market access for dairy, poultry and eggs in these markets. Canada has a small production base with supply-chain logistics and relationships designed for domestic markets, which makes Canadian supply managed industries ill-equipped to be leaders in global markets where high volumes at competitive prices are critical for success.
Domestic supply chains are helping shield Canadians from trade wars: In times of global disruption, the domestic food supply chain has served Canadians well. Take the made-in-Canada movement that was kickstarted by U.S. President Donald Trump’s trade war. It drove down sales of American brands, with Canadians swapping them with domestic products, wherever possible. For dairy, poultry, and eggs, Canadians can remain especially confident they have immediate access to Canada-based supply chains.
Eliminating loopholes
Processed products such as prepared meals can blur the lines of which food products are traded under which HS code, which categorize the trade of goods and services.
These blurred lines have allowed importers to move products into Canada tariff-free, taking advantage of loopholes that sidestep Canada’s TRQ system, which sets the volume allotted to importers under free trade agreements, including CUSMA, CETA and CPTPP.
Some of these loopholes have been closed, such as cheese being imported tariff-free when it was classified as part of a prepared meal like pizza-making kits for restaurants, which fell outside of TRQ allotments. Other loopholes have yet to be closed such as spent fowl (i.e., old laying hens) which can be used as a category to trade misrepresented broiler chicken raised for meat consumption, to avoid paying Canadian duties.
While importers have TRQ allotments for dairy, egg and poultry products, this low-tariff pathway to Canada is often underutilized as Canadian processors control the majority of TRQs as well as earmarked space in grocery store shelves.
This underutilization of TRQs has been a mounting irritant between Canada and its trading partners, most notably by the Americans who say Canada has not “respected the spirit” of CUSMA, and made it challenging for their producers to access Canada’s market.
Stability
Supply management is synonymous with stability. But, at what cost and for whom? With global market disruptions on the rise, it’s critical to determine a pathway that benefits both Canadian farmers and consumers.
Canada-based food supply chains have distinguished themselves during the pandemic and other crises, such as the recent avian influenza outbreak that’s ravaged the U.S. industry.
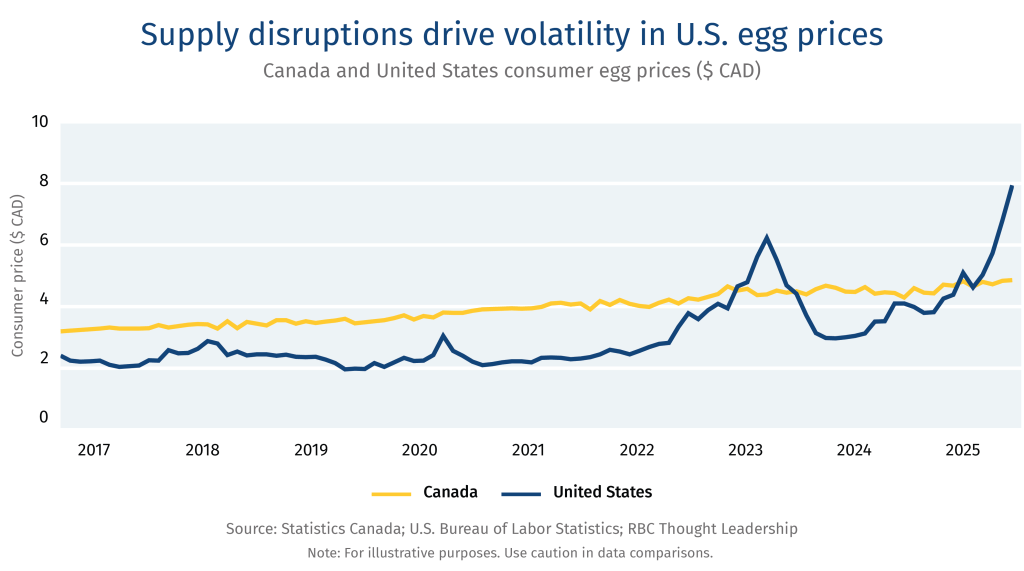
Indeed, egg prices in the U.S. have skyrocketed over the past year as the flu takes its toll on animal production, with 174 million confirmed poultry cases, and more than 1,074 dairy cow herds impacted in the U.S. by July 2025.11
The impact has been far less severe in Canada, with roughly 14 million birds infected and no reported cases among dairy herds.12 Canada’s poultry, egg and dairy farms have also been more resilient because of the industry’s standards in biosecurity and animal welfare. Smaller scale production that’s more dispersed compared to U.S. farms (aside from production-dense areas such as the Fraser Valley in British Columbia) has also helped. These on-farm factors have knock-on effects for stability in consumer pricing and product availability. On average, between 2017 and 2025, a dozen eggs sold in Canada was $1 more than in the U.S. However, that had flipped by February 2025 when a dozen eggs in the U.S. cost $3.52 dollars more than in Canada.1314
Supply chain and market disruptions are anticipated to intensify from several issues, including a global movement away from rules-based trade and climate change triggering extreme weather events and spreading disease and pest outbreaks. It’s an important consideration for policymakers as frequent volatility impacts commodity market prices.
Producing food is a costly affair. Fixed quota and price in supply managed sectors generate certainty for farmers, which fosters stability in the supply chain. However, this stability comes with its own cost as it inherently leads to more expensive products as the cost of inputs rise in Canada. Worsening affordability disproportionally impacts food insecurity in low-income families; however significant price volatility is disruptive to average household spending, too.1516
In contrast, non-supply managed farmers growing wheat and raising beef cattle, for example, are exposed to commodity markets, resulting in farmers’ profit margins and consumer prices fluctuating as markets shift. Non-supply managed farmers are often price receivers and cannot pass rising costs onto consumers.
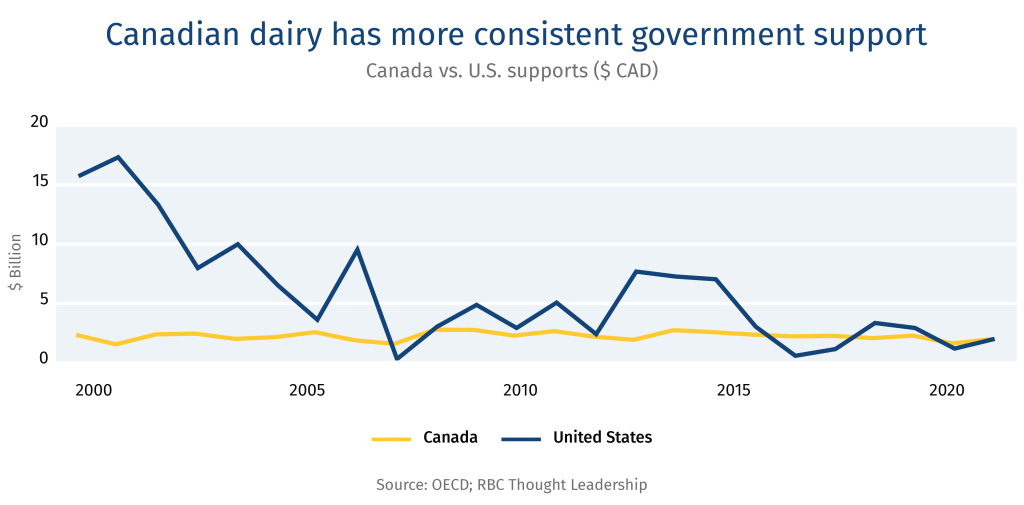
Canada’s support for farms is contentious—but comparable to the U.S. When comparing total direct producer supports, U.S. contributions are 6.5 times larger than Canada’s. Yet, the countries are roughly at par when estimating direct producer supports as a portion of value produced at the farmgate–around 7%.17 However, this support is not evenly distributed across all commodities. Specific to supply managed products, producer supports are clearly aligned with the respective countries’ approach. Canada’s contribution has been consistent with the price producers receive based on supply management, while U.S. farmer supports fluctuate in line with market volatility.
Supply managed farms contribute to Canada’s rural economy prosperity. Stability also plays a broader role in Canada’s rural economy. The most recent agriculture census data, shows the number of Canadian dairy farms fell 11% while herd size rose 13% over a five-year period (2016–2021).18 In the U.S., the number of dairy farms decreased by 34% and herd size increased by 48% over the same period.19 Consolidation enables larger dairy farms in the U.S. to achieve economies of scale. Yet, this recent rapid trend of fewer, bigger farms in the U.S. reduces the diversity of farm sizes, concentrates herd locations, making them more susceptible to disease and pest outbreaks, and can hollow out demand for supporting businesses and rural communities.
Standards
Canada’s supply management allows for a system that adheres to high standards, leading to greater efficiency and sustainability outcomes. However, the system is not designed to maximize production.
Canadian farmers are increasingly ramping up their capabilities to measure, report and verify their progress in adopting best management practices, especially those related to environmental sustainability and animal welfare. The strong governance and market control of supply management allows for widespread and consistent adoption of practices and standards at the farm and along the supply chain. To participate in the regulated market, supply managed farms adhere to an industry code of practice and regulated standards, which has raised Canada’s standards for animal welfare and health and food quality. Non-supply managed production systems in Canada such as beef also have quality assurance programs that ensure high standards on farms such as the Ontario Corn Fed Beef Quality Assurance Program. Yet, the governance system of supply management enables widespread and consistent adoption of practices—an ambition that’s challenging to achieve when there is less regulation and market control.
More stringent standards than the U.S. Nonetheless, on both sides of the border, milk is safe and produced to a high standard. ProAction is the Dairy Farmers of Canada’s framework for best management practices and standards across six themes: milk quality, food safety, traceability, biosecurity, animal care and the environment—with 99.7% of Canadian dairy farmers registered.20 Similarly, the U.S. has the National Dairy Farmers Assuring Responsible Management (FARM), which covers 99% of the U.S. milk supply.21 However, standards within these two programs and the complementary regulations differ, which can impact animal health and milk quality. The U.S. also allows for a higher Somatic Cell Count (SCC), which counts white blood cells in cows. Similar to humans, high white blood cells mean the body is fighting an illness or inflammation, which could negatively impact milk quality. Somatic Cell Count in the U.S. is 750,000 individual cells (IC) per millilitre (mL), while in Canada stands at 400,000 IC per mL.2223
Industry is focused on efficiency and sustainability. The governance frameworks of supply management also provide a platform to scale farmer engagement in industry-wide initiatives on issues such as efficiency, innovation and sustainability. For example, egg farmers across Canada are measuring and reporting their progress on sustainability through the National Environmental Sustainability and Technology Tool (NESTT) platform. This unified approach sidesteps the increasingly fragmented landscape of sustainability and regenerative agriculture projects that many farmers are navigating for market access or to develop new revenue streams through mechanisms such as carbon credits and green premiums.
Global dairy lessons: How other markets are navigating transition and disruption
Food security and sovereignty are featuring high on government agendas globally as extreme weather interrupts food production and trade barriers disrupt trade flows.
Dairy, a nutrient and culturally significant staple in many diets around the world—from French cheese to lassi in India—, has high demand but also high volatility in international markets, resulting in the industry attracting elevated attention in policy, trade, and farmer support.
Here’s how other countries are managing their dairy sector during times of transition and disruption.
New Zealand: An international leader with a rising GHG footprint
New Zealand removed its production quota in the 1980s due to a budget crisis, transforming the country into the world’s largest dairy exporter. In 2001, the government launched Fonterra, a farmers’ co-op, which sets prices and is now the largest purchaser of domestic milk. Its price calculation is based on revenue from milk sales minus operating and overhead costs and capital recovery. New Zealand has more than doubled its national herd since the early 1980s, and individual herd sizes increased three-fold. Consolidation meant the number of herds fell from 15,753 in 1985 to 10,485 in 2024.24 Market liberalization has transformed the New Zealand dairy supply chain, especially powder milk production, which has grown 237% in volume since 2000, driven by free trade agreements with large importers such as China and targeted foreign and domestic investment in building capacity and automating manufacturing processes.25
The dairy sector has become highly efficient and competitive, as demonstrated by its herd consolidation, but the growth in the number of cows has raised the sector’s environmental impacts, such as greenhouse gas emissions (GHG). Led by dairy, agriculture now accounts for over 50% of New Zealand’s GHG emissions.26 Recent national GHG targets have created uncertainty in the sector, resulting in a review of national targets and agriculture’s role in meeting them. AgriZero, a public-private partnership, is focused on matching funds and accelerating climate action in agriculture. It’s seen as a unique model to stack funds at a time when attention on climate mitigation has slowed down.
Lesson for Canada: A first of its kind, AgriZero serves as an example for Canada to explore as pools of climate funds shrink and the need for coordinated, scaled action in agriculture grows.
United Kingdom: Transitioning away from the EU model
The U.K. is transitioning its policy approach to area-based subsides under the Environmental Land Management Schemes (ELMS) post-Brexit that’s underpinned by sustainable agriculture such as marginal land rehabilitation. Dairy producers in the U.K. received direct payments under the EU’s Common Agriculture Policy (CAP), but these types of payments are being phased out until 2028, as part of the U.K. departure from the economic bloc. This transition in farmer support imposes both financial and administrative burdens on the sector as farmers navigate change, amid rising costs of domestic production and competition from importers.
To enable greater agri-food trade among E.U. countries and the U.K., the two have agreed to move forward with establishing a common Sanitary and Phytosanitary area (i.e., shared standards on food safety and quality) that aims to ease the movement of agriculture and food products across the U.K. and EU. However, some say that the move could impact the U.K.’s ability to form trade agreements with countries outside of the E.U. and maintains the U.K.’s ties to the economic region.
Lesson for Canada: As Canada embarks on a mission to strengthen and diverse its international trade, it might avoid going from an over-reliance on the U.S. to over-indexing to another region or country via overly restrictive standard alignment of agri-food products for trade.
Brazil: The struggle to break into the global market despite high ambition
Brazil has transformed its agriculture sector and is now a leader in global agri-food exports—the second largest in the world, after the U.S. Yet, less than 1% of Brazil’s dairy production is exported.27 Domestic demand, market infrastructure that’s not export-oriented, and a highly competitive international market has impeded Brazil’s global push.
The country’s dairy production and processing infrastructure greatly varies from smallholder, subsistence farms to modern, large-scale farm businesses. The former is supported through subsidies for asset investments such as cooling tanks, pasture, and milking infrastructure. Farmer prices are mostly market-driven, but the government may intervene via CONAB (National Supply Company) to buy excess milk or offer storage subsidies.
With ambitions to break into the global market in a big way, Brazil is up against tough competition, notably from New Zealand, as it eyes the Middle East, Latin American and Asian markets. To grow globally, Brazil must also address its weaker standard and regulatory approach to land use, GHG emissions, traceability and cold-chain logistics.
Lesson for Canada: While Brazil and Canada have had different agri-food development trajectories to date, they are increasingly competing for the same piece of the global agri-food export pie. Brazil’s approach to enabling diverse scales of production, targeted at both domestic and export growth, should prompt Canada to investigate its own production, which continues to consolidate and faces rising foreign competition.
Market Outlook
Canada’s supply management systems is designed to protect the country from changes in international markets. Yet, policymakers still need to be alert to structural shifts and macro trends in the global industry.
Dairy
Real global dairy prices for farmers are projected to trend downward within this decade. But, relative to input costs, prices are expected to rise, especially as milk produced per animal grows.28 U.S. farmers could see an average annual drop of 8% year-over-year in real price, signalling lower returns for dairy farms in commodity markets that do not innovate and grow.29
Global dairy consumption is expected to modestly increase 1% per year, while production is projected to grow at 1.6% per year to 1,085 million tonnes, driven by production in India, Pakistan and Sub-Saharan Africa, primarily for their domestic consumption.30
Fresh dairy consumption in North America and Europe are stable or declining as consumers move away from full-fat milk and cream, and plant-based alternatives such as oat milk mature as an established replacement. Processed dairy consumption, including butter and powder milks are on the rise driven by their use in food manufacturing, including infant formula and baked goods. Finally, cheese consumption, which is closely connected to household income has been on the rise in growing international markets such as Mexico, the U.S., Brazil and Saudia Arabia.31
Only 7% of global milk production is traded internationally due to its perishability and as market infrastructure in many countries is primarily designed for domestic or regional distribution with few exceptions, such as New Zealand and Ireland. However, over 50% of milk powder, including whole and skim products, are traded.32
World dairy trade is expected to grow by more than 12% over the next eight years. Skim milk powder from the U.S. and cheese from the E.U., two of the largest dairy export segments, are poised for the highest growth.33
Poultry and eggs
Global prices for poultry and eggs are projected to decline as inflation and input costs fall. For example, U.S. farm prices per dozen of eggs are projected to decline by US$0.90 over the next decade, with an average year-over-year decline of 4%.34 However, U.S. production is expected to rise 12% by 2033, from a 2022 baseline.
Poultry production is expected to increase with growing demand, and account for nearly half of all meat produced. Global poultry consumption is expected to grow 16% over the next decade—the most among animal proteins. Poultry is projected to account for 43% of animal protein consumed by 2034, with notable growth in Brazil, Europe, and the U.S.35
China’s self-sustaining food policy and recent rebound from African swine fever and avian influenza outbreaks has resulted in a decline in global meat trade from its height in 2021, when China accounted for roughly a quarter of global meat imports.
Population and GDP growth in Africa and Asia are expected to rebound meat exports within the next decade, driven by poultry which is expected to account for over 40% of total meat imports.36
Statistics Canada. GDP at basic price, by industry, province and territory, 2025.
Legal Disclaimer2
Agriculture and Agri-Food Canada (AAFC). Overview of Canada’s agriculture and agri-food sector, 2025.
Legal Disclaimer3
Dairy Farmers of Canada. What Supply Management Means for Canadians, 2024.
Legal Disclaimer4
Statistics Canada. Farms classified by farm type, Census of Agriculture historical data, 2022.
Legal Disclaimer5
Statistics Canada.
Legal Disclaimer6
Statistics Canada.
Legal Disclaimer7
Dairy Processors Association of Canada. Comprehensive and Progressive Agreement for Trans-Pacific Partnership (CPTPP).
Legal Disclaimer8
Statistics Canda. Dairy statistics and market information, 2025.
Legal Disclaimer9
Agriculture and Agri-Food Canada (AAFC). Supporting Canada’s supply-managed sectors, 2023.
Legal Disclaimer10
Dairy Processors Association of Canada. Canada-United States-Mexico Agreement (CUSMA).
Legal Disclaimer11
U.S. Centers for Disease Control and Prevention. Avian Influenza (Bird Flu), 2025.
Legal Disclaimer12
Canadian Food Inspection Agency (CFIA). Status of ongoing avian influenza response by province, 2025.
Legal Disclaimer13
Statistics Canada. Monthly average retail prices for selected products, 2025.
Legal Disclaimer14
U.S. Bureau of Labor Statistics. Consumer Price Index – Average price data, 2025.
Legal Disclaimer15
Statistics Canada. Household spending by household income quintile, Canada, regions and provinces, 2025.
Legal Disclaimer16
Statistics Canada. Food insecurity by economic family type, 2025.
Legal Disclaimer17
Organisation for Economic Co-operation and Development (OECD). Agricultural policy monitoring, 2024.
Legal Disclaimer18
Statistics Canada. Number of cattle, by class and farm type (x 1,000), 2025.
Legal Disclaimer19
United States Department of Agriculture, National Statistic Services (USDA NASS) 2022 Census of Agriculture, 2024.
Legal Disclaimer20
Dairy Farmers of Canada (DFC). ProAction, 2025.
Legal Disclaimer21
Farmers Assuring Responsible Management (FARM).Animal Care, 2025.
Legal Disclaimer22
DFC. ProAction – Milk Quality, 2021.
Legal Disclaimer23
USDA. Determining U.S. Milk Quality Using Bulk-Tank Somatic Cell Counts, 2018.
Legal Disclaimer24
DairyNZ and LIC. New Zealand Dairy Statistics 2023-24, 2024.
Legal Disclaimer25
USDA Foreign Agricultural Service. New Zealand: Dairy and Products Annual, 2025.
Legal Disclaimer26
Ministry of the Environment, New Zealand. New Zealand’s Greenhouse Gas Inventory, 2025.
Legal Disclaimer27
Food and Agriculture Organization, United Nations (FAO). Dairy Market Review: Overview of global market developments in 2024, 2025.
Legal Disclaimer28
OECD and FAO. OECD-FAO Agricultural Outlook 2024-2033, 2024.
Legal Disclaimer29
USDA Economic Research Service. USDA Agricultural Projections to 2034, 2025.
Legal Disclaimer30
OECD-FAO.
Legal Disclaimer31
FAO.
Legal Disclaimer32
OECD-FAO.
Legal Disclaimer33
OECD-FAO.
Legal Disclaimer34
USDA.
Legal Disclaimer35
OECD-FAO.
Legal Disclaimer36
OECD-FAO.
As artificial intelligence comes of age, Canada finds itself at a crossroads. While we possess world-class research and a robust talent pool, the country is falling behind as global competitors race ahead in AI adoption. The core challenge is not a lack of technology or talent, but a pervasive “imagination gap”—a widespread inability among Canadian businesses, especially small and medium-sized enterprises (SMEs), to see AI as relevant or beneficial to their operations. Only 12% of Canadian firms have integrated AI into their production or services, placing Canada among the lowest in AI adoption in the OECD. Data from the OECD also shows that Canadian firms tend to explore a more limited set of use cases for AI than other nations.
And yet, the upside is clear. A recent Business Development Bank of Canada survey revealed that 97% of AI-adopting SMEs reported ‘tangible’ benefits. And Statistics Canada data showed that AI’s impact on task reduction is particularly pronounced in companies with fewer than 100 employees—underscoring significant potential for SMEs. The issue was also high on the agenda at the G7 in Kananaskis, Alberta, where leaders committed to “double down” on AI adoption efforts to improve prosperity.
To better understand why Canadian businesses have been so slow to adopt AI, RBC Thought Leadership partnered with the University of Toronto’s Munk School of Global Affairs & Public Policy and conducted more than two dozen in-depth interviews with senior business, public service and technology leaders in Canada. Here’s what we learned about the barriers that companies, both big and small, are facing. And some lessons from organizations that have taken the challenge of AI adoption head-on.
1. First-Mover Dilemma: Certain Costs, Uncertain Benefits
Some companies that have been slow to adopt AI are locked in inertia. The costs associated with AI adoption are immediate and tangible, while the benefits seem distant and notional. For chief technology officers, AI initiatives carry fixed, up-front financial costs, as well as reputational costs if the project fails. But, as some of the leaders we spoke with recognized, late adoption carries the risk of lagging behind quick-moving competitors. It’s a double‑edged sword: move early and risk losing scarce capital and personnel resources; move late and risk competitive disadvantage.
Several technology leaders noted that these uncertainties frequently stall approvals by six to 12 months. Adding to that, they expressed frustration that Canadian industry leaders often failed to clearly perceive the benefits competitors were already achieving through AI. Technology developers even cited achieving greater success pitching their AI solutions to U.S. based divisions of Canadian companies than their domestic counterparts.
To navigate these obstacles successful AI transformation leaders recommended clearly quantifying AI investments by contrasting the costs of immediate action versus the cost of inaction. Tools such as ‘cost of delay’ dashboards help clarify the opportunity costs of not acting sooner.
Bell Canada: Overcoming Inertia Bias
When GPT‑4 burst onto the scene in early 2023, Bell’s directors wanted to know immediately what waiting to implement might cost them. Within weeks, the AI Group President convened two board‑level tutorials and unveiled ‘cost‑of‑delay’ analysis that contrasted lost productivity with the modest price of pilot projects. The numbers were decisive: capital to fund AI applications was released the same quarter. Real‑time speech analytics now mine 100% of the firm’s 50,000 daily customer calls, surfacing friction points that were previously buried in anecdotal samples. This has enabled AI voice and chat agents to handle inquiries with greater accuracy.
Cultivating a ‘culture of entrepreneurship and experimentation’ has also allowed Bell to grow innovative AI use cases from the bottom up, developing novel AI applications that vastly improve communication processes, workflows and customer satisfaction.
2. AI Literacy: Moving from Apprehension to Opportunity
Whether it’s a fear that AI is coming to take their jobs or just a lack of understanding of its benefits, Canadians are skeptical of AI. One recent KPMG study found that 79% of Canadians are concerned about negative AI outcomes. And it’s estimated that less than one-in-four Canadian employees have received AI training. Simply put, most Canadians haven’t engaged sufficiently with AI to demystify it.
While having an AI champion in the corner office or a single business unit dedicated to experimentation and implementation helps, if AI expertise remains confined to a narrow ‘priesthood,’ widespread adoption stalls. Our research indicates that companies that invest in AI literacy for their staff see faster scale-up of AI projects, stronger employee engagement, and growing organizational confidence. Knowledge is a powerful catalyst for continuous innovation and competitive differentiation.
Hopper: Workforce Reskilling for Enhanced Efficiency
Rather than using AI to displace its customer support staff, Hopper, a Montreal-based travel platform, trained employees to take on roles focused on AI content, training, and testing. Up-skilling its staff to embed AI into its customer support function not only addressed employee hesitation, it allowed Hopper to handle customer inquiries 75% faster—reducing average resolution time from 15–20 minutes to 3–5 minutes. It did this without compromising customer satisfaction and led to cost savings of ~90% compared to human-driven interactions.
Canada’s most successful adopters match grassroots experimentation (“super‑agency” employees who already prompt, patch and prototype with GenAI) with an executive‑mandated transformation agenda. When only the bottom layer is active, shadow‑IT proliferates and pilots stall for lack of budget or risk authority. When only the top pushes, initiatives feel imposed, and staff revert to old workflows.
Lumberhub: Bottom‑Up “Super‑Agency” in Traditional Industry
When a chronic pricing lag between sawmills and home‑builders kept eating into margins, George McKeown, a PhD chemist turned lumber trader, asked a simple question: Why do we accept this inefficiency?
Lacking a deep coding background, he turned to GenAI pair‑programmers to develop over 40k lines of code and in less than three months built a conventional react/typescript web app running on Amazon Web Services that ingest real‑time futures data, spits out dynamic quotes for every stock keeping unit (SKU), and auto‑generates purchase orders for suppliers.
AI as an enabler, not the end‑product: The final platform runs on conventional SQL + Python; the code itself was written multiple times faster thanks to Copilot‑style tools.
Immediate pay‑off: The quote‑to‑order cycle time dropped from days to minutes, metigating inefficient and volatile price swings.
Leadership unlock: Once the CEO saw a live demo, the lumber mill fenced budget to refine the prototype and plugged it into the ERP stack inside.
3. Paralysis of Plenty: Too Many Use‑Cases
AI has opened the floodgates. To a technologist’s eye, every process, product, and customer touch‑point looks like it can be automated. But abundance can lead to inaction—‘choice paralysis.’ The bottleneck is often choosing the first use case. To accelerate the decision process, some firms tapped the expertise of their staff, including hosting a ‘use‑case tournament’ to evaluate options.
But even if a pilot program is selected and initiated, mid-size Canadian firms frequently encounter significant barriers to scaling projects. Our interviews highlighted three primary factors impeding AI initiatives:
Budget cliff: Public incentives frequently support only initial pilot phases, covering equipment or personnel but rarely address subsequent integration, training, and retrofitting costs. Many initiatives stall after pilot phases because ongoing costs typically fall into operating budgets instead of capital expenditure.
Champion churn: Key sponsors, such as plant managers or IT leads, often rotate or are promoted after pilots begin, leaving successors to inherit risks without corresponding enthusiasm or clarity around the initiative’s original vision.
ROI lost in translation: Tangible benefits essential for scaling rarely make it into capital allocation discussions. Technical improvements proposed by engineers must translate into clear cash-flow projections. Consequently, potential operational expenditures must be explicitly justified by cash-flow benefits rather than abstract metrics like ‘defects-per-million.
4. Data: Fragmented and Low-Quality
Many of the leaders interviewed cited the enormous lengths they had to go through to get to a place where AI usage was even possible, underscoring how foundational data architecture is to successful AI adoption. Some leaders flagged the shortage of high-quality, production-level data in manufacturing. That, in combination with the difficulties around unifying diverse datasets, creates a data integration burden that ends up thwarting or delaying AI implementation. Significant upfront investments are often required to improve data quality, reliability, and governance before AI can even be contemplated, which acts as a deterrent to adoption.
Strengthening Canada’s data foundations by building robust, AI-ready data ecosystems is essential. Many SMEs, nearly half of which are more than 20 years old, face significant hurdles adapting legacy systems and fragmented datasets. Legacy management information systems capture data in incompatible formats, riddled with gaps and duplicative records. The time spent cleaning and stitching these sources drains enthusiasm and budgets long before benefits materialize.
St. Michael’s Hospital: What Canada forfeits when data stays in silos
GEMINI, Canada’s largest hospital-data platform for research, was established to facilitate the creation of large health data sets to improve healthcare.
Despite successfully integrating more than 60% of Ontario’s hospital medical care within its platform and supporting more than 1,000 clinicians and researchers through $140 million in combined grant funding, challenges persist. A disparate web of hospital systems with incompatible data formats slow governance processes, and infrequent data refresh cycles block progress. These barriers highlight what Canada will miss out on if data integration efforts are not improved.
Platforms like GEMINI can automate patient matching into trials and efficiently capture health outcomes, reducing the cost of trials by up to 80% and enhancing Canada’s attractiveness as a clinical trial hub. Large-scale, richly detailed datasets are critical for health AI. GEMINI and its partners in Alberta and Quebec have started taking steps to overcome barriers, aspiring to build a 100-hospital near real-time data sharing network called ‘VITAL.’ Large and detailed datasets like GEMINI are critical for health AI and accelerating their development will be key to Canada‘s ability to be a leader in this field.
5. Blind Spots: Overlooking the Unknown
It is common to invest in AI to automate the known knowns (repetitive tasks) or to analyse the known unknowns (questions we can articulate but cannot answer). Yet, some of the biggest wins came from the unknown unknowns—insights managers didn’t realize they were missing until they were unearthed by the model.
AI models can ingest years of sensor data, call logs, or shipment records, which can lead to the surfacing of correlations and anomalies that may have otherwise escaped human analysis. For example, excess energy use on a single production line, chronic micro‑stoppages in a distribution network, or an unexpected cross‑sell pathway in e‑commerce. Budgets, KPIs and risk reviews are designed for defined problems, the ability of an AI to augment ‘discovery value’ widens a firm’s operational possibilities.
Linamar: Turning ‘Unknown Unknowns’ into Competitive Advantage
Uncovering hidden inefficiencies and unexpected solutions in complex manufacturing environments is transforming Linamar’s approach to overlooked data, revealing tangible competitive advantages.
When Linamar piped 10 years of shop‑floor data into Acerta’s LinePulse Industrial AI and Analytics platform, the first surprise was a set of micro‑fluctuations in pump pressure that engineers had never tracked. By fixing it, the company was able to eliminate what had been a silent cost in its manufacturing process in parts for EV gearboxes. The software’s machine learning root-cause analysis tool then flagged the single upstream variable most responsible for ‘noise, vibration, and harshness’ from one of more than 100 parameters that no human could have correlated in real time. On another manufacturing line, the model showed that a non‑bottleneck station within the assembly line was slowing throughput.
By adopting an industrial AI platform that can solve problems in virtually any discrete manufacturing environment, Linamar has re‑positioned AI as a continuous diagnostic instrument rather than as a one‑off cost‑saver. Each unexpected insight frees capacity, trims launch challenges and even wins business.
6. Digital Infrastructure: Canada’s Compute‑Capacity Deficit
Much like how railways or electricity grids fuelled economic growth in the past, robust AI compute capacity—supercomputers and GPU clusters—underpin innovation. Currently, Canada’s compute capacity significantly lags the growing demand for training and deploying cutting-edge AI models. Canada trails every other G7 nation in AI computing infrastructure, possessing only one-eighth to one-tenth of the available compute performance per capita compared to countries like the U.S. Without sufficient domestic compute capacity, Canadian innovators may be held back in comparison to other countries that are providing subsidized and extensive compute capacity to their leading AI firms and researchers. And Canadian institutions may rely on foreign cloud providers which, in the context of sensitive data or government-facing AI applications, could heighten risks to sovereignty, security and economic resilience.
AI leaders shared that waiting in domestic compute queues can extend training cycles from hours to days—killing iteration speed. Procurement rules and cautious public‑sector buying also slow the build‑out of sovereign clusters that could attract anchor tenants. Without targeted ‘compute credits’ or pooled infrastructure, even world‑class research talent cannot fully commercialise models at home.
Provincially, initiatives like Alberta’s Artificial Intelligence Data Centres Strategy help to align more localized strengths, such as skills or energy, with the economic opportunities offered by AI compute infrastructure. Such initiatives are valuable complements to federal strategies which broadly incentivize compute infrastructure development.
And recent federal initiatives, notably the $2 billion Canadian Sovereign AI Compute Strategy, represent important steps toward addressing this gap. The program’s first project—a domestic supercomputing partnership between Cohere and CoreWeave—will provide Canadian AI firms access to essential computing resources on Canadian soil. Accelerating and expanding such strategic investments can significantly enhance Canada’s domestic AI infrastructure, enabling solutions to be securely and swiftly developed without reliance on external providers.
7. Regulation and Policy: Duplicative and Uncertain
Regulatory responsibility is currently divided among several bodies—including Innovation, Science and Economic Development (ISED), Office of the Privacy Commissioner (OPC), Competition Bureau—as well as sector-specific regulators (e.g. Health Canada, and Transport Canada). Plus, provinces are increasingly drafting their own distinct guidance (e.g., Québec’s Bill 25 privacy amendments), creating what some describe as a ‘mini-EU’ landscape of 13 distinct regimes.
A major regulatory obstacle cited in most of the interviews was the absence of federal leadership. Recent attempts, notably the Artificial Intelligence and Data Act (AIDA), ultimately failed amid political challenges. AIDA drew criticism not only for its overly cautious, burdensome compliance demand, but also for procedural shortcomings and inadequate stakeholder engagement. Canada could benefit from a clear regulatory framework that facilitates innovation, involves meaningful public participation, and enables practical AI implementation.
This absence of clear federal guidance disproportionately affects SMEs—Canada’s economic backbone. Smaller businesses typically have limited resources to independently navigate regulatory ambiguities, leading to hesitation around investing in AI. Many technology leaders interviewed by RBC lamented how repeated announcements without substantive guidelines have created persistent uncertainty, pushing companies toward overly cautious approaches. As a result, organizations often limit their AI implementations to conservative use cases, wary of significant future compliance costs if regulations become stricter. Clarity would help.
Conclusion: Five Lessons for Leaders
Despite the obstacles, there are many examples of Canadian firms successfully embedding AI in their operations and reaping the competitive benefits. Successful firms:
Quantify the costs associated with both action and inaction to ensure decisions about capital allocation are informed by both the risks and the rewards of AI adoption.
Educate employees about the benefits of AI and teach them how to utilize the technology, both to advance their careers and to improve operational effectiveness.
Address the problem of ‘too many ideas, too little focus’ by pulling employees into the evaluation process, empowering them to drive solutions.
Invest in data governance, ensuring data is standardized, consolidated, and AI-compatible.
Formalize an ‘exploration budget’—a portion of annual AI spend reserved for open-ended data mining to ensure that hard-to-find opportunities are discovered. Embedding that mindset among employees turns every new dataset into a hunting ground for hidden efficiencies and growth opportunities.
Project Lead
Reid McKay, Director, Technology Policy Lead, RBC Thought Leadership
Contributors Jordan Brennan, Head of Thought Leadership, RBC Jaxson Khan, Special Advisor Nicole Harris, Graduate Student, Munk School of Global Affairs & Public Policy Nora Bieberstein, Director of Strategic Programs, RBC Thought Leadership Niki McKeown, Research Associate, RBC Thought Leadership
Shiplu Talukder, Digital Publishing Specialist
Special thanks to Daniel Diamond, Daniel Ebrahimpour, Janelle Gunaratnam, Anya Haldemann, Nikhil Konduru, Patrycja Maszlejak, Georgia Maxwell, Andrew Scarlato, Sabreena Shukul, Avaani Singh, Mia Sunner, Sydney Wisener
Executive Sponsors John Stackhouse, Senior Vice President, Office of the CEO, RBC Janice Stein, Founding Director, Munk School of Global Affairs & Public Policy
The past few years have been incredibly hard for many Canadians. The pandemic caused massive disruptions to the job market and the highest rates of inflation in decades, which was intensified by the war in Ukraine. And now comes a trade war with the U.S., with its own set of shockwaves, including job losses and supply-chain upheaval, sending the price of goods even higher. Many can’t keep up.
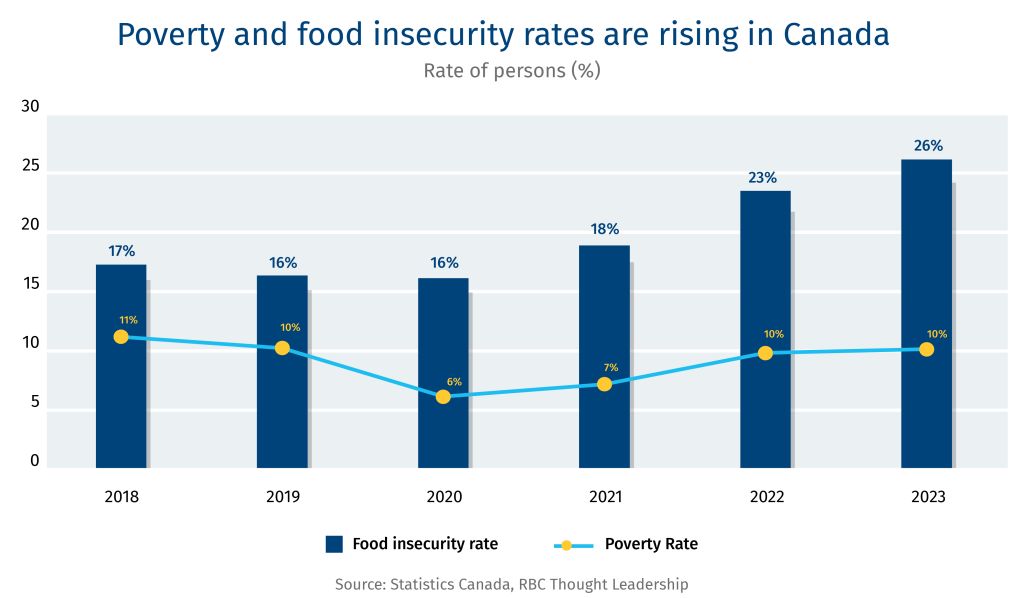
Today, one in four Canadians are experiencing food insecurity. That’s 10 million people—a level never seen before in this country.1 Ultimately, it’s an issue of affordability. There is an abundance of food available. But for an increasing number, it’s out of reach. In March 2024, more than two million visits were recorded at Canadian food banks. That’s a 90% increase in just five years.2 And food banks are a last resort, signalling how dire things have become. Properly supporting and resourcing food banks is critical. However, addressing food insecurity longer term, relies on building a stronger Canadian economy. This includes addressing the affordability crisis, improving productivity, and advancing durable economic development in Canada’s rural and remote areas.
Trade war on food: Rising job loss, costs, and disruptions
Job loss and insecurity is forcing many to make difficult choices
U.S. President Donald Trump’s trade war has caused widespread uncertainty. Launches have been delayed. Production has been paused. Layoffs have been announced. Between January and May, Canada’s manufacturing sector lost 54,000 jobs and the country’s unemployment rate rose to 7%, the highest it’s been since 2016, excluding the pandemic.3 4 Trade exposed industries, including manufacturing, continue to scale down jobs, and now there is greater uncertainty in steel and aluminum jobs with Trump’s 50% tariff on the industry. All this volatility can leave workers in precarious financial situations.
The average Canadian household spent about $76,750 on goods and services in 2023, with 15% and 32% of their money spent on food and shelter, respectively. The lowest income quintile spent $40,080 annually—nearly half that of the average household—with 18% spent on food and 35% on shelter.5 In the event of a job loss—or the fear of potential layoff—Canadians in higher income brackets can cut spending on discretionary items (e.g., new clothes, meals out) in the short term. Lower-income households don’t have that luxury and are left with difficult choices between what basic needs—utility bills, medication, food—they’ll cover. These choices can also impact the quality of food purchased, with lower income households opting for cheaper, lower-nutrient-rich foods.6
Like downturns in the job market, swings in international commodity markets impacted by tariff wars can impact Canadians whose income is directly tied to market prices. Farmers are often price receivers—unable to pass rising costs onto buyers and consumers. And China’s tariffs on agri-food products including canola oil and seafood have recently taken a toll on Canada’s rural economy. Nova Scotia is thought to be the hardest hit by China’s 25% duties on aquatic products, which represented 9.2% of the provinces total export value in 2024. Farmers and fisherpersons are familiar with volatility in the marketplace from bad weather to shifts in demand. Still, ongoing disruptions can erode stability in rural and remote regions that are already at a disadvantage in accessing economic opportunities and services.
And the impact of tariffs is not just about job security. Windsor, Ontario, for example, is reliant on automotive and advanced manufacturing, food processing, and grains and oilseed handling and shipping. This exposes the entire city and surrounding area to Trump’s tariffs on auto as well as China’s retaliatory tariffs on Canada’s agri-food products. Unemployment in Windsor is higher than the national average at 10.8% in May 2025, up from 7.8% in May 2024.7 And the knock-on effects from multiple pressures on employment within a region and rising costs of living can trickle down to local retail and services. As consumer spending tightens, all sectors and their workers are impacted.
Rising cost of living threatens to further deepen the food insecurity crisis.
With rising costs in Canada, a job is no longer a precursor for meeting basic needs. More than 60% of Canada’s food-insecure households rely on wages, salaries, or self-employment income as their primary source of income.8 Workers experiencing moderate to severe food insecurity often occupy low-wage or precarious jobs that are not keeping pace with the cost of living. Visible minorities, women and new immigrants in Canada earn less than the national average. As a result, food insecurity is disproportionality experienced by these groups. More than 46% of black households and 39% of the Indigenous population living off-reserve are food insecure.9 Single-mother households also have higher rates of food insecurity at 52%.10
The effects of food insecurity further marginalize vulnerable groups. Food insecurity is associated with higher rates of chronic diseases, including diabetes and cardiovascular disease. This means more visits to the doctor’s office and the hospital. Severely food insecure Canadians incur health costs that are more than double those who are food secure.11 Food insecurity also impacts the physical and mental development of children, as well as academic performance and behaviour.12 These impacts underline the health and socio-economic costs to families and the Canadian economy.
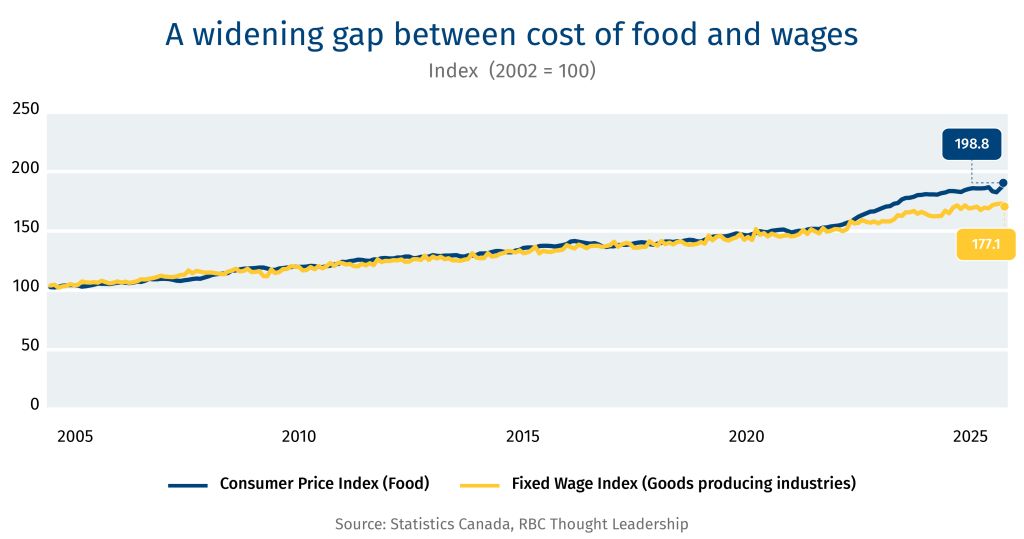
Over the past five years, the affordability crisis has been acutely experienced by households whose wages are not keeping pace with the rising price of goods and services. With pre-tariff inventory coming off grocery store shelves, tariffs are starting to intensify the unaffordability of products in Canada, especially food. Since January 2025, food prices have been a notable driving factor growing the Canadian Consumer Price Index. In April 2025, food prices increased by 3.8% from last year.
Supply chain disruptions impact food consistency and costs
Food companies and retailers reported loses in the first quarter—a direct result of the tariff wars.13 On top of mitigating losses, Canada-U.S. agri-food supply chains are now tasked with additional administrative demands in proving the Canada-United States-Mexico (CUSMA) trade agreement compliance as only two-thirds of Canada’s agri-food exports in 2024 were traded under CUSMA. These stacking complexities and added costs cannot only be absorbed by agri-food suppliers, wholesalers, and retailers, who often operate on thin margins. Eventually rising costs are passed onto the consumer. In the U.S., the impact of tariffs is estimated to increase food prices by 2.6% in the short run, disproportionately impacting fruit and vegetables, that are expected to rise 5.4%.14
Trade wars have sparked a diversification movement. And while trade diversification is a strategy to grow and strengthen Canada’s agri-food exports, it can also result in trade-offs such as short-term uncertainty in quality and cost for consumers while supply chains are being established. Stability and consistency in trade is a key factor in keeping transportation, logistics and operational costs down for traders, wholesalers and retailer, which helps ensure consumers have consistency in price, quality, and availability. Now, uncertainty from tariffs jeopardizes these benefits that North American consumers have become accustomed to through Canada and the U.S.’s interconnected supply chains.
The next step: Tying food solutions to Canada’s growth ambitions
Solutions to food insecurity in Canada are well documented but the issue remains on the sidelines when it comes to large-scale policy and funding commitments.
Potential solutions include:
Address the disparity between Canada’s rural and urban as it relates to access to resources, living wages, and economic development opportunities.
Rebuild Canada’s social safety net to better support low-income households and proactively respond when a household has lost income or has experienced a disruption that impacts its budget.
Improve the affordability of housing.
A food security target may be the catalyst needed to pull these solutions together to drive action across Canada and track progress. This is not a new idea. Food security experts in Canada have called for a 50% target by 2030.15 16 But now is the time to implement a bold vision for food security in Canada as the country sets out to build back a better economy. A key challenge is identifying where food security solutions can be aligned with existing landmark commitments to build momentum. A food secure plan for Canada must also consider how it proportionally improves rates in regions and among groups that are the worst impacted.
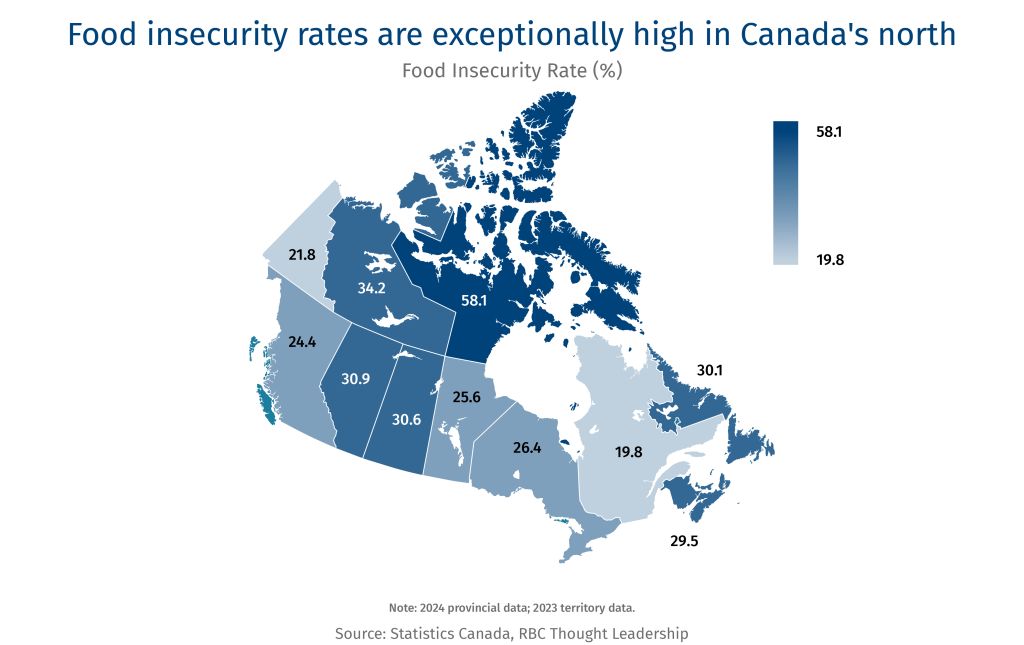
Expedite the development of rural and remote community and health services alongside efforts to expedite Canada’s major infrastructure projects. Canada’s ambitions to accelerate major infrastructure projects from the Port of Churchill to the Ring of Fire are primarily concentrated in northern rural and remote Canada. Canada’s rural and remote areas account for 25% of Canada’s GDP but are grossly underserviced when it comes to health care, housing, and other basic needs, including access to healthy food.17 Food insecurity is high across Canada but is highest in northern and remote areas. More than 58% of people in Nunavut experience food insecurity. Further, only 7% of doctors work in rural areas despite the fact Canada’s rural population accounts for 18% of the total population.18
Much of Canada’s plans to build its economic security and sovereignty hinges on having a productive workforce in rural and remote Canada. But getting people to stay in rural and remote areas or relocate for these projects is a tough sell if they can’t access resources needed for their families to lead a healthy life. Canada can help flip the trend of urban areas growing 15 times faster than rural by mitigating brain and resource drain through investments in community resources including access to healthcare, food and housing that match the ambitions of major infrastructure projects.19
Improving access to household financial supports and benefits through policy reform. It is especially timely to advance such reform efforts as the Liberal government has committed to review and reform the process of applying for the Disability Tax Credit (DTC). The DTC is the gateway to key federal programs, including the Canada Disability Benefit, the Canada Child Benefit for children with disabilities, and the dental benefit. This review process is an opportunity to engage Canada’s network of food banks servicing families that rely on DTC benefit to develop practical solutions that work for households, especially those experiencing housing and food insecurity.
On top of qualifying for benefits, Canada’s most vulnerable groups, including those with disabilities and houseless people, are often the hardest to reach populations for tax returns, and have filing rates below Canada’s national average of 92%.20 Unfiled taxes and unclaimed returns account for more than 8.9 million uncashed Canada Revenue Agency (CRA) cheques, totaling $1.4 billion.21 The value of household tax credits won’t solve a household’s financial challenges, but it’s a start.
Building upon CRA’s automatic tax filing pilot and approaches to streamline and simplify tax filing, there is an opportunity to explore support services that better position Canadians to navigate administrative processes to qualify and access credits. And to learn from community organizations including food banks who offer “wrap around services” such as food and financial literacy programming for Canada’s most vulnerable and marginalized populations.
Align food security objectives with Canada’s home building boom. Cutting housing costs can transform a household’s budget. The new federal Liberal government’s plan to build 500,000 homes a year would boost the economy and address a critical need: one of the priority functions of Canada’s forthcoming entity “Build Canada Homes” (BCH) is to build affordable housing at scale. This priority includes a $6 billion commitment for deeply affordable housing including supportive housing, Indigenous housing, and shelters. Complementary to building these homes rapidly and setting homelessness targets with provinces, government could also consider aligning with national food security targets and activities as a measure of their success in affordable housing and enabling people to achieve a healthy, more productive lifestyle that in turn contributes to growing Canada’s economy.
Food insecurity is a systemic problem, requiring systems-based solutions. As Canada embarks on its pro-growth era, it is opportune to consider how its unified approach can be applied to address the most chronic symptoms of a poor economy—food insecurity and poverty.
Experiences and approaches from around the world
Food insecurity affects every country, and over 295 million people worldwide face acute hunger.1 Countries are taking different approaches to measure, monitor, and mitigate the issue, which extends far beyond food programming and policy into income, housing and social equity domains. However, advanced economies like Canada are increasingly expanding food programming to counter the short-term impacts food insecurity is having on communities.
More than 7 million people, or 11% of the population, in the U.K. are living in food insecure households.22 And one-third of children in the U.K. are living in poverty. To tackle this challenge, the government launched a Child Poverty Taskforce.23 The U.K. also has a few notable programs that directly relate to food access such as:
Free school meals program provides meals for children and young people during school with standards on the nutrition of food offered. Complementary to school meals, the UK launched Holiday Activities and Food (HAF) in 2022 to improve access to food and resources during school breaks.24
Healthy Start vouchers in England, Wales, and Northern Ireland support people on low incomes to access pre-natal vitamins, infant milk formula, and healthy food for young children. In Scotland an equivalent Best Start Foods program launched in August 2019.
Household Support Fund: Allocated £1.5 billion in 2022/23 to help with household essentials, including food, energy and housing bills.
The U.K. is also undergoing its largest home building campaign since World War II. The lack of affordable housing and its impact on household stability and spending is a key driver for this building boom. The campaign goes as far as outlining a plan for creating a dozen new towns of approximately 10,000 homes each.25
In New Zealand, 27% of households with children ran out of food often or sometimes in 2023, up from 14.4% in 2021.26 In response to rising rates of food insecurity, New Zealand led the development of a 10-year food security roadmap for the Asia Pacific Economic Cooperation (APEC) covering four key areas: digitalization, productivity, inclusivity and sustainability. APEC includes 21 member countries across the Pacific Rim, including Canada.
Food security research, policy and programming are delivered under multiple ministries in New Zealand, including health, education, and social development ministries, signalling the recognition of food insecurity’s impact on human health and wellbeing. Within New Zealand there has been a growing movement to improve access across its four main regions to resources for basic needs and to improve healthy living standards:
Launch of the Public Health Advisory Committee in 2022, which was asked in 2023 to review New Zealand’s food system and provide advice and recommendations, which are presented in the 2024 report, Rebalancing Our Food System.
New Zealand provides some government funding to maintain community food distribution infrastructure and support regional community food hubs under its Food Secure Communities program, which was established in 2020.
Ka Ora, Ka Ako (Healthy School Lunches Program) was launched in 2019 to provide free lunches to students attending schools in low-income areas. The program is active in over 1,000 schools and provides meals for nearly 240,000 students every day.
Food insecurity affected 47 million Americans in 2023. The U.S. has experienced a similar post-pandemic trend to Canada with the rate of food insecure households rising from 10% to 14% between 2021 and 2023.27 Among those in the OECD, only Costa Rica has higher levels of income inequality. And proposed legislation such as, One Big Beautiful Bill Act, risk worsening inequality in the U.S. by raising national debt and potentially triggering cuts to programs that are designed to reduce food insecurity and improve food access, including:
The Supplemental Nutrition Assistance Program (SNAP) provides a restricted subsidy to purchase food. SNAP serves an average of 42.2 million people per month (12.6% of the US population).28 Participating in SNAP for six months has been shown to decrease food insecurity by 5-10 percentage points and is even more effective for children and those with very low food security.29 30 SNAP has also shown to positively impact local communities’ economic activity and job creation.
The Special Supplemental Nutrition Program for Women, Infants and Children (WIC) provides a restricted food subsidy for pregnant and post-partum people, infants and children up to five years old who meet both income- and nutrition-based eligibility criteria.31 In 2023, the federal government spent US$6.6 billion on WIC program, reaching an average of 6.6 million people per month.32
Statistics Canada. Food insecurity by economic family type, 2025.
Food Banks Canada. HungerCount 2024, 2024.
Statistics Canada. Labour force characteristics by census metropolitan area, three-month moving average, seasonally adjusted, 2025.
Statistics Canada. Employment by industry, monthly, seasonally adjusted and unadjusted, and trend-cycle, last 5 months (x 1,000), 2025.
Statistics Canada. Household spending by household income quintile, Canada, regions and provinces, 2025.
French et al. Nutrition quality of food purchases varies by household income: the SHoPPER study, 2019.
Statistics Canada. Labour force characteristics by census metropolitan area, three-month moving average, seasonally adjusted, 2025.
Li T, Fafard St-Germain AA, Tarasuk V. Household food insecurity in Canada (2022), 2023.
Statistics Canada. Food insecurity by selected demographic characteristics, 2025.
Statistics Canada. Food insecurity by economic family type, 2025.
Statistics Canada, Canadian Community Health Survey (CCHS) 2005, 2007-2008, 2009-2010, Ontario administrative health databases. Adapted from: Tarasuk, Cheng, de Oliveira, Dachner, Gundersen & Kurdyak (2015)
Gallegos et al. Food Insecurity and Child Development: A State-of-the-Art Review, 2021.
The Budget Lab at Yale. State of U.S. Tariffs: April 15, 2025
Food Banks Canada. Joint Open Letter: Cut Food Insecurity in Canada in half by 2030, 2025.
Beardsley, McCain, and Saul. Let’s commit to cutting food insecurity in half, 2022.
Innovation, Science and Economic Development Canada. Rural Economic Development.
Canadian Institute for Health Information. A profile of physicians in Canada, 2025
Statistics Canada. Census in Brief, 2022.
Canada Revenue Agency. Statistical report on the participation of the hard-to-reach populations in the tax and benefit systems, 2024.
Canada Revenue Agency. Approximately $1.4 billion in uncashed cheques is sitting in the Canada Revenue Agency’s coffers, 2022.
UK Parliament. Who is experiencing food insecurity in the UK? 2024.
Government of the United Kingdom. Tackling Child Poverty: Developing Our Strategy, 2024.
Government of the United Kingdom. Guidance: Holiday activities and food programme 2024, 2025.
Government of the United Kingdom. Government unveils plans for next generation of new towns, 2025.
Ministry of Health. New Zealand Health Survey, 2025.
USDA Economic Research Service. Food Security in the U.S. – Key Statistics & Graphics, 2025.
USDA Economic Research Service. SNAP in Action, 2025.
USDA Economic Research Service. Measuring the Effect of SNAP Participation on Food Security, 2025.
Johnson-Green and Claflin. Gender and Racial Justice in SNAP, 2021.
USDA Economic Research Service. WIC Program | Economic Research Service, 2025.
USDA Economic Research Service.
Key Findings
Gas is critical in our best—and worst—case scenarios for global energy systems. Gas will be vital as a transition fuel in a ‘Decarbonizing World’ before declining by the late-2030s; and as an energy security cushion in our worst-case scenario, that we call ‘Dystopian World’.
Gas can anchor G7+’s energy security—but needs work. For G7+ consumers, it can reduce dependence on Russia in the near-term and avoid boom-bust cycles. In the longer term, it opens up promising new markets for G7+ producers. But the commodity is geopolitically problematic, too expensive in certain regions like Asia, and deemed too carbon-intensive. The G7+ can help overcome those hurdles.
Gas can help address, but also worsen, climate change. Achieving net-zero before the 2060s is challenged. But the G7+ can advance policies and technologies that catalyze carbon capture, accelerate methane intensity reductions, and encourage the development of low-carbon alternatives such as ammonia and hydrogen. That would help limit global temperature rise to around 1.7-1.8 Celsius compared to pre-industrial levels.
The G7+ could emerge as the most influential LNG player. By 2040, LNG exports from the U.S., Canada and Australia can power G7+ economies and also ship gas to emerging Asia, as we outline in our ‘Democratic World’ scenario. It’s an opportunity for G7+ to expand its geopolitical influence and forge stronger ties with emerging markets.
Global LNG export capacity may need to rise by nearly 50% by 2040. Current export capacity and supply under construction is insufficient to meet the needs and aspirations of a rising global population and a world economy that will expand 42%, according to our ‘Divided World’ scenario.
G7+ compact can help unlock financing for LNG projects. It could facilitate funding from a range of financial institutions, including multilateral development banks and national export credit agencies, that have excluded natural gas investment for fear of “locking in” emissions.
Exporting gas would require US$1.2-trillion in investments in North America alone. A build-out of the continent’s gas infrastructure would likely require around US$1.2 trillion over the next 15 years. But it would require supportive policies and clear frameworks for communities and corporations.
The Long Game for LNG
Welcome to the 2040s.
In the decade that will take us to the mid-century, our world will be very different, and so will our energy needs.
The planet will be home to at least a billion more people, with a population well over nine billion. The world’s economic output, if it follows recent decades, will add the equivalent of another U.S. economy, spread largely across Asia and the global south, with all the energy demands that go with it. Add to that something entirely new—the world of artificial intelligence at mass scale, with computing needs that, for now, seem incomputable. By one estimate, we will need 4,000 more terawatt hours of power to run this emerging data centre economy; that’s equivalent to 15% of the world’s electricity generation today.1
Another step change in energy demand may require more of every practical and affordable energy source, but the greatest expectations may be placed on natural gas. It’s expected to become the world’s dominant energy form, surpassing oil, having already grown in supply by 70% in the first quarter of the 21st century.2 The advent of liquefied natural gas, and supertankers to carry super-chilled LNG across oceans, has transformed the gas outlook even more. In a little over a decade, the United States has transformed itself from amongst the world’s largest gas importers, to the world’s largest LNG exporter.
As oil was to the 20th century, gas may be as critical to the 21st, but not without strategic choices that are already challenging the world. Russa’s invasion of Ukraine, and its weaponization of gas to weaken Europe, is just one indication of how the world’s rapidly growing reliance on gas has put energy security at risk. Rapidly growing and urbanizing countries across much of the world have found their dependence on imported gas to present further risks. The West’s growing ambition to reshore manufacturing, and remilitarize, may require more gas, too, as a reliable and affordable concentrated energy source.
Few bodies may be better suited to address these challenges than the G7, the group of leading liberal democracies (the United States, Canada, the U.K., France, Germany, Italy and Japan) that is meeting June 15-17 in Kananaskis, Alberta. Atop the group’s agenda: energy security.
The G7 was formed 50 years ago, in the mid-1970s, in response to similar disruptions to the global economy caused by an oil shock and ensuing conflicts. Today, the alliance faces new challenges, particularly from China and Russia, and may find opportunities in reasserting itself through an approach to democratic and decarbonized natural gas for a fast-changing world.
Properly managed, the G7 and key allies such as Australia and South Korea, known as G7+, can create stronger alliances with emerging markets, especially in Asia, stabilize energy prices and strengthen long-term global growth. It could even provide a bridge to lower energy emissions, by displacing coal. Led by the European Union’s 107 million tonnes per annum (mtpa) and Japan’s 64 million mtpa of LNG consumption, the G7+ consumes 227 mtpa, or 51% of global demand. That exceeds the 179 mtpa currently produced by the U.S. and Australia.
By 2040, however, the G7+ gas trade balance could reverse such that its supply far exceeds the demand of its members and allies—by almost 150 mtpa—requiring the Western-led alliance to secure new markets. China is expected to be, by far, the largest purchaser of LNG in 2040 (163 mtpa, from 79 mtpa in 2024, according to Rystad Energy’s base case). But trade frictions with North America could result in Chinese LNG imports diversifying away from American sources.
For the G7, other allies will be critical to ensure a greater balance between supply and demand. India is often seen as a vital long-term prospect for G7+ exports, with projected demand of 63 mtpa. But other emerging Asian markets such as Pakistan, Bangladesh, Thailand and Indonesia will be essential, too, as they’re projected to consume a combined 219 mtpa by 2040. In a potential world where the Chinese market is inaccessible to the U.S., and India follows its own path—prioritizing price above all else, perhaps from Russian supplies—Asian demand will be vital to any G7+ strategy.
With all these forces at play, the world almost certainly will need more gas in 2040—but just how much will be needed?
To map out potential pathways, RBC Thought Leadership and Oslo-based Rystad Energy developed a novel research methodology to outline plausible scenarios for the 2040s, knowing the trajectory of growth will be critical to the mid-century condition of our world. Each was shaped by geopolitical alignments, climate policy ambitions and market dynamics. We then worked with a range of policy experts to assess the risks in each scenario, and develop broader policy options.
The outcomes suggested by each scenario are profoundly different. The range of our pathways shows that total global gas exports could grow from 411 mtpa in 2024 to as high as 737 mtpa by 2050—or shrink to just 366 mtpa. The net swing of 371 mtpa is nearly equivalent to current LNG exports.
The difference depends on whether the world develops more structured markets for gas, finds ways to connect fast-growing markets with reliable (and democratic) suppliers, and invests in technologies to cut emissions. The environmental attributes of this future gas supply—including the scale of transition to capture carbon and low-carbon derivative fuels like hydrogen and ammonia—will have a major impact on the direction of climate change, as methane emissions from gas are widely considered to be more dangerous to global warming than carbon, even though they’re also easier to contain.
A Role for the G7+
The G7+ nations have an interest in securing long-term supplies of reliable and affordable natural gas, having experienced price shocks from the Western U.S. power crisis of 2000-01, the post-Fukushima disaster LNG price spike in Japan, the recent twin shocks of the Covid pandemic and Russia’s weaponization of gas exports in its war on Ukraine. A coordinated G7+ approach can stabilize markets through more cohesive policy alignment and joint investments around infrastructure.
Leveraging democratic, rules-based gas markets can ensure environmental standards across the supply chain, and further add to economic growth through industrial decarbonization, including investments in carbon capture, utilization and storage (CCUS), low-carbon fuels for industrial heat and heavy transportation, and a coordinated action plan on zero flaring and mitigation of fugitive methane emissions.
In a potential world where the Chinese market is inaccessible to the U.S., and India follows its own path—prioritizing price above all else, perhaps from Russian supplies—Asian demand will be vital to any G7+ strategy.
As such, emerging Asian markets including Pakistan, Bangladesh, Thailand and Indonesia, will be essential for the G7+ as they’re projected to consume a combined 219 mtpa by 2040, especially as they accelerate the switch from coal to natural gas.
To do all this, a G7 gas compact may be needed to lay the foundation for a robust and secure natural gas infrastructure that aligns with the needs of producers and consumers, delivering price stability, affordability, reliability, and lower greenhouse gas emissions. Such a compact could address the needs of a rapidly growing global gas world to develop more sophisticated markets and financial tools; to resolve infrastructure bottlenecks and coordinate national investment plans; and work collectively to ensure rapidly growing countries across Asia, Africa and Latin America have access to G7+ supplies, not only for economic growth but for geopolitical stability.
But the G7 and its core allies need to recognize the risks of some very divergent paths if a coordinated approach is not taken. Our modelling lays out four such outcomes.
Behind the scenes—our research approach
The research and methodology behind this paper is unique for three main reasons:
The research paired quantitative modelling with qualitative interviews and roundtable forums, including with senior officials in Canada’s federal and provincial governments, the private sector, Indigenous groups, international research institutions and multilateral development banks. The team engaged these experts individually and as part of convenings in Washington D.C., Vancouver, Ottawa, London, Beijing, New York, Calgary and Toronto.
RBC Thought Leadership spoke to more than 100 experts in Canada, the U.S., Japan and Europe to explore practical energy security solutions. These included representatives from the Asian Development Bank (ADB), the Bloomberg New Energy Finance (BNEF), Mokwateh, the First Nations Climate Initiative, Dr. Robert J. Johnston, Senior Director of Research, at the Center on Global Energy Policy, Columbia University, and Dr. Ken Koyama, Senior Managing Director, Chief Economist at the Institute of Energy Economics, Japan (IEEJ). RBC Thought Leadership partnered with Rystad Energy to collaborate on the data and modelling for this research.
The four scenarios were modelled for the purposes of developing robust recommendations for the G7+ heading into the Kananaskis meeting in June. We know that traditional forecasting methodologies fall short of capturing the complex drivers of change in our geopolitical landscape and energy systems. We mapped these drivers of change and developed a range of four distinct yet plausible futures against which to stress-test what a coordinated G7+ natural gas strategy could look like.
The World of 2040: Four Very Different Scenarios
The scenarios are built on different variations of key drivers in the G7+ environment, including geopolitical stability, population and economic growth in emerging markets, digitization and data centre deployment, climate and energy policies, the role of international institutions and multilateral forums, fossil fuel production, manufacturing and supply chain distribution, the role of civil society, social cohesion and global gas demand.
Among our assumptions that span all four scenarios:
The world’s population will be approximately 9.2 billion, with significant regional variation depending on GDP, education and healthcare trends;
coal consumption will continue to decline in OECD countries;
continued growth of coal in Asia will offer significant potential for coal-to-gas switching;
oil will remain a dominant fuel for the transportation sector, particularly in emerging Asia;
nuclear generation will continue to have a strategic but overall minor role to play into the 2030s, with new builds expected in Asian markets such as China and in the U.S., particularly to meet growing demand from data centres;
renewables will enjoy exponential growth, particularly in solar and wind, as costs continue to decline;
global temperatures are expected to be anywhere from 1.8-2.2 degrees Celsius above pre-industrial levels.
The following scenarios are by no means a prediction of what the future will look like in 2040, rather, they represent a range of plausible futures.
Four Scenarios
Headline of the year: “Japan and China resilient to global gas price shocks”
Fragmented, protectionist world order, with a further erosion of international institutions and growing influence of Russia and China as global powers.
Australia, Russia, Qatar and the U.S. dominate global gas production; concentrated gas supply subjects the G7+ to significant market risks and volatility as a supply gap emerges.
Technology growth is regionalized with China and the Gulf nations leading in AI and digital infrastructure that matches North America, driving gas flows to non-G7 markets.
Context
Divided 2040 is characterized by protectionism and regionalism, as the superpowers continue to recede from global alliances, opening the door to a world dominated by Russia for energy and resources, and China for technology and manufacturing. Concerns about energy security in the mid-2020s and early 2030s are now exacerbated by supply and affordability challenges. Multilateral institutions and alliances such as the G7 have limited influence over state actors. The U.S., China and other major global players have receded from international institutions and alliances, further embedding realpolitik and an increasing focus on national policy and borders. Energy security is one of the world’s primary concerns and has had a deep impact on emerging markets’ ability to industrialize and develop economically. A current boom-bust cycle leaves consumers exposed to volatile prices, while major producers such as the U.S., Qatar, Russia and Australia are vulnerable as customers avoid signing long-term contracts. As countries focus on addressing immediate energy security challenges, climate activism has given way to more extreme and violent civic action.
The Global Energy Story
Total power demand is up 66% in 2040 compared to 2025, driven by the industrialization of emerging markets, electrification of transportation, heating and industrial processes. Countries prioritize the deployment of energy systems based on renewables and clean energy sources such as nuclear and hydro, and while natural gas remains an important transition fuel, reliance on fossil fuels declines globally.
Global climate action from the late 2010s and early 2020s has slowed considerably, with only a handful of European countries strongly dedicated to the cause. While this world remains divided, climate progressivism still endures. Global companies and capital remain directionally committed to a net-zero target. Emissions, on a gradual decline for the remainder of the century, are due to hit net-zero by 2096 as temperatures are limited to 2.0C, an outcome marginally out of bounds of the Paris Agreement.
South Korea and China continue to lead as technology innovators and providers, while other nations are falling behind in the AI revolution and remain mere buyers of those technologies. Global data centre energy demand is about six times what it was in 2025. Technological development is increasingly influenced by regional powers, leading to divergent standards and ecosystems. This fragmentation hampers global interoperability and exacerbates geopolitical tensions. Efforts by Gulf nations to fast-track AI infrastructure deployment as set out in the mid-2020s have come to fruition. The UAE continues to have the highest public cloud spend per employee in the region and is now firmly established as a global AI leader, with Saudi Arabia and Singapore also in the forefront. Given China’s diversification of gas supply and acceleration of domestic production efforts in the mid-2030s, the Gulf and China are strong rivals to the G7 nations when it comes to clean technology innovation and digital infrastructure.
The LNG Story
The world needs to find 207 million more tonnes of LNG by 2040, relative to current capacity and supply under construction. Industrialization of emerging markets like Indonesia and India has been constrained due to the lack of affordable energy supplies. The rise of technological infrastructure in South Korea, China and the Gulf, however, provides a strong demand signal for consistent, growing natural gas demand that peaks in 2038. A supply gap emerges, and gas consumers are subject to market volatility with pricing predominantly influenced by incumbent suppliers—the U.S., Russia, Qatar and Australia—that hold a concentration of supply. The U.S. remains the world leader, bringing on more LNG than Russia and Australia through the 2030s. Other members of the G7+ are subject to market volatility as prices fluctuate, controlled by leading producers and subject to regional market disruptions.
Technology leaders such as South Korea, India and China remain dependent on non-democratic sources such as Russia for the majority of their energy supply to power data centres and digital infrastructure. The global landscape of AI data centres and digital infrastructure, ownership and operation are led by technology leaders. And while developing nations still gain access to AI tool sets, they have little say in setting standards and experience increasing bias and unfair terms from technology providers.
Headline of the year: “Indonesia’s new robot factory stalled by global gas shortage”
Rise of regional conflicts and a global economic downturn in the late 2030s has led to a highly fragmented world.
Fossil fuel dependence continues to rise alongside rising demand for LNG.
With a significant energy supply gap emerging, Gulf states experience major growth.
Energy security dominates policy agendas, distracting from climate action, while national agendas prioritize trade weaponization and geopolitical leverage in the interest of security.
Context
In Dystopian 2040, regional conflicts and a protracted global economic downturn experienced in the late 2030s have led to an erosion of international institutions and the post-WWII global order. International protocols around the rule of law and global security are unenforceable and stuck in a quagmire of indecision and veto power. A failure of any country or international institution to meaningfully act in the face of growing aggression out of occupied Ukraine and the Middle East has resulted in violent and authoritarian regimes redefining the world stage. In economies like the U.S., fearmongering, protectionism and hardline authoritarian rhetoric has led to a declining global presence. The EU is dominated by protectionist policies, focusing on local economies and a handful of key trading relationships to buffer the impacts of regional conflicts. Security dominates national policies and agendas, with nationalist policies creating a bifurcated trade and investment climate. China’s imposition of export restrictions on rare earth elements in the mid-2020s set the stage for a growing trend of supply chain control, particularly in technology and defence sectors. As a result of closed borders and bloc-style co-operation, international trade is limited to small clubs of countries, who limit market access, building on the techno-nationalist policies of the late 2020s to bolster independence from foreign supply chains and competitiveness on semiconductor production. Rising unemployment due to a global economic downturn and a growing technological divide means that there is a rift among those who have access to digital infrastructure and those who do not. In a world where civil society and institutions are characterized by high levels of mistrust and a lack of coordination, the G7 struggles to build energy resiliency and withstand periodic energy supply and demand shocks.
The Global Energy Story
Climate change, alongside regional and protracted conflicts, creates fresh waves of humanitarian crises. The phrase “energy transition” has almost been forgotten, while national security agendas dominate the narrative around energy systems. Global sentiment is heavily tied to energy security, driving demand for low-cost fossil fuels such as oil and coal, at the expense of managing emissions. Fossil-fuel rich Gulf nations experience significant growth as they support Asian economies, and unlock a wealth of state capital increasingly oriented towards a data economy. Globally, increased nationalism and national security concerns lead to a decline in multilateralism. Coalitions like the Paris Agreement fade in significance as the pursuit of cheap energy and economic recovery dominate priorities. The weaponization of trade becomes a common occurrence—even an expected phenomenon as the competition between nations spreads into new spheres. Expect increased militarism and protectionism.
The LNG Story
Natural gas demand is up 16% from 2025 levels. These numbers are tempered by demand for other cost-effective fossil fuels like coal, which remains a core part of energy systems (22% of total primary energy). Global fossil fuel demand continues to rise beyond the original 2030 projections with no sign of slowing into the 2040s. As climate goals take a back seat to national security, coal-to-gas switching in Asia does not play out as predicted in the late 2020s. Energy and national security challenges lie ahead, with projected supply shortages limiting global economic growth. By 2040, an incremental 225 million tonnes of LNG—equal to over half what the world produced in 2024—is required on top of current and in-construction supply.
Headline of the year: “G7 Methane Club Declares Victory at 15th Anniversary of Kananaskis”
Climate security dominates global policymaking, with aggressive emissions reduction targets.
Global power demand more than doubles, driven by industrialization and digital infrastructure. Renewables and clean-tech solutions take the lead to meet demand.
LNG demand declines, presenting the risk of stranded assets.
Remaining gas supplies are governed by the emergence of a clean gas market, with methane performance tracking to meet demand for abated natural gas.
Context
In Decarbonized 2040, aggressive climate policies and targets dominate the international landscape, as the world’s leading economies race to cut emissions and secure a more cost-competitive energy supply. Climate security is the pre-eminent focus shaping energy policies as destructive climate events became increasingly difficult to ignore by the 2030s, shaping voter preferences and civic action, and leading governments to re-invigorate global cooperation and international institutions. There is a meaningful return to global climate targets and the creation of new market mechanisms to unlock value from decarbonization. This includes the emergence of a clean fuels and certified natural gas market, underpinned by the measurement and tracking of methane emissions. Carbon capture is on track to reach three billion tonnes sequestered by 2050, equivalent to four times Canada’s total emissions in 2025. Millennials and GenZ, now in critical leadership roles in organizations, are driving the decarbonization agenda across governments and institutions. Civil society, too, is characterized by strong, diverse voices who are active in holding institutions accountable to their climate commitments.
The Global Energy Story
Total power demand is up 66% in 2040 compared to 2025, driven by the industrialization of emerging markets, electrification of transportation, heating and industrial processes. Countries prioritize the deployment of energy systems based on renewables and clean energy sources such as nuclear and hydro, and while natural gas remains an important transition fuel, reliance on fossil fuels declines globally.
While China has maintained its position as a clean technology manufacturer and intellectual property leader, the West’s investments in clean technologies through the 2030s begins to pay off, with a more distributed global supply chain that leads to greater resiliency and lower costs.
Countries that developed small modular reactors (SMRs) in the 2030s—Canada, the U.S., Argentina, Poland, Romania and China—are exporting that expertise around the world to countries seeking clean and reliable energy. Electrification is a clear winner, too, allowing for the displacement of direct-use emissions and an increase in energy efficiency. Oil demand falls almost 60% from current levels to 43 million barrels per day by 2050—a level not seen since 1969. Natural gas demand, while falling, remains more resilient, down 33% from current levels.
The LNG Story
The maturity of carbon markets, border adjustment mechanisms and a “methane club” across G7+ buyers and sellers drives a robust certified natural gas market. Throughout the 2030s, governments and industry leaders worked to develop clear and transparent market regulations, as companies were incentivized to reduce methane emissions and sought to differentiate themselves based on performance. National regulations in G7+ countries are grounded in a multilateral G7+ natural gas strategy, which enables global trade and methane measurement. Significant innovation around satellite technologies has enabled more effective methane tracking and robust data sets, enabling greater consistency of methane tracking than the world saw in the 2020s. There is a risk that existing LNG infrastructure becomes stranded, as the world’s leading economies shift to alternative energy sources and LNG demand declines. Global LNG demand declines rapidly by 2040 such that the world does not require any net new LNG by 2050 relative to existing and in-construction supply. Existing natural gas supplies from G7+ sources have a competitive advantage among climate-minded buyers looking for hydrogen/ammonia and abated gas. Multilateral development banks like the Asian Development Bank have supported energy efficiency improvements in gas distribution and gas power plants as well as coal-to-gas switching projects in Asia.
Net-zero likely occurs in the mid 2070s, with a projected temperature rise of 1.8C. However, further efforts such as requiring a 30% decrease in carbon intensity of natural gas production post-2030 could result in a further 40-45 billion tonnes of incremental CO2e avoided in this scenario by 2100.
LNG: An opportunity for reconciliation
Canada’s LNG opportunity cannot be capitalized without Indigenous partnerships and participation. Most of the land connecting the country’s major gas fields to the Pacific Coast are unceded territory, claimed by, or ratified through, treaty to First Nations in British Columbia. This is a huge opportunity for reconciliation—one that’s already being slowly realized. Cedar LNG and Ksi Lisims, two West Coast projects that will add 15 mtpa to Canada’s export capacity, have significant Indigenous ownership through the Haisla and Nisga’a Nations, respectively. By cultivating meaningful Indigenous partnerships and developing models for Indigenous capital, capacity and consent, LNG can be an opportunity for shared prosperity, while allowing Canada to meet the moment and expedite major projects quickly.—Varun Srivatsan
Headline of the year: “G7+ agreement to connect Earth with low-orbit data centres”
The world is dominated by coalitions of like-minded nations, and multilateral institutions are reinvigorated.
A dual-energy trajectory emerges as renewables scale rapidly with global climate funds while LNG demand continues, driven by Asian industrialization and coal-to-gas switching.
Global supply chains and trade are more evenly distributed and resilient, with the G7+ coalition solidifying its influence in LNG and manufacturing in an effort to counter China’s dominance over supply chains.
Context
In Democracy 2040, the world features strong coalitions among like-minded nations, with a growing effort to counter the fragmentation seen in the late 2020s and early 2030s. Multilateral institutions are experiencing a renaissance, undergoing a shift in their governance and structures to address frequent and critical global challenges. There are a few dissenting and regionally-focussed nations, as we saw during a decade-long retrenchment of international institutions that continued through the late 2020s and early 2030s. The international landscape is now dominated by coalitions of democratic countries in the G7+ to counter China and Russia, and ensure resilience in critical sectors of the economy such as advanced manufacturing, defence and energy. The most recent G7+ Agreement enables G7 gas importers and allies such as South Korea to secure gas supply for power data centres and digital infrastructure needed to power the next generation of AI technologies. As renewables continue to scale, gas has a critical role to play to serve demand peaks in big cities and support resiliency of electricity grids. The G7+ cooperation on natural gas has reduced gas market volatility, compared to the 2020s. Without a robust clean gas market, however, tensions remain between EU countries and the rest of the G7 members, who have compromised on meeting emissions targets in favour of affordability and resiliency. The global public square is robust in democratic countries, with civil society organizations advocating for greater collaboration and cooperation between countries with shared values and renewed commitments to bold climate goals. However, system-level oppression of civil society actors and voices in non-democratic states creates a global divide between liberal democracies and the rest of the world.
The Global Energy Story
Progress on climate is slow to start in the 2030s, but the Green Climate Fund is beginning to have real impact on climate mitigation and climate action. Contributions from both the global south and the G7+ mean that in 2040, the Fund has reached $800 billion worth of leveraged investments with a total of 25 billion tonnes of avoided emissions. The Green Climate Fund is only one example of a general sentiment that shifting away from fossil fuels is inevitable and renewables’ share of the global energy mix continues to increase exponentially. The rapid adoption of cost-competitive renewable energy sources and the G7+’s coordinated strategy on natural gas helped the West secure energy supplies for rapidly growing economies like Indonesia and India.
Global trade and supply chains are diversifying in 2040 through international and regional trade agreement. Mutually beneficial friendshoring and reshoring in a systematic, orderly fashion provides policy certainty and unlocks capital for critical infrastructure. For the G7+, diplomacy among its members helps develop common ground for climate-minded economic growth, which in turn secures its geopolitical presence in South and Southeast Asia, countering growing Chinese influence.
Technology leadership is spread across a range of competitive states, including continued leadership from China, the U.S. and the United Arab Emirates, as in the mid-2020s. But a renewed commitment to multilateral institutions has resulted in robust global pacts such as a Global Digital Compact that seeks to democratize access to AI and the energy sources needed to power a new data economy.
The LNG Story
Access to resilient natural gas supply through the G7+ coalition unlocks greater adoption of AI and energy needs for greater industrialization across Asia. Japan, Thailand, Korea, and India are major demand centres as an Asian renaissance dominates global LNG demand through 2050. LNG demand reaches 692 million tonnes by 2050—and is still rising as global economic growth drives demand. The climate impact of this reality is mitigated by the maturity of methane capture technologies and demand for abated gas by ethical buyers like Japan. However, a global clean gas market hasn’t emerged in the way experts predicted in the late 2020s. Clean gas market mechanisms are adopted by smaller coalitions of states and in bilateral or multilateral trading relationships. Growing carbon markets among the G7+ ultimately enables both energy transition and greater gas supply, which allows for growing natural gas demand rooted in significant coal-to-gas switching in Asia. While the G7+ coordination on a natural gas strategy enables access to resilient supply and demand within these countries, China continues to play a significant and growing leadership role in clean technologies and manufacturing, posing a major risk to the G7+ who actively seek these technologies to meet their climate commitments.
The Kananaskis Agenda: An Action Plan for Natural Gas
As the G7 host and the world’s fifth-largest natural gas producer, Canada is uniquely positioned to shape the future of natural gas by advancing its own economic and climate goals and supporting global energy security.
But there are several roadblocks that’s holding back natural gas. First, G7+ member nations — the core group plus allies like Australia and South Korea — are not aligned on gas’s role in the future of energy markets. Major producers like Canada and the U.S. need contract security to build up infrastructure and strategic supply. But consumers such as France, Japan and Britain want contract flexibility and diversified supply sources to hedge their risks and meet climate targets. Another layer of complexity comes with Canada, Germany, Italy, Japan and the U.S. favouring natural gas, while France and Britain support greater use of hydrogen, nuclear and abated gas to achieve climate goals. Moreover, climate-minded governments in Australia, Canada, France and the EU also don’t see eye-to-eye with the U.S., which sees fossil fuels driving its energy dominance.
A coordinated and cooperative policy framework adopted by G7 members can facilitate the creation of a more resilient natural gas and LNG market that reduces price volatility, unlocks capital, increases diversified supply and de-risks demand, and enables the eventual transition to a decarbonized gas market.
Here are some action-oriented approaches that could help the G7, through its energy ministers, move toward a democratic and decarbonized future for gas:
1. Declare a G7 compact to support decarbonized natural gas
A G7 policy compact that defines the role of natural gas and related fuels across a range of energy demand scenarios can help break the boom-and-bust cycle of prices and investment. It can also signal investment and financing of gas infrastructure sufficient to meet the expected supply gap identified in three of the four scenarios outlined in this paper.
G7 governments should also work to end the debate over whether natural gas is a solution or contributor to climate change. It’s both. In the short to medium term, coal-to-gas fuel switching, methane intensity reduction, and deployment of gas as an intermittency solution for renewables make a significant contribution to climate action. Over the longer term, governments need to work with industry to secure a commitment to new pathways to develop abated natural gas pathways, which may be required across all scenarios.
2. Develop a stable, well-functioning global gas market
The LNG market has evolved dramatically over the past decade, from a series of regional markets anchored mostly by long-term, oil-indexed contracts to something more dynamic and global.
In these ways, the LNG market is starting to resemble the global oil market which has become deep, resilient and highly liquid since the 1980s, offering a wide range of contracts, price benchmarks, and risk management tools for both physical and financial markets. These features mean that oil prices, while volatile, have a greater capacity to absorb shocks and rebalance.
Despite progress, the LNG market still has a ways to go to become sufficiently global and liquid to attract price-sensitive importers and risk-averse capital providers. Price spikes in 2022, in the midst of the Russia-Ukraine conflict, were dramatic and damaging for consumers, leading to a rebound in coal demand in Asia and shut-ins of gas-intensive industrial production in the EU.
A key feature of a G7 gas compact should be to further develop a tradeable market with both financial and physical participants, which in turn derisks capital, reduces capital costs and incentivizes further investment. More financial, or non-commercial participants, can help expand liquidity and bring in new pools of capital.
The global LNG market also needs effective and transparent reference prices. The emergence of such benchmarks with variance in duration and indexation can anchor a well-functioning market. This includes the ability to structure contracts to trade LNG cargoes using a range of markers across varying periods of time to avoid exposure to a single formula based on Henry Hub or Brent benchmarks. G7 countries should look to build on existing efforts such as the Japanese-led Producer-Consumer Dialogue.
Methane-tech: Reining in a potent gas
Natural gas is predominantly made up of methane, a powerful greenhouse gas. Lowering methane emissions in the LNG value chain—from wellheads to carriers to regasification terminals—is seen as a key driver of environmental performance for companies. This is especially critical as methane is 28 to 36 times more potent than CO2 over a 100-year timespan.
Several technologies can help plug leaks from LNG infrastructure: this includes tech that can detect (through satellites, airborne and on-ground sensors), contain (through vapour recovery units, low-bleed pneumatic devices), or combust (high-efficiency flare stacks) methane. Emissions can also be reduced by replacing gas-powered devices such as compressors with electricity driven equivalents, freeing up the gas for shipment.
Several technologies and policies are already making a difference. In the U.S., methane emission intensities dropped across natural gas processing (30%) and transmission and compression (33%) facilities between 2014-23, according to Environmental Protection Agency (EPA) data. Norway, meanwhile, has the world’s lowest emissions intensity driven by policies such as a ban on non-emergency flaring as far back as 1971, and a venting and flaring emission tax imposed in 2015.
However, precise measurement of methane emissions remains a challenge, with estimates subject to widespread uncertainty and underreporting. As methane measurement advances (for example, through satellite-based monitoring, of which more than a dozen satellites are in orbit today), operators and regulators can further constrain emissions, lower measurement uncertainty, and take appropriate mitigating action.
Some methane mitigation technologies can also allow oil and gas producers to capture methane and feed it back into the gas chain to lower emissions. In North America, for example, leak detection and repair (LDAR) technologies and improved equipment maintenance practices can conservatively avoid up to 55 million metric tons of carbon dioxide equivalent (MTCO2e) in methane emissions annually—the equivalent of taking 13 million gas-powered cars off the road.-Vivan Sorab
3. Invest in decarbonization to cut emissions with new technologies
A G7+ gas compact should not be an endorsement of business-as-usual practices. Action on methane mitigation is critical alongside pathways to carbon-neutral fuels derived from natural gas.
The elimination of fugitive emissions and routine flaring/venting from the natural gas value chain is embedded in the Global Methane Pledge, which is central to the natural gas industry’s hopes to be aligned with a low-carbon future. It can be business-friendly, too, as mitigation costs are generally low and even net-positive in cases where fugitive gas can be captured, processed, and sold.
The G7 can play a critical role in supporting the deployment of measurement, monitoring, reporting, and verification (MMRV) protocols for methane emissions. The EU is leading such efforts through the rollout of its Methane Regulation, which requires the energy sector to document the methane intensity of fossil fuel imports, as a precursor to implementing a shift to lower methane-intensity fuels. This can be a differentiator for LNG sources, and involve major consumers such as Japan and South Korea to adopt regulations similar to the EU, while producers like Canada, the U.S., and Australia align on timelines and technology/policy pathways for rapid reductions in methane intensity.
The pathway to carbon neutral fuels should include the application of carbon capture and storage (CCS) technology to the production of ammonia, methanol, and hydrogen products. CCS technology will also be integral to preserving long-term demand security for natural gas in power generation as industrial production decarbonizes.
Energy security generally depends on the diversification of energy sources by fuel, technology, and geography. Clean electricity is essential to achieving a low-carbon economy, but maintaining a diverse, resilient system will require other sources including nuclear, bioenergy, offsets, and carbon capture. Low and zero carbon fuels can also support the decarbonization of industrial production processes such as steel and cement production that require higher temperatures. Canada and the U.S. can also partner with G7+ countries to decarbonize bunker fuel markets by switching to ammonia or methanol. Recent data from China shows a pathway to displace diesel in trucking with LNG, a pathway that could further evolve to clean hydrogen.
4. Promote new financing tools for developing economies to invest in clean growth
LNG’s status as a fossil fuel and its inherent price volatility as a commodity, along with its capital-intensive nature, presents project financing challenges. Developing countries tend to require large-scale infrastructure to import and store LNG and convert it from liquid to gas, to be shipped to internal markets. Most require concessional financing. A clear G7+ policy signal, providing greater acceptance of natural gas can unlock financing across a range of institutions, including multilateral development banks like the International Finance Corporation (IFC) and European Bank for Reconstruction and Development (EBRD), national export credit agencies such as Export Development Canada and private sector banks and asset managers that have excluded natural gas investment for fear of “locking in” emissions or being misaligned with Paris Agreement objectives. Supportive policies should stress the above-mentioned compact among G7 member states and commit to derisking and decarbonization the natural gas sector.
The continued evolution and progression of Article 6 of the Paris Agreement and the use of Internationally Transferred Mitigation Outcomes (ITMOs) such as Japan’s Joint Crediting Mechanism (JCM) also provide avenues for new financing methods based around the transfer of carbon credits generated from investments in methane reduction, coal-to-gas switching, or bunker fuel to clean ammonia.
However, the current Article 6/ITMO framework is not fit for purpose for natural gas or for trade between developed countries. Nonetheless, the spirit of “carbon clubs”—and creating shared incentives for natural gas-linked carbon reduction projects among G7 members—could be used to create financeable revenue streams for projects. These measures could be further complemented by programs such as Japan’s GX bonds, and South Korea’s climate funds could also co-finance LNG aligned with energy security and emissions transitions.
The use of certified natural gas can further demonstrate a clear pathway to decarbonization and alignment on values within G7+, in turn reducing project finance risks and improving project economics through enhanced pricing and offtake, and enabling access to transition finance.
Japan’s Emissions Trading Opportunity
Launched in 2023, the GX-ETS is a central component of Japan’s strategy to achieve carbon neutrality by 2050 and support industry decarbonization through a phased approach. Auctioned carbon credits support the repayment of Climate Transition Bonds (GX Bonds) which support transition-focused spending in areas such as hydrogen, ammonia, carbon capture, and EV infrastructure. These sovereign bonds aim to raise approximately ¥20 trillion (US$150 billion) by the early 2030s, catalyzing greater capital mobilization of approximately ¥150 trillion (US$1 trillion) in public and private investments.
While its focus is on domestic decarbonization, Japan has expressed interest in securing clean energy and low-carbon supply chains abroad and in funding the development costs of clean technologies.
Canada can benefit significantly by aligning its clean fuel exports—especially LNG and hydrogen—with Japan’s GX goals, provided projects meet Japan’s standards on carbon intensity, transparency, and reliability.
Here’s how:
Japan’s GX policy accepts low-carbon LNG—particularly if paired with methane abatement, CCS, or certified emissions standards—as transition-aligned. Canadian LNG could qualify for long-term GX-aligned supply contracts, if emissions reductions are verifiable.
Japanese investment via GX Transition Bonds, especially in infrastructure such as liquefaction and CCS-enabled transport. The country is already engaging Australia and other countries for clean ammonia. Canada’ low-carbon certified energy products can tap several opportunities including financing through GX Transition Bonds and Japan’s Joint Crediting Mechanism (JCM)—a bilateral initiative launched by the government to facilitate GHG emission reduction in collaboration with partner countries.
Canada can also participate in Japan’s plan to scale imports of green and blue hydrogen and ammonia for power and industrial use, given Canada’s potential to produce green hydrogen, and several hydrogen hubs under development in Alberta and Newfoundland and Labrador. Blue hydrogen, through natural gas with CCS potential, could emerge as another opportunity.
Japan’s economy also needs power to maintain its edge in computation and digital infrastructure. Data centres, AI and digital infrastructure are going to depend on natural gas. — Robert J. Johnston.
5. Create a Centre of Excellence to share market insights, technologies and best practices
The U.S. and Canada have strong incentives for cooperation on natural gas. The two countries have deeply integrated domestic markets, growing demand for gas-fired electricity to support reindustrialization and data centres, and a shared need to ensure growing exports do not lead to higher prices at home. Increasingly, as LNG exports from North America grow, the incentives for cooperation and coordination across the G7+ loom large.
The G7+ can advance these interests through a new organization to provide follow-on technical and policy action to support the implementation of a decarbonized and derisked natural gas market. Canada would be an excellent location for such a centre, given its role as the host of the 51st G7 leaders’ summit, longstanding commitments to climate action, technical expertise in horizontal drilling, methane capture and electrification, and growing role as a producer.
The Centre could sponsor technical, applied research in areas like methane mitigation, lower cost ammonia and hydrogen fuels. Equally important would be policy research and financial innovation supporting areas such as regulatory project assessment, community benefits sharing, methane MMRV, and sustainable/transition finance to support developing countries. The Centre could further embrace analysis of carbon market development, including markets for certified natural gas.
A G7 Centre of Excellence would be a clear signal from the world’s leading natural gas producers and consumers of their commitment to a derisked and decarbonized global gas market.
Certified gas: The gold standard
Several natural gas certification programs underwritten by independent third parties have emerged in recent years. North American operators Project Canary, Equitable Origin (EO), and MiQ (Methane Intelligence) play a meaningful role in certifying the carbon, environmental and human-rights credentials of natural gas.
In North America, about 30% of natural gas is currently certified to EO and MIQ. A third of production from Canada’s Montney basin is certified, as is two-thirds of contracted supply of the soon-to-launch LNG Canada. Over half the production from the Utica and Marcellus in the northeastern U.S. is certified as well.
For methane, where leaks often go unreported, producers certify natural gas volumes to MiQ as a way of highlighting the low carbon pedigree of their molecules. Additional environmental and social performance aspects that exceed regulatory minimums such as Indigenous equity participation and water use minimization are captured under the EO standard, largely consistent with disclosures that would be required under the EU’s emerging Corporate Sustainability Reporting Directive. The theory is that that these environmental and social attributes would lead to higher prices or, at a minimum, better market access.
The certified market is in the early stages of development, but the outlook for certified natural gas and potential regulatory catalysts could drive a bigger, more liquid market. If enough countries jointly developed and implemented a methane-intensity requirement (or broader certification standard) that exceeded the volume of certified natural gas, then the value of the certifications would increase and further incentivize emissions reduction.
Finally, field-based audit by industry experts following increasingly well-defined assurance processes consistent with ISO and IFRS norms adds rigour and a paper trail to claims of higher commitment and associated performance on the ground. Certifications can also assist in reducing project finance and insurance risk premiums, improving project economics through the potential for enhanced pricing and offtake, and enabling access to transition finance. Dr. Robert J. Johnston
The Big 5: The power sources that fuelled the global economy over the past 25 years
Coal
2000: 24% of global market share 2024: 26% of global market share
Global coal consumption has risen 67% since 2000, with growth in Asia more than offsetting declines in Europe and North America. China alone accounted for 74% of Asian growth. While Chinese consumption is expected to decline, rising consumption in India and Southeast Asia means coal will remain a critical energy source in Asian economies.
Oil
2000: 37% of global market share
2024: 31% of global market share
Global oil consumption is up almost 30% since 2000, with China accounting for over half of global growth. North American and European consumption is largely flat, with growth primarily coming from emerging markets. Transport across road, marine and shipping has represented almost 80% of global oil demand growth since 2000. Still, oil’s dominance within global energy systems continues to fall.
Nuclear
2000: 7% of global market share
2024: 5% of global market share
Energy generation from the technology has remained relatively consistent over the past quarter century, with declines in the developed world offset by new capacity in China. New nuclear power plants proposed and underway in Asia, revival of nuclear power plants in Canada and Europe, and new reactor designs in the U.S., largely driven by the electricity needs of data centres, could offset historical declines in nuclear.
Renewables
2000: 10% of global market share
2024: 13% of global market share
Wind and solar generation has grown exponentially from negligible levels in 2000, boosting total renewables (including hydro and biomass) global primary energy market share to 13%. Growth in other renewable generation sources such as geothermal are also growing moderately.
Natural Gas
2000: 22% of global market share
2024: 25% of global market share
Gas has boosted its market share over the past quarter century on rising demand from several economies. The power sector’s shift from coal to gas has also spurred demand and helped lower emissions for several countries, including Canada. Since 2000, 50% of gas growth has come from the power sector. Another 12% from the energy industry and another 8% from the residential sector. As a critical feedstock for petrochemicals, gas was also at the centre of a plastics boom. The globalization of LNG markets, with several new countries building LNG import terminals, has also driven demand.
All data sourced from BNEF World Energy Outlook
The Growth Project
The report is part of RBC’s Growth Project, an initiative to spark new ideas for the Canadian economy. For more on the Growth Project, click here.
Sign up here to receive RBC Thought Leadership’s newsletter, flagship reports and analysis on the forces shaping Canadian business and the economy.
Authors Shaz Merwat, Energy Policy Lead Kathleen Gnocato, LNG Research Initiative Lead, Independent Consultant
Contributor Dr. Robert J. Johnston, Senior Director of Research, Center on Global Energy Policy, School of International and Public Affairs, Columbia University
Editor Yadullah Hussain, Managing Editor
Design and production Shiplu Talukder, Digital Publishing Specialist
All data from Rystad Energy unless otherwise mentioned. Rystad gas and LNG data is sourced from Rystad’s Gas and LNG Macro Solution module. Rystad energy and emissions data is sourced from Rystad’s Energy Scenario Solution module.
Please refer to Behind the scenes-our research approach section for more details on the research collaboration.
1. McKinsey & Co. 2. International Energy Agency 3.The Institute of Energy Economics, Japan, 2025 Outlook
Key Takeaways
Tackling Canada’s housing shortage will require $2 trillion in capital deployment over the next 5 years—that’s a 5X increase from current levels
Two taxation tools—tax-free municipal bonds for housing and infrastructure, and tax credits for affordable housing—have spurred housing supply in the U.S., attracting $5 in private capital for every $1 of foregone taxation revenue
Municipalities could cut housing costs by 20% by financing infrastructure with municipal bonds.
The housing shortage in Canada has reached a crisis point.1 An estimated 3.5 million new homes are needed to keep up with demand.2 A staggering number, especially compared to the U.S., where the shortage is 12 times smaller, on a per capita basis, despite having eight times the population.3 Canada’s growing housing shortage has contributed directly to affordability challenges. Average home prices have sky-rocketed in recent years—particularly in Ontario and British Columbia, which accounts for two-thirds of the country’s shortage—such that prices are now nine times household income.4
The federal government proposed a National Housing Strategy in 2017. But the program has only delivered 10% of its commitment to build 131,000 affordable rental homes.5 Mark Carney’s government has now pledged to spend the bulk of its $36-billion housing commitment on prefabricated homes. Tax cuts and concessionary financing for developers round out the government’s policy package.
It’s a start, but more can be done. The U.S. approach to housing can be instructive in how to attract continuous private capital into homebuilding. Canada and the U.S. both provide government subsidies to encourage developers to build more affordable rental and ownership housing. Canada’s preference is grants or concessionary financing, for rental housing, and waiving of government fees, and downpayment support for first-time homebuyers.6 This policy playbook requires the federal government, and provincial governments to a more limited extent, to fund these programs through direct capital outlay.
The U.S. relies more on federal tax incentives to draw in money from corporate, institutional, and mom-and-pop investors to finance housing and housing related infrastructure, including roads and stormwater sewers. At the heart of the U.S. taxation playbook are two tax tools: tax-free municipal bonds and a low-income housing tax credit for affordable housing.7 In 2024, these tools cost the U.S. Department of the Treasury a combined US$59.1 billion—1.2% of all federal revenue—but crowded in nearly US$500 billion in direct-equity investments.8
The introduction of similar federal income tax changes in Canada could achieve a housing trifecta: increased supply, improved affordability, and more sustainable homes. By our estimates, housing costs could decrease by 20%. These savings would allow developers to free up more capital, enabling them to build twice the number of projects with the same amount of equity financing. An acceleration of building activity that could help the Carney government fulfill a key priority: making housing in Canada more affordable.9
Tax-free Municipal Bonds
U.S. local governments have the power to raise debt in public markets, through bond issuances, to finance operating and capital needs, including housing. Local governments have US$4 trillion in outstanding municipal debt, and the U.S. municipal bond market is the largest, globally.10
The demand for local government debt can largely be attributed to the tax shield it provides investors. Holders of municipal debt, mainly institutional and retail investors, do not have to pay income tax on interest earned on these bonds.11 Since investors are willing to accept a lower rate of return in exchange for lowering their tax obligations, local governments can borrow from the public debt markets at lower costs, typically 100 to 160 basis points lower than taxable bonds with similar risk characteristics.12
To prevent the misuse of proceeds, the federal government places restrictions on what can be financed. Proceeds are principally used to finance projects where the benefits flow to public rather than private interests. To be considered for public purposes, bonds must meet one of the following criteria: more than 90% of the proceeds are used by a government entity, or less than 10% of the proceeds are secured for a property that is used in a trade or business. Municipal bonds that satisfy either of these conditions are classified as government bonds and the federal government does not impose a cap on the amount of debt that can be issued.
Activities that fail to satisfy either of these tests but provide both public and private benefits, such as multi-family residential housing projects, green buildings, and sustainable design projects,13 are eligible for financing with a type of municipal bond classified as a private activity bond (PAB). Unlike government bonds, PABs are subject to capital raising limits, which is US$48 billion in 2025.14 While PABs are used to fund a variety of initiatives, they are critical for developers building affordable housing projects. About 44% (or US$18 billion) of PABs are used to finance affordable rental housing projects, in 2022.15
Low-Income Housing Tax Credit for Affordable Rental Housing
A second tool in the U.S. tax code playbook are low-income housing tax credits (LIHTC). Since its inception in 1987, the LIHTC has been responsible for the development of 7.8% of new U.S. housing stock, or 3.65 million units of affordable housing.16
Two types of credit exist, a 4% and a 9% tax credit.17 The 9% tax credits are allocated to states annually by the Internal Revenue Service (IRS). In 2025, credits are capped at $49.6 billion. States distribute these credits to eligible projects, and eligibility criteria is refreshed annually, to remain aligned with each state’s affordable housing priorities, including the construction of greener or more energy efficient homes. The 4% tax credits are awarded automatically to projects that receive 50% of funding through tax-exempt municipal bond financing. There’s no ceiling on the amount of 4% tax credits available each year, since developers apply for the credit directly with the IRS.
While there are several approaches to accessing the 9% tax credit, the most common is for a syndicator, typically a bank, to play match maker between developers and investors. A limited liability corporation (LLC) is formed in which investors are the limited partners owning 99.99% of a housing project, and the developer as the general partner owns 0.01%. The developer flows to investors the tax credits they receive from their state housing finance authority once a project is occupied. Investors in return provide equity financing to developers, that’s generally $0.90 on the dollar for a credit. These investment partnerships are structured to last 15 years, which is the mandated affordability period in the tax code. At the end of the 15-year holding period, the investors, who are mainly corporations, have the option to sell the housing project back to the developer or enter a new deal for the same property.18
Investors in LIHTC are mainly motivated by the after-tax returns on their equity investments. As a result, they are comfortable with providing 80% equity financing for a project where they will receive lower returns because their contributions will be used to lower rents. Investors internal rate of return (IRR) of after-tax savings range from 350 to 800 basis points which on the upper end of the IRR range is almost twice the yield of a 12-month U.S. treasury bond.19 Two forms of tax savings exist—general tax savings and income tax savings. The former is realized through asset depreciation and operating losses. Income tax savings are realized by using the tax credits to offset federal income tax liability for 10 years, although the credits can be recaptured if the housing project fails to comply with rent and income requirements.20
Tax credits, while benefiting investors and businesses, come with a downside cost: foregone taxation revenue, which, as noted above, cost the government US$59.1 billion in 2024. On the positive side, the LIHTC is estimated to crowd in US$2 of investment spending for every dollar in foregone revenue. The multiplier effect is even more staggering for municipal bonds, crowding in US$10 of private investor capital for each dollar in foregone tax revenue.21
What’s required to adopt the U.S. tax playbook in Canada
Investment tax credits and tax-free capital gains are not novel taxation concepts in Canada. The federal government’s Multiple Unit Rental Building (MURB) program, which ran from 1974 to 1981, permitted retail investors in rental apartments to lower their income tax obligations by claiming capital depreciation and other costs against their income. The program, which cost the federal government between $1.3 and $2.1 billion in foregone taxation revenue in today’s dollars, was eventually discontinued due to its ineffectiveness in creating below market rental housing and lowering rental construction costs.22
The U.S.’s LIHTC program is like Canada’s MURB program in providing tax incentives to attract private capital to finance affordable housing projects. But it differs in its prescriptiveness, governance, and tax-incentive design, which draws in more corporate and institutional rather than retail investor capital. By imposing thresholds for income and rent levels, along with a 15-year compliance period, the program has been successful in ensuring a steady supply of affordable rental housing that’s privately owned. The effectiveness of the program is further enhanced because states are given the flexibility to tailor the program to meet regional priorities, such as Washington state’s preference for projects that are located near mass transit.
Adopting the U.S. affordable housing taxation playbook in Canada will require all orders of government to tweak or introduce new legislative or governance changes in how they deliver and fund housing, and housing-related infrastructure. The greatest shift will be required at the local government level. There, long-standing capital budgeting practices will need to modernize to leverage debt financing that’s available from institutional investors.[1] The crowding in of private capital, however, hinges on the federal government making the necessary changes to its tax code, as the quantum of benefits of similar tax code changes at the provincial level are insufficient for investors.
Federal Government
The federal government would need to enact tax code and governance changes to implement a low-income housing tax credit and a tax-free municipal bond regime in Canada.
For tax-free municipal bonds, changes are required to the Income Tax Act to exempt interest earned on municipal bonds. Guardrails would be needed to ensure bond proceeds are earmarked for housing related infrastructure projects, such as watermains and sewers. To encourage green infrastructure, the government could also impose a requirement that proceeds be used to build low-carbon infrastructure, such as district energy systems using waste heat. Both guardrails could be achieved by defining the circumstances when interest earned on municipal bonds is not income. For these changes to work, municipalities would need to develop borrowing frameworks, such as a social debenture framework or a green debenture framework, which specifies how bond proceeds will be used.
Changes to the Income Tax Act would also be required to create an investment tax credit for the financing of affordable housing, along with corresponding eligibility criteria of what constitutes affordable housing. To encourage the construction of greener homes, the Department of Finance could replicate the IRS’s approach of defining a range and type of eligible projects.
The final broad change that may be required at the federal level is the expansion of the Canadian Mortgage and Housing Corporation’s (CMHC) mandate to administer the income and rent limit elements of a LIHTC program, if its current remit related to core housing need does not include these activities.
Provincial Governments
Canadian provinces do not have housing financing agencies but could leverage housing ministries or departments to administer the provincial components of an LIHTC program. The mandate of these ministries and departments may need to change to encompass all provincial-level elements of a program, such as setting housing priorities, scoring applications, allocating tax credits, and monitoring compliance.
Municipal Governments
For decades, municipalities have been permitted to raise capital through bond issuances and loans to fund capital projects, but rarely for affordable housing.24 This is partly because the federal government along with the provinces are the key funders of market and non-market housing programs, aimed at housing affordability and more recently at climate change. Ontario is the only province where municipalities are actively engaged in funding affordable rental housing, mainly government-owned community housing.25 Funding for these initiatives is primarily paid for by revenue generated from municipal property taxes and user fees, and, in rare cases, municipal bonds, with the latter confined to the largest cities with a growing population and stable economic base, such as Toronto.
We are not proposing municipalities adopt the U.S. municipal bond playbook wholesale, whereby municipalities directly fund affordable housing with bond proceeds.26 Such a proposal may be unworkable in provinces that require public money to finance only public assets. Instead, we encourage municipalities, especially those in Ontario and B.C., to study the costs and benefits of paying for infrastructure with long-term public debt financing instead of development charges.27 Our analysis of proposed and under construction housing projects found that removing the cost of infrastructure from the price tag of homes can potentially reduce the per-unit construction costs of new homes in the Greater Toronto Area and Metro Vancouver by an average of 20%.28
Moving to a debt-financing model does not change who pays for housing related municipal infrastructure–renters, homeowners and ratepayers. The conduit for this cost pass-through however changes from developers to municipalities. Because municipalities can borrow at a cheaper rate than developers or homeowners, the interest costs that are passed through are lower.29 Fundamentally, the proposed change addresses a structural housing affordability problem that’s rooted in having renters and homeowners of new construction pay for infrastructure costs upfront, rather than spreading the cost over many decades, through monthly utility fees.
Public-debt financing can occur either as on-book or off-book financing. On-book financing requires municipalities to stay within their annual debt repayment limit, which is generally 25% of own revenue sources.30 Off-book financing provides municipalities greater borrowing flexibility, as annual debt repayment limits are not applicable.31 This form of financing, however, is more administratively complex, as municipalities would need to establish a municipal services corporation (MSC) or a public utility, and scope out the services they want to provide. The most common uses of MSC, or public utilities, are for water/wastewater and local electricity distribution. Both types of corporations operate arms-length from municipalities and take on the public debt used to finance an infrastructure project, in addition to owning and operating the asset.
The strong fiscal position of Canada’s largest municipalities indicates that shifting to a public debt model to finance housing related infrastructure is achievable. Based on regulatory filings32, the 13 largest single-tier and regional governments in Ontario that are also active in the municipal bond market have the fiscal room to take on at least $4 billion in debt, either as loans or bonds, without breaching their annual debt repayment limit. That’s two times greater than the $2 billion they collected in development charges in 2023.33
About 20 Canadian municipalities actively borrow from the public debt market to finance their hard infrastructure projects.34Municipal bond issuances totaled $5.4 billion, in 2024, with $53 billion in outstanding debt.35
Given the mostly AA to AAA credit ratings of Canadian municipalities, the low risk of default, and the attractive risk-return profile, it’s likely that based on the U.S. experience,changes to the federal tax code to exempt the interest earned on municipal bonds will result in greater investor demand.36
While Canada’s municipal bond market is unlikely to grow 75 times, to $4 trillion dollars, which is the size of the U.S. municipal bond market, the $4 trillion figure is proof that tax incentives can be an effective tool in drawing in private capital into desired forms of infrastructure.37
Municipalities have a range of governance options in how to deliver their services, and ownership and management of these services. The most common model that exists in Canada are for municipalities to have full ownership of service delivery. Within the past 30 years, as more responsibilities are shifted onto municipalities from provincial governments, there’s been a slow evolution to explore different and more cost-effective forms of service delivery.
Municipal services corporations (MSC) and public utilities are the two most common alternative forms of service delivery.38 The creation of these arms-length municipally owned corporations provide greater flexibility to plan for and finance the full lifecycle of assets.
In a MSC or public utilities service delivery model, these corporations take on debt to pay for the upfront capital expenditure costs of an infrastructure project. Debts are paid off over several decades through monthly user fees derived from homeowners and businesses using the infrastructure. The continued economic viability of these systems is ensured through mandatory utility connections, typically required by provincial or municipal planning regulations.
Turning ideas into action
We encourage all levels of governments to study and consider the taxation and financing ideas proposed in this policy brief, as they refresh their housing strategies.
Our policy brief does not model the utility rates impacts were municipal governments to adopt a debt financing model for infrastructure. These economic and taxation studies are complex, requiring a deep understanding of capital budget and service delivery models, which is not uniform across Canada. Given the domain expertise required to execute these studies there’s an opportunity for provincial and municipal governments to jointly co-fund these studies to understand the costs and benefits of our proposed ideas.
At the federal level, policy and program design work is likely underway for the government’s affordable housing tax credit proposal, and its commitment to reduce municipal development charges by 50%.39 We encourage the Department of Housing, Infrastructure and Community to consider the ideas put forth, as they move deeper into the policy analysis, program design and consultation stage of their work. Since changes to the Income Tax Act are at the crux of our two ideas, we encourage the Department of Finance to evaluate the cost and benefits of our two tax proposals on the government’s balance sheet.
Conclusion
An estimated $2 trillion will be required over the next five years to build the additional 3.5 million homes required to alleviate the country’s housing affordability crisis.40 A crisis that in the past few years have led to several studies by the federal and provincial governments analyzing the root causes of the country’s housing supply and affordability problem, and recommendations for action.
The taxation ideas proposed above advance some of these recommendations. The Ontario Housing Affordability Task Force recommended the creation of an arms-length municipal services corporations that would build, own and operate housing related infrastructure.41 As well as finance the infrastructure using debt rather than development charges. And the Canada-British Columbia Expert Panel on the Future of Housing Supply and Affordability recommended increasing the supply of below-market rental housing through a long-term funding commitment.42
The urgency to leverage and enlarge the pool of capital available for new housing construction—five times the current level of deployment—is becoming greater, as provinces and the federal government take on unplanned new spending to support businesses and communities impacted by U.S. tariffs. The net effect on both levels of government is less fiscal room to support other priorities, including housing. Restoring housing affordability needs to be a short and long-term strategic priority for all levels of government. Doing so will free up household disposable income that can be re-invested to grow other sectors of the economy. It will be a sustainable outcome that can help safeguard today’s standard of living and economic prosperity for current and future generations of Canadian renters and homeowners.
This figure is based on Scenario 1 in the Canadian Mortgage and Housing Corporation (CMHC) 2023 Canada’s Housing Supply Shortage: Restoring affordability by 2030 study. In this scenario housing affordability is restored to 2003-2004 levels, housing cost to income ratios range from 30% in many smaller provinces to a high of 44% in British Columbia. Scenario 2 would introduce a uniform housing cost-to-income ratio of 40%. In this scenario, an additional 2.27 million units of housing would be required, and only three provinces would be required to increase housing supply beyond current levels. These provinces are Ontario (1.63 million units), B.C. (0.62 million units), and Saskatchewan (0.02 million units).
Legal Disclaimer3
Analysis based on RSM estimates using Freddie Mac data. The base case is 1.3 million units, annually, and an additional 400,000 units arising from new household formation. CMHC’s 3.5 million units are additional units required that are in excess of the existing annual housing completions, which averaged 195,000 between 2000 to 2022. For our analysis we prorated the 3.5 million units over 6 years, starting in 2025, for an annual average of 588,333 units. The population figure for the U.S. is 340 million based on April 2025 data from the Federal Reserve Bank of St. Louis. Canada’s population estimate of 42 million is from Statistics Canada, as of April 2025.
Legal Disclaimer4
This is a weighted value for household incomes and home prices in the Greater Toronto Area and Metro Vancouver. Analysis based on data from the Canadian Real Estate Association, the Toronto Region Real Estate Board and CMHC’s Real Average Household Income (Before-tax) by Tenure report. Home prices are for Metro Vancouver and the Greater Toronto Area (GTA) as of April 2025. The average composite home price for Metro Vancouver was $1,184,500 and $1,107,463 for the GTA, and their weighted value is $1,147,276. The pre-tax household income in Vancouver was $127,500 and$137,400 in Toronto, and their weighted value is $132,635.
Legal Disclaimer5
Latest available data as of June 2024 for the Apartment Construction Loan Program. To achieve the government’s goal of 131,000 units by 2031/32 requires the completion of an estimated 70,000 units by 2024, based on the assumption that an equal numbers of unit are built each year, and the first wave of units were completed in 2020, 3 years after the program was introduced. Data source: Housing, Infrastructure and Communities Canada – Progress on the National Housing Strategy – June 2024.
Legal Disclaimer6
Government fees waived include land transfer tax and the federal portion of the harmonized sales tax. Downpayment support include the RRSP Home Buyers Plan and the Tax-Free Home Savings Account (FHSA). The Home Buyers Plan allows first time homebuyers to withdraw money from their registered retirement savings plan, without a tax penalty, if repayment is made within 15 years. The FHSA allows individuals to contribute to savings account where contributions are tax-deductible and withdrawals for first time home purchases are tax free. There’s a $40,000 limit to the FHSA.
Legal Disclaimer7
The tax credit is aimed at the development of below market rental housing that’s privately owned, and not so-called community or social housing.
Legal Disclaimer8
Analysis of data from the Congressional Budget Office; Cohn Reznick 2024 LIHTC Equity Market Volume Survey.
Between 60 to 70% of bond proceeds are used to fund municipal infrastructure and housing capital projects. Source: LSEG
Legal Disclaimer11
Institutional investors that are pension funds are exempt from paying income tax on their capital gains, in both the U.S. and Canada. Pension funds invest in municipal bonds for two primary reasons: to diversifying their portfolio and obtain a low-risk steady cash flow. Retail investors are so called mom and pop investors.
Legal Disclaimer12
Analysis by Charles Schwab found that the spread between taxable and tax-exempt municipal bonds as of February 2025 was 160 basis, and the 15-year average, since 2010, is 100 basis points. Provincial regulations require municipalities to create a reserve fund that is used to pay off debt issuances. While statistics on municipal debt default is not available in Canada, analysis by Fidelity Investments found a 0.04% default rate for U.S. municipal bonds. In comparison, the default rate for corporate bonds with similar risk profile was 1.44%.
Legal Disclaimer13
These types of facilities are prescribed in section 142 of the tax code.
Legal Disclaimer14
The per capita allocation for private activity bonds is $130, in 2025.
Legal Disclaimer15
Based on 2022 data, which is the latest data available. Source: Novogradac.
Legal Disclaimer16
Latest data available from the U.S. Department of Housing and Urban Development, for homes built between 1987 and 2022.
Legal Disclaimer17
The 4% and 9% represent the amount of eligible costs that can be counted towards the low-income housing tax credits.
Legal Disclaimer18
States generally impose another 15-year holding period on top of the federal requirement, bringing the overall affordability period to 30 years. The new equity investments are typically used to finance capital improvements. Banks in the U.S. are subject to the Community Reinvestment Act (CRA), which requires them to serve the credit needs of the communities in which they do business, including low to moderate income neighborhoods. Investments in LIHTC deals are viewed favourably by banking regulators when evaluating a bank’s CRA performance.
Legal Disclaimer19
RBC Capital Markets. The yield for a 12-month zero coupon US Treasury Bond is 412 bps on May 23, 2025.
Legal Disclaimer20
The LIHTC provides a direct dollar-for-dollar reduction for federal tax liability. The credits provide investors with the flexibility to offset prior year’s federal tax liability. They can also be carried forward for 20 years if tax credit flow exceeds actual federal tax liability.
Legal Disclaimer21
The 5 to 1 ratio referenced in the key takeaway is a weighted average of both tax incentives.
Legal Disclaimer22
See Clayton Research Associates Limited CMHC sponsored study Tax Expenditures – Housing published in March 1981 and CMCH’s Assessment Report Evaluation of Federal Rental Housing Programs, published in 1988. The Clayton study was commissioned by CMHC to evaluate the costs, benefits, and effectiveness of select tax expenditures targeted at housing.
The approach used by municipalities to access the public debt market varies. B.C. and Quebec have provincial financing authorities who borrow from the debt market on behalf municipalities. A similar approach is taken in Ontario where regional governments exist. Regional governments borrow from the public debt market for their own needs and the needs of their constituent municipalities.
Legal Disclaimer25
This funding relationship emerged in the 1990s when the Ontario government devolved responsibility of housing onto municipalities, in exchange for taking on responsibility for education.
Legal Disclaimer26
The amount of bond proceeds used to fund housing varies from year to year. About 5% of outstanding issuances as of April 2025 are used to fund housing according to analysis by FTSE Russell.
Legal Disclaimer27
Development charges, also known as capital cost charges, infrastructure charges or offsite levies are most common and the highest in Ontario and B.C. While development charges exist in other provinces to pay for growth related infrastructure, such as Alberta, they generally are a smaller proportion of total construction costs. Analysis based on data from the following sources: client data, BILD’s Comparison of Government Charges on New Homes in Major Canadian and U.S. Metro Areas, CMHC’s Housing Market Insight, July 2022, and scenario modelling using the City of Calgary’s building and development permit fee calculators.
Legal Disclaimer28
This figure is a weighted average of development charges for single detach and row homes, and low and high-rise multi-unit residential buildings.
Legal Disclaimer29
Developers borrowing costs is typically 100 basis points or one percentage above the prime rate. Residential mortgage rates are generally 200 basis points above the prime rate, exclusive of any promotional discounts. Using the latest prime rate of 4.95%, a developer’s cost of borrowing would be 5.95%, while for a homeowner, it would be 6.95%. Municipal bond borrowing costs range from 2.55% to 4.90%, for bonds issued in 2024.
Legal Disclaimer30
The 25% threshold applies to municipalities in Ontario, BC, and Alberta. The City of Vancouver debt service ratio is limited to 10% of its own revenue sources, i.e., revenues from sources that it has direct control over, such as property taxes, user fees, and development charges.
Legal Disclaimer31
Municipalities in Canada are required to establish a reserve fund for bond issuances. The reserve fund is used to pay interest payments and the principal outstanding. Monies required for the reserve fund comes from municipal operating budgets. The creation of reserve funds and risk-based lending practices is one of the reasons why municipal debt defaults are rare, in both Canada and the U.S.
Legal Disclaimer32
Ontario Municipal Affairs and Housing’s Financial Information Returns.
Legal Disclaimer33
Latest year of available data. Ontario municipalities collected $2.7 billion dollars in development charges in 2023 based on analysis carried out by the Ministry of Municipal Affairs and Housing.
Legal Disclaimer34
RBC capital markets.
Legal Disclaimer35
Ibid.
Legal Disclaimer36
Analysis by RBC Capital Markets found that 90% of municipal bond issuances in the U.S are single rated -A or higher.
Legal Disclaimer37
Analysis of Federal Reserve data by Fidelity found that retail investors account hold 44% of municipal bonds and the balance is held by institutional investors and corporations.
Source: Liberal Party’s Building Canada Strong election platform commitments. Based on costing documents, the Federal government plans to spend $1.5 billion annually, over 4 years, on reducing development charges and supporting infrastructure.
Legal Disclaimer39
Source: Liberal Party’s Building Canada Strong election platform commitments. Based on costing documents, the Federal government plans to spend $1.5 billion annually, over 4 years, on reducing development charges and supporting infrastructure.
Legal Disclaimer39
Source: Liberal Party’s Building Canada Strong election platform commitments. Based on costing documents, the Federal government plans to spend $1.5 billion annually, over 4 years, on reducing development charges and supporting infrastructure.
Legal Disclaimer40
Estimate based on a weighted average construction cost for single-detached, row/townhouse, low and high-rise multi-residential housing where construction is underway in the Greater Toronto Area. The calculation includes hard and soft construction costs, and land development costs, but excludes land purchase price, and fees, such as interest charges and management fees. In our analysis, per unit construction cost ranged from $462,000 to $577,000, and the weighted average development charges was 20%. The estimated development charges outlay is between $323 to $403 billion.
Legal Disclaimer41
Recommendation 44 calls for the Ontario government to “Work with municipalities to develop and implement a municipal services corporation utility model for water and wastewater under which the municipal corporation would borrow and amortize costs among customers instead of using development charges”. Source: Report of the Ontario Housing Affordability Task Force.
Legal Disclaimer42
Recommendation 17 calls for “the federal government make long-term funding commitments, as was done until the mid-1990s, rather than offering short-term capital grants.”
Overview
Economic theory and evidence tell us that the more educated a society is, the more productive its economy will be. Countries or regions with highly educated people will attract advanced industries, generate more savings and investment and create entirely new economic sectors.
That promise is not yet fulfilled in Canada. Despite having one of the world’s highest rates of postsecondary education and a steady rise in postsecondary attainment over the past quarter century, economic performance, including productivity, is lagging. Too many graduates have advanced degrees that don’t deliver an advanced economic return. Not enough employers can build teams with the right skill sets. Too often, students don’t know how their programs line up with the labour market. And our international students continue to struggle to gain productive work in a fast-changing economy.
The challenges are all the more pressing in a worsening trade environment in which many Canadian businesses are looking to quickly pivot to more global, and more competitive, opportunities. Trade wars mean talent wars.
Of course, this is not entirely new. Canada’s postsecondary sector, and employers and governments, have been working for years — decades, really — to build a more productive, knowledge-driven and skills-based economy.
But for all the innovations in workforce-readiness, there‘s still a substantial gap between education inputs and economic outcomes, which Canada’s struggling economy and productivity cannot afford.
In this report, we identify why Canada is not reaping the benefits of its globally respected postsecondary education systems and we make recommendations about how to address our current postsecondary education/productivity disconnect. Getting that relationship right is key to sharpening Canada’s competitive edge. At the end, we present examples of what more productive economies have done to leverage the knowledge capital and research capacity of their postsecondary systems. And we highlight innovative experiments in postsecondary delivery, giving food for thought.
RBC launched The Growth Project initiative this year to discover a new generation of ideas for the Canadian economy. Throughout this project, we’ve been exploring key drivers of economic growth including productivity. To build on our report on why the economy is stuck in neutral, we’ve partnered with the Business + Higher Education Roundtable (BHER) to address the role of postsecondary education in Canada’s productivity crisis.
Productivity is an important measure of an economy’s efficiency at generating additional income from each hour worked. Some economies generate more additional income per hour worked than others, leading to better economic performance and growth.
Where we are
Canada’s labour productivity growth falters even as more Canadians obtain postsecondary education
Source: Statistics Canada, RBC Economics
Canada’s population is highly educated but our productivity doesn’t match — We are the most highly educated population in the G7 and above average across OECD countries. In 2024, some 63% of Canadians aged 25 to 64 had a postsecondary credential compared to an OECD average of 41%.1 Yet these two charts show that our productivity record has not kept up and is not only lagging our peers but has worsened over the past decade even as the rate of higher education, including for new Canadians, has improved.
And that productivity growth lags many OECD countries
Average annual labour productivity growth, 2014-2023, %
Source: OECD, RBC Economics
Our graduates get jobs, but their incomes — College and university graduates experience lower levels of unemployment and earn more over time than Canadians with a high school diploma or less.2 But, regardless of education level, Canadians earn an average of 8% less than their American peers,3 a gap that is wider in many professions.4 This is one reason for a perennial migration — a brain drain — of people with advanced degrees to the United States and a loss to Canada, economically and otherwise. The differing costs and standards of living in the U.S. aside, Canada still only falls in the middle of the pack when we look at individual returns on investment from higher education compared to peer countries.5
Postsecondary Education in Canada
Canada does not have a singular postsecondary education system. Each province and territory holds responsibility (a constitutionally protected authority for provinces and federally delegated for territories) for establishing and regulating its universities, colleges and institutes, including giving power to grant degrees and diplomas and making choices about provincial funding and tuition. This has led to variation in policy and systems across the country. About 64% of postsecondary students are enrolled in universities and 36% in colleges6, the vast majority in publicly funded institutions split among about 100 universities and 200-plus colleges, including 13 polytechnic schools7. This is alongside more than 1,500 private vocational colleges, about half in Ontario8.
Universities have traditionally offered longer-term degree programs in subject disciplines and public colleges have offered shorter-term diplomas in career-focused programs. But provincial governments outside Quebec and the four Atlantic provinces have also allowed public colleges to grant degrees9, and diploma and certificate programs are frequently found at universities. The federal government contributes to the postsecondary systems indirectly as well, through research grants, student financial assistance and provincial transfer payments10.
The Challenges
At its best, higher education contributes to productivity by developing a skilled workforce, driving innovation through research and fostering industry collaboration. Postsecondary institutions equip graduates with critical skills, support businesses with cutting-edge research and fuel economic growth by creating new technologies, startups and talent. Research has shown a positive relationship between a region’s economic health and the presence of higher education institutions, with an additional 0.4% in future GDP for every 10% increase in the number of universities per capita11. This effect is driven by boosts to human capital and innovation, not just direct institutional and student spending.
Higher learning institutions also contribute to the social and intellectual vitality of a community, region, and society that are hard to quantify. Nevertheless, Canada’s record underscores that the presence of a higher education system with a high rate of participation and research activity does not always translate into high returns when we look at economic measures.
So, what’s missing? Pinpointing which factors contribute to the overall economic value of a postsecondary education is limited by a lack of data and research12 13. But we can look to other countries with higher productivity and strong postsecondary systems for clues about what works and is showing promise — some of those are highlighted later in this report. We can also identify clear gaps here at home, whether that’s in human capital development or in research.
Disconnects persist between the knowledge and skills outcomes of Canada’s higher education systems and labour market needs.
The OECD has noted that “higher educational attainment does not always directly correspond with higher skills14.” Employer surveys consistently indicate that companies still have a hard time finding new hires with the skills they need, especially interpersonal and communication skills15. We also know that there is a growing gap in graduates’ technical skills related to artificial intelligence, cybersecurity and working with big data, all areas rapidly growing in importance.
Postsecondary business models are inadequate to meet the outcomes expected of Canada’s higher education systems in the current global economy.
Postsecondary institutions have a balance sheet problem. Their finances are rapidly changing due to stagnating provincial government funding, restrictions or even freezes on student tuition increases, and a federal immigration policy shift that has led to steep drops in international students and the significant revenue their higher tuition contributed to the bottom line. The postsecondary revenue crunch is likely to worsen without a reformed business model — one that is capable of responding to the demands of a changing economy.
Trouble is, postsecondary leaders are constrained by insufficient control over their revenue sources, regulations that circumscribe how they run their budgets, and little to no ability to cut or reallocate some of their biggest fixed costs. Staff wages and benefits amount to more than 50% of total expenditures at both colleges and universities16 and a high presence of permanent faculty and teaching staff protected through collective agreements, tenure or both limit institutions’ ability to nimbly adjust or close programs as enrolments and demands change. The hiring of contract faculty to teach students has been one attempt to gain some flexibility but the practice is not a panacea and has led to a teaching underclass with insufficient access to resources or basic job stability.
Amid this shaky and constrained financial picture, academic programs that connect best with high productivity industries are the most expensive to run. Science, technology, engineering and mathematics programs – STEM — have been expanding over the last 30-plus years as labour market and student demands have shifted, from 18.3% of enrolments in 1992-1993 to nearly 26% in 2022-202317. But labs, computers and other equipment mean they cost at least twice as much as training for a humanities or business student. If traditional revenue sources are no longer reliable, colleges and universities need to be freed – and encouraged – to develop fresh revenue streams, funding models and educational redesigns that make sense for them and the broader societal and economic needs they serve. The case of Arizona State University (illustrated later in this report) is an example of an institution that has taken an entrepreneurial approach, reimagining its programs and research activities as well as its business model to gain back institutional control from reduced state funding while making student access a priority, including for marginalized students.
Canada lacks comparable data to assess outcomes of our postsecondary systems and support linkages with labour market information.
It’s hard to fix what isn’t well-measured and Canada falls down on data to assess outcomes of its postsecondary systems20. While completion and employment rates data are sometimes tracked, outcomes data are not uniform across provinces or even institutions; nor is it timely or robust enough to confirm alignment between graduates’ skills and the labour market. The provincial/territorial control of higher education systems may seem to make national standardization of this data a non-starter. But given the renewed exploration of how to better harmonize provincial/territorial economies and trade, there is a perfect opportunity to bring postsecondary institutions into the discussion.
Countries such as the U.S. and Australia do a better job with postsecondary data tracking, enabling well-informed public policy discussions and change. In the U.S., tracking has been federally mandated for institutions that participate in federal student aid programs, and data is available through its Integrated Postsecondary Education Data Systems. Australia has developed its Quality Indicators for Learning and Teaching, a suite of annual government-endorsed surveys that follow higher education students from enrolment to employment.
There is a mismatch of graduates with advanced degrees.
Nearly 15% of Canada’s working-age population hold a graduate degree today — just below the share that held a bachelor’s degree in 1997, at 16%21.But those degrees aren’t always leading to jobs that require them. (In fact, there are more job vacancies for positions requiring only a high school diploma than there are openings for positions requiring a bachelor’s degree or higher22.)
As a result, there’s a rising number of highly educated Canadians working in jobs that do not make effective use of their degree. The OECD has ranked Canada as having the second-highest overqualification rate of 37 countries23, with an overqualification rate of 10.6% for Canadian-born workers and 11.8% for Canadian-educated immigrants in 202324.
Degree-holders undoubtedly enjoy a wage bump compared to those without a postsecondary degree. But that wage premium is shrinking when comparing the benefit of a master’s degree to a bachelor’s. Between 1997 and 2019, that premium averaged 23%. Since the pandemic, that’s fallen to 18% as more graduate degree holders compete for the comparatively smaller pool of jobs that require their credentials.25 What people pursue in their advanced degrees matters too: business PhD holders were the highest earners in a 2021 analysis of doctoral graduates, although they represented only 4% of all PhDs, while humanities and science PhDs (9% humanities and 22% sciences) were among the lowest. Math and computer science doctorate holders meanwhile showed the highest earnings growth in the five years after PhD completion26.
As well, fewer Canadian PhDs are working for private industry, compared to the U.S., which may be partly tied to an economy that is still heavily resource-based and where we have lower levels of industry R&D investment that would demand their skills27. Nevertheless, graduate students have relatively low levels of participation in work-integrated learning experiences (discussed later in this report) and lack opportunities to demonstrate and apply their skills and expertise to Canadian firms that could benefit from them. Canada certainly needs people with advanced degrees, but more thought should be given to which programs are of greatest need and how to make the most out of the skills and knowledge they produce.
Canada has seen expansion of postsecondary campuses and programs over the last 25 years but it’s unclear whether we have the right number or distribution.
Participation in higher education has expanded over the last 35 years and along with it has come expansion of programs and campuses. We need a high-quality postsecondary sector to educate and inspire the next generation of talent and skilled workers while generating transformative discovery. But it’s worth asking whether the size and spread of Canada’s roughly 100 public universities and 200-plus colleges with associated campuses and 25,000-plus programs are aligned as well as they could be with the country’s most pressing needs and the challenge of creating a more productive economy.
This question becomes more urgent given the pullback on international students who until 2024 functioned as a significant counterweight against more recent shrinkage in domestic enrolment and revenue, which has been acute in some regions. Population demographics forecast modest growth among Canada’s over the next decade before declining to something slightly above current numbers28.
Memories are also relatively fresh of the 2021 financial crisis at Laurentian University in Sudbury, Ont., when the institution declared insolvency due to what was later deemed primarily to be poorly planned capital projects combined with administrative bloat29.
Let’s think seriously about how to better align higher education resources with a broader student demographic and the evolving needs of the economy.
We are not setting up international graduates of Canadian postsecondary education for integration into high productivity labour sectors.
International students are part of the solution to Canada’s future economic needs and its productivity crisis. But over the last several years we’ve seen how the country’s efforts to recruit these students ballooned out of control, leading to students being underserved and/or ending up in programs without pathways to high value industries. As one example, international students are more likely to be enrolled in business or management programs versus STEM30,and many have struggled to find jobs after graduation when their visas allow them to stay.
As Canada works to reduce and recalibrate this student pool, we should focus on recruiting and educating high quality international students with targeted workforce development in mind. The federal government recently made this a requirement, with new rules about fields of study that international students need to be enrolled in to qualify for post-graduate work permits.
That’s a start, but the execution left something to be desired and threw many postsecondary institutions into crisis-mode trying to fill financial and programmatic gaps overnight. When the dust settles, fields of study should be chosen with consideration of regional labour demands too. International students will also need more help to translate their skills to the workplace, via focused career counselling and work-integrated learning opportunities, which some struggle to access due to immigration work restrictions.
Students need a more complete skills toolbox.
We need data scientists who are storytellers, electricians who can communicate technical complexity to their clients, and culture creators who can make magic by leveraging cutting-edge digital technologies. Hard skills and knowledge learned in STEM programs are valuable, but so are the skills where humanities excel: persuasive and effective writing and speaking, critical thinking and creative approaches to problem-solving.
We also know that students may not end up working in the domain where they received their education, whether that was in STEM or business/humanities31. Not enough postsecondary programs encourage cross-pollination across disciplines. But programs such as McGill University’s Bachelor of Arts and Science (B.A. & Sc.) degree, which allows students to study disciplines in both faculties, BCIT’s Bachelor of Creative Industries program that combines training in the arts, technology, and business, or Langara College’s Environmental Studies program, blending biology, chemistry, English and geography, are promising examples32. Many programs leave room for electives, too, where students can acquire that breadth of skills independently.
But this is tinkering along the edges of what’s possible and needed. As enrolments continue to slide in humanities programs, postsecondary institutions must reimagine the core competencies the humanities provide to all students and how to extend that across subjects, disciplines and faculties in a world of growing STEM demand. Critical thinking and the ability to analyze complex problems are top skills for the most needed jobs in the face of advancing artificial intelligence and automation33 as is the ability to identify how to effectively use these technologies. Can we start to break down entrenched silos that prevent the STEAM concept from being embedded more directly into most students’ programs and curricula?
Canadian companies are not making the most of postsecondary research output and are weak adopters of postsecondary research innovations.
In 2022, Canada ranked 10th globally in terms of scientific publications34 and we are a global leader in specific fields, such as artificial intelligence. But Canadian companies aren’t picking up the ball when it comes to making the most of made-in-Canada discoveries. The U.S., with a much better track record, benefits from a more robust ecosystem to support research translation into market applications, including venture capital funding, supportive public policies and an intellectual property framework that incentivizes researchers and postsecondary institutions to pursue commercialization.
All told, Canadian business investment in research and development was just 1.7% of GDP in 2022, putting us below the OECD average and well below highly productive countries like Israel (6.0%), South Korea (5.2%) and the U.S. (3.6%)34. Even in AI research, where Canada is a global leader, we lag peer countries in its commercial use.
How we can do better
The discussion about aligning postsecondary education and training with labour market needs isn’t a new one. Colleges and universities recognize this, and there are growing pockets of innovation. But employers and economic data signal a different story: that Canada is still missing the mark in generating the skills and knowledge needed to meet its evolving productivity challenge in an increasingly competitive world. Here are a few things we can do differently:
Eliminate barriers to institutional innovation.
Postsecondary institutions in Canada require new business models that free them to be more entrepreneurial and in control of their financial destinies while remaining responsible and accountable to the people and communities they serve.
Too often institutions that attempt to innovate are frustrated by a host of mostly provincial but also federal regulations on everything from tuition to procurement to partnerships and mandatory programs without corresponding government financial support. Reasonable deregulation would help clear the way for institutions to become more creative, collaborative and in step with a changing world. Internally, colleges and universities need mechanisms to incentivize change where barriers and resistance exist within institutions to creating or altering programs at scale or incorporating industry into program design.
Enhance the awareness and articulation of skills developed in PSE programs.
Prospective students and new graduates need to know the skills they will emerge with, allowing them to fairly evaluate whether a program is for them and to communicate these skills to employers. Some programs are already clear about this, notably at colleges, but the practice should become widespread and should be tied into a larger drive towards national comparable postsecondary outcomes data that can be linked to labour market information.
The challenge can be more acute for advanced degree holders, most of whom won’t spend their careers in academia. They, and employers, also need to understand what skills they’re developing through their research and how these can be translated to a non-academic workplace.
Get work-integrated learning to where it’s needed most.
Work-integrated learning, or WIL, is the practice of integrating work and real-world experiences into a student’s higher education program. Internships, practicums, co-op programs, entrepreneurial mentorship and field work are common examples. These experiences help students connect and apply their learning to workplace realities, acquire new and relevant skills and assist businesses to recruit and develop students for their specific labour needs.
As such, WIL is part of the solution to Canada’s productivity and skills challenges – two-thirds of employers participating in WIL programs through BHER reported an increase in their productivity.36But while the country has made important strides in providing these opportunities, WIL is not yet the norm – just under half of all postsecondary graduates in 2020 had experienced a WIL opportunity.37 There are also variations in uptake, with PhD students (18%) and those in the humanities (16%) less likely to have a WIL experience38.
Most businesses in Canada are small and medium-sized enterprises (SMEs) and face more barriers than larger organizations to participating in conventional forms of WIL in terms of resources, time and risk. For them, shorter-term, more flexible and less resource-intensive forms of WIL aligned more closely with SME realities and needs make more sense. These should be considered as part of a robust suite of WIL experiences. They include consulting engagements, multiple short-term placements of up to 10 days, online projects and placements, and engagement in industry challenges through hackathons, competitions and course-based projects submitted by employers39.
Develop upskilling and reskilling opportunities.
Businesses have a responsibility to help workers stay current with the skills needed to keep doing their jobs as they evolve with technological and other changes. Postsecondary institutions are well-positioned to be providers for that learning and can take advantage of these opportunities as revenue streams in a reformed business model. Too often Canada’s companies struggle to partner with postsecondary institutions and end up developing their own in-house training solutions40.
To do that well, higher education must stay on top of and respond to upskilling opportunities in their communities, partner with employers (and vice versa) to understand and respond to specific skills gaps and create programs that fit the working and personal lives of learners. Continuing education departments are particularly well-positioned to do this. An opportunity also exists for governments to financially support and promote these programs, such as through tax and other incentives, as they look for policy responses to labour force disruption. Microcredentials – rapid, often virtual courses — are one form of upskilling that have proven effective in complementing workers’ existing skills41.
especially the programs and courses that are developed by postsecondary institutions (for example, Ontario provides access to these via its provincially funded eCampus portal).
Similar opportunities exist for postsecondary institutions in reskilling programs where workers exiting one industry acquire an entirely different set of more in-demand skills. Partnering with local companies’ outplacement programs is one example. Given that it’s a more substantial undertaking than upskilling, the reskilling shift can be trickier, especially if we want it to happen quickly. Competency-based education (CBE) courses may offer a way forward. CBE is singularly focused on mastery of a discrete set of competencies, often required for a particular job, such as nursing. CBE courses tend to be flexible, virtual, personalized, self-directed and recognize prior learning. The approach has been used in limited ways in Canada, is more widespread in the U.S. and may offer inspiration for reforming the structure and delivery of traditional programs42.
Intensify the drive towards institutional differentiation.
Canada has done an excellent job of providing access to public postsecondary education across a big country and into remote communities. But we neither need nor can we afford to have every institution offering the same menu. Not every institution needs its own artificial intelligence research hub or history department.
Differentiation is critical, where public colleges and universities are encouraged to lean into the teaching, learning and/or research they are best at, and discouraged from unnecessary program duplication. The government of Ontario has followed this policy, though without a strategic vision for the sector or what separate roles should be played by colleges and universities43.
Differentiation might mean institutions that are focused on and excellent at teaching mostly undergraduates, such as members of eastern Canada’s Maple League of Universities, or that are highly research-intensive, such as the University of Toronto, or whose teaching and research are strongly aligned with key local industries, such as the country’s polytechnic institutes.
Differentiation can also happen through the business model an institution uses to sustain itself and remain relevant. It can be promoted through strategic mandate agreements negotiated between institutions and government funders, as Ontario does. Government research funding models can also encourage differentiation and build capacity by favouring institutional specialization, such as through the federal government’s Canada First Research Excellence Fund.
The growing financial sustainability crisis faced by colleges and universities makes differentiation a strategic imperative for each institution.
Make it easier for Canadian businesses to adopt and invest in research.
Our world-class postsecondary researchers are part of an innovation pipeline that includes Canadian businesses who can adopt researchers’ discoveries, commercialize, refine and run with them, boosting their own competitive edge. But that pipeline is slowed by Canada’s fragmented regulatory and approval processes, at every level of government, which delay and complicate business investment decisions. Streamlining those processes by implementing, for example, a harmonized federal-provincial environmental assessment process for projects of national strategic importance would speed up approvals and drive private sector investment into new major projects.
Our outdated tax system is also in need of a comprehensive review with an eye to encouraging greater private sector investment in Canadian research and development. This review could include an assessment of the impact of recently announced changes to the, could further spur private sector R&D investment.
Conclusion
Postsecondary education is one of this country’s greatest strengths. But we’re not using it to its full potential and we’re not keeping pace with the rest of the world as a result. Our productivity crisis is clear and urgent with direct impacts on the standard of living all Canadians can expect, including the graduates of tomorrow, especially in a global economy that is more divided and disruptive. Governments, institutions and employers must each play a role in bridging the gap:
Take action on regulatory and tax reform to encourage greater private R&D investment and adoption of made-in-Canada research discoveries.
As federal departments work through a reformed strategy for international students, focus on ways to match their abilities and interests with programs aligned to Canada’s most pressing economic needs, regionally and nationally. Eliminate immigration restrictions that prevent international students from participating in work-integrated learning.
Address business barriers and raise awareness about the value of participating in work-integrated learning experiences, especially among SMEs, by investing in partnership and capacity building.
Use tax incentives and federal funding to encourage industry partnership with postsecondary institutions in support of cost-effective, high-quality upskilling and reskilling programs for employees.
Engage in pan-Canadian work and leverage relevant federal programs and departments to develop comparable, accessible, comprehensive and easy-to-understand data for timely identification and analysis of postsecondary education outcomes, including by institution and program.
Implement a clear vision and strategy for the province’s postsecondary systems that differentiates between the purpose of college vs. university programs and incentivizes differentiation within them.
Embark on a process of limited postsecondary deregulation that gives institutions more control over their finances, revenue streams and promotes innovation in programs and industry partnerships.
In parallel, promote accountability through mandatory institutional reporting of comparable and detailed data on postsecondary outcomes by institution and program, including graduates’ skills, which can be linked to labour market information.
Continuously and rigorously review changing labour needs and update labour market information to better support alignment with postsecondary programs.
Be explicit about the skills students will develop through the programs and courses offered to them and provide ways to communicate those to employers. Draw on the expertise of continuing education departments which are already well-positioned to help.
Encourage, support and incentivize departments and faculty to explore new models of teaching and learning, especially where these integrate skills students will need in the workplace.
Break down faculty, disciplinary and subject siloes that interfere with cross-curricular and interdisciplinary learning needed to promote STEAM skills and expose students to problems in high labour demand sectors.
Look for novel ways to spread student awareness of work-integrated learning opportunities, why they’re valuable and help them overcome barriers to access.
Engage with postsecondary institutions — or intermediaries like the Business + Higher Education Roundtable that can help navigate to and through them — to communicate skills needs and identify potential opportunities for collaboration.
Explore becoming a work-integrated learning participant to bridge the skills gap and potentially develop the next crop of employees.
Look to postsecondary institutions for short-duration programming to help upskill and/or reskill your employees before turning to untested third-party providers.
Engage in local outreach to high schools to raise awareness about their industry, why it’s an exciting place to work and the education pathways to a fulfilling career in that sector.
Continue to contribute to labour market information systems by sharing data with governments and collaborate to find new ways to enhance the accuracy and relevance of labour market analyses and policy development.
Global Stories in Higher Education Research and Development
Facilitating knowledge transfer to SMEs – Heilbronn University, Germany
The challenge: Bridge the knowledge gap for local small- and medium-sized enterprises.
The innovation: This applied research university created a virtual AI lab that is publicly accessible, frequently updated and helps businesses understand AI research developments and adopt pragmatic AI solutions in a city quickly becoming known as an AI hub.
Powering startups through global connections — Block 71, National University of Singapore
The challenge: Bridge the knowledge and connection gap for startups.
The innovation: Block 71 was set up in 2011 to create an innovation hub by connecting startups with academic research, mentorship and global markets. It has since spread to 10 other global locations including Silicon Valley, Saigon and Nagoya, leading to more than 100 startups connected with more than 50 venture capitalists.
Creating a research powerhouse through merger — University of Paris-Saclay, France
The challenge: Enhance research institutions’ global and research impact.
The innovation: Created in 2019, this technological research-intensive university brings together 20 prestigious colleges, public universities and research institutes under one campus while preserving their individual autonomy. Through their combined resources, the collaboration has positioned the university as a leading force in global science and technology research, education and innovation.
Fostering local economic engagement – Innovation and Economic Prosperity Program, Association of Public and Land-Grant Universities, United States
The challenge: Connect university teaching, learning and research to local economic development.
The innovation: The IEP program encourages universities to understand, communicate and develop their local economic engagement through a designation process. It also conducts annual awards recognizing outstanding examples of talent and workforce development; innovation, entrepreneurship and technology-based economic development; and other forms of community engagement.
Global Stories in Higher Education Teaching and Learning Innovation
Degree Apprenticeships — Manchester Metropolitan University
The challenge: Address graduates’ skills gaps and boost productivity
The innovation: Degree apprenticeships combine full-time work with part-time study, engaging industry in co-designing and delivering a large portion of the program. Manchester Met has achieved exceptional outcomes through this model, including a 44% median salary increase for apprentices, estimated to be equivalent to a 60% boost in productivity, and 70% of employers reporting productivity gains.
Disrupting the Model – Arizona State University, U.S.
The challenge: Redesign the university to provide broad access to education, advance research of public value and engage in community economic challenges.
The innovation: Under the transformative leadership of Michael M. Crow, the university is redefining the role of higher education under its “New American University” model. It’s been ahead of the curve in offering full degree programs online and improving access for non-traditional students, including a partnership with Starbucks to provide free online degree programs for its employees. On the research and intellectual property side, it has secured more than 1,600 patents since 2003, attracted more than $1.4 billion in investment capital and is considered a leader in technology transfer.
South Korea – This east Asian powerhouse has the highest rate of postsecondary education attainment in the OECD, at nearly 70% of its population and is an OECD leader in productivity growth. The country has leveraged its educational advantage towards its economic development, with a strong top-down system of close research collaboration between government, industry and the academic community. Although it is currently facing slippage in its record, its fundamentals remain strong and it stands as an example of what’s possible through robust policy, investment and collaboration.
Israel – With a 6.5% growth rate in 2022, Israel’s high-tech sector accounts for more than 15% of GDP and universities are tightly woven into its activities. Israel was ranked first globally for AI talent concentration and fifth for AI talent penetration by Stanford University’s 2024 AI Index Report. This has been attributed to “an exceptional ecosystem of startups, academia, and strategic support from both local and multinational players.”
Slovenia – Showing strong productivity gains over the last decade, this small eastern European nation has also seen significant gains in postsecondary education attainment since 2012, from 35.3% of the population to 47.3% in 2022. The country directs about 1% of GDP towards higher education, has seen rapid growth in STEM program graduates and manages higher education within the same government ministry as science and innovation.
Digital Technologies Program, York University
The challenge: Address skills gaps in the digital economy and foster a diverse, innovative workforce.
The innovation: Canada’s first fully work-integrated learning degree, where students spend 80% of their time in the workplace, including paid work opportunities, and 20% on coursework. The competency-based curriculum allows students to apply real-world skills while moving through advanced tech-related topics. Employers highlight gains in productivity resulting from longer-term placements and deeper student engagement with projects.
Electrical Technician Program, Nova Scotia Community College
The challenge: Meet the demand for new skills as Nova Scotia’s government works to grow its onshore wind generation.
The innovation: With an investment from RBC Foundation as part of a larger $2-million commitment, NSCC is updating its Electrical Technician Program to include large-scale wind energy training, in alignment with labour market demand and provincial clean growth initiatives. The funds will support new course development and hands-on training materials.
Global Innovation Clusters, Innovation, Science and Economic Development Canada
The challenge: Solve complex problems and improve Canada’s productivity in key emerging industries.
The innovation: Better known as the “superclusters,” this program brings together businesses, academic institutions and nonprofits under five industry categories to drive growth and innovation, backed by shared government and industry funding. The program generated more than $1.6 billion in project spending by the federal government and industry partners between 2018 and 2023 and created nearly 24,000 full-time jobs.
Mitacs Research and Internship Partnerships
The challenge: Connect postsecondary research expertise and innovation to problems faced by businesses and bridge the skills translation gap for undergraduate and graduate students.
The innovation: Through several programs, this not-for-profit organization brings students and post-doctoral researchers together with private sector partners through internships and collaborative research projects focused on real-world challenges faced by the business. Mitacs also provides dedicated professional skills development for graduate students and postdocs. The program has resulted in an 11% increase in productivity for its more than 12,000 partners and $1.2 billion in R&D spending between 2018 and 2023, according to a Statistics Canada/Mitacs analysis.
Canada and the U.S. are each other’s largest minerals trading partner, amounting to $146 billion in bilateral trade1.
The U.S. is 100% import reliant for 12 of its identified list of 50 critical minerals, and net import reliant (>50%) for 29 of those critical minerals2.
China is the primary foreign source for a quarter of the U.S.‘s critical minerals3.
Disruptions to the supply of critical minerals could cause material damage to the U.S. economy. One example: a 30% supply restriction of gallium could cause a $600 billion (U.S.) decline in U.S. GDP4.
Defense procurement is an underutilized source of financing for key defence critical minerals, particularly graphite, tungsten, scandium, and gallium.
Bedrocks of a Fourth Industrial Revolution
Minerals are the bedrock of any industrial economy. From steel to copper to aluminum, they lay the foundation of economic, civil, and defence infrastructure. And increasingly, a growing cohort of minerals underlie the critical components of the so-called Fourth Industrial Revolution — an era of disruptive technological forces driven by human-machine interaction across research, manufacturing and an ever-expanding data economy.
In this new age, the demand for that cohort of “critical minerals” will be driven by a growing use of semiconductors and data processing machines, increased adoption of battery technologies and new energy sources, and advancements in defence and aerospace technologies. For Canada, the race to develop and process these minerals is about much more than the mining sector; it underscores a new security paradigm to protect and enhance our economic and national interests in an evolving world order. Here’s some of what’s at stake:
Semiconductors
The early days of generative AI are showing how much more computing power we will need. Global semiconductor sales are on pace to reach $1 trillion (U.S.) by 2030, with high-powered artificial intelligence (AI) chips likely accounting for the majority of sales5. To date, silicon has been the material of choice but AI is testing silicon’s thermal limits. Gallium nitrade’s (GaN) superior conductivity results in over 30% improvements in wafer power efficiency6. Palladium, arsenic, copper, and cobalt are also used in chip fabrication (plating, wiring).
Batteries
Whether it’s for EVs on the road, energy efficiency at home or long-duration storage at power generation sites, we’ll need a lot more battery technology in the years ahead. An EV battery requires an average of 205 kilograms of critical minerals (or six times that of an internal combustion engine), comprised of lithium, cobalt, nickel, graphite and manganese7. Based on Bloomberg New Energy Finance’s Economic Transition Scenario, we estimate North American battery minerals demand (transport and utility storage) is likely to increase between four to five-fold by 2040, relative to today8.
Frontier energy
We’re likely to see more oil and gas consumption over the next decade in North America, but we also will see much more growth in newer energy sources, including small modular nuclear reactors, geothermal, wind and solar. The rapid growth in renewable power, which is now about 15% of global power9, is increasing the demand of a number of critical minerals. Silicon, silver and aluminum are needed for solar panels with cobalt, tellurium and rare earth elements for wind. Based on Bloomberg New Energy Finance’s Economic Transition Scenario, we estimate North American renewables (solar and wind) electricity generation to at least triple on the back of increased demand for electricity by 2040, compared to 2024 levels10.
Defence
The push for materially more defence and security spending across the West, including in Canada, will require a lot more heavy equipment and the materials and minerals that go into them. A typical artillery tank requires over 20 different critical minerals across navigation, communications, and combat systems11, while an F-35 jet relies on almost 1,000 pounds of rare earth elements12. Batteries and semiconductors are also increasingly important to military operations, along with more traditional needs to strengthen artillery, naval and aerospace (antimony, beryllium, titanium, among others). And then there’s border security; tungsten is used in automobile x-rays and germanium within thermal imaging and night vision goggles.
A New Great Game
The battle for global tech supremacy between China and the U.S. is manifesting a critical mineral resource war, and a geopolitical great game for the 21st century that may soon rival the race for oilfields that came out of the Second World War or the competition for trade routes that shaped the 19th century.
For the U.S. and its Western allies, this competition is at risk of being lost to China. In areas of EVs, renewable energy, and advanced civil and defence technologies, China is proving to be as innovative as America. Global autos rely on Chinese battery technology. Ford CEO Jim Farley views China a decade ahead on battery technology – and still innovating13. On defence, China can bring on new weapons systems five times as quickly as the U.S.14.
Even more concerning is that the U.S. has little to no presence across the critical minerals value chain. The country is 100% import reliant for almost a quarter of its identified 50 critical minerals, and over 50% import reliant on 29 minerals15. In many instances, that reliance is on China. The country is the primary import source for a quarter of U.S. critical minerals and is the leading global producer of 16 of the U.S.’s list of critical minerals16.
China has dominant positions in either the production and/or refining across the six ‘core’ critical minerals, i.e., lithium, graphite, cobalt, nickel, copper, and rare earth elements (REE). At the most extreme, China has 75% or more global market share of produced and refined graphite, refined rare earth elements, and refined cobalt17. Across the entire six minerals, China has control of, on average, two-thirds of global processing/refining output18.
Critical mineral production is characterized by meaningful concentration risk
Top 3 suppliers as a percent of global supply, 2023
Source: IEA and RBC Thought Leadership
And even more so for critical mineral refining, which is dominated by China
Top 3 suppliers as a percent of global supply, 2023
Source: IEA and RBC Thought Leadership
In foreign markets, Chinese state-owned miners have meaningful operations in Peru, the Democratic Republic of Congo and Indonesia (Chinese firms control almost 75% of Indonesia’s nickel capacity)19. The country also has established investment ties and is the largest trading partner for mineral producers/refiners across virtually every country in South America, Africa, Southeast Asia and Oceania (Australia).
Playing catch-up in this rush for critical minerals will be difficult, and far more challenging than the West experienced with oil, for several reasons:
1.
Exotic minerals. Critical minerals are a varied, diverse set of both traditional and exotic minerals, with their own unique processes to both produce and refine. The process is far more complex than crude refining or natural-gas processing, which situate within a narrower molecular band of hydrogen and carbon compounds.
2.
End use matters. In critical minerals, the end use predicates the type of production and level of refinement required. For instance, primary gallium is recovered as a byproduct of processing bauxite and even at refinement, high purity gallium is refined up to 99.99999% purity.
3.
Technology. Decades of experience have allowed China to innovate refining techniques, such as perfecting the solvent extraction process to refine rare earth elements.
4.
Limited domestic resources. The U.S. has limited domestic resources of critical minerals, with less than 1% of the world’s reserves of cobalt, nickel and graphite and less than 2% of manganese and rare earth elements20.
5.
No state champions. The Seven Sisters, ancestors of British-American siblings BP, Chevron and ExxonMobil, birthed the oil industry. The seven were provided immense political (and military) assurances to traverse foreign lands in pursuit of securing reserves. In contrast, most major North American miners have smaller global footprints relative to the U.S. oil majors, especially downstream (albeit less so for Barrick Gold, Teck Resources and First Quantum Minerals).
The U.S. will be challenged to catch up to Chinese dominance, at least on its own. As a result, it’s creating new strategic spheres to secure the minerals critical to its global technological leadership, targeting resource deals – and perhaps deeper relationships – in the Ukraine, Greenland and Canada. The U.S. may even re-integrate unrestricted Russian commodities back into global markets, if that furthers its own ambitions for resource security.
Canada must be at the centre of this sphere. The country can de-risk critical mineral supply chains – reducing the reliance on China but also providing additional capacity to markets dominated by a handful of suppliers. Canada is a geologically rich, responsible mining nation with significant mineral potential including nickel, cobalt, zinc, aluminum, potash and more niche minerals such as indium, graphite, germanium and gallium. We are also a trading nation, the only G7 nation with free trade agreements across all other G7 members, complemented by a historically strong security relationship with the U.S.
How China gained the lead
The Trump Administration has made critical minerals a strategic priority. A renewed focus on defence is widely seen as a positive investment. The new administration’s executive order immediately pausing the disbursement of funds through the Inflation Reduction Act, along with recent uncertainty around the Biden Administration’s CHIPS and Scient Act, may be more problematic, as it threatens to freeze some critical investment plans at a time when Beijing is not slowing its pace. Put simply, the U.S. may need to embrace all demand drivers because China is embracing all demand drivers: batteries, renewable power, EVs, defence and AI.
We have identified four key drivers that led to China’s dominance – some of which employ industrial and foreign policy approaches that the West may be forced to take to unbalance this great imbalance:
Policy
Industrial policy targeting steel, aluminum and copper (initial industrialization) was followed by policies to further adoption of EVs and renewables. On the supply side, state assistance was provided to create national champions to compete with global majors. This was complemented with foreign policy objectives, such as One Belt, One Road, which invested $1 trillion (U.S.) in foreign countries — often in resource rich nations21. The Inflation Reduction Act was America’s industrial policy response, and while successful in stimulating capital directed towards research, development and manufacturing, little has been put towards mineral mining and/or refining.
Market
Today, China accounts for 70% of the value of global clean technology22 manufacturing within an ecosystem that is often vertically integrated; minerals are mined, refined to the specificity of end components. Demand pulls supply, which is sourced by state-owned miners operating in lower cost jurisdictions, all while being provided state support. Western miners, in contrast, are beholden to higher standards by public investors, lacking in state subsidies, and are often subject to higher social license costs in foreign resource development, given the lack of political support (state-investor dispute, versus state-state dispute).
Technology
In China, targeted state-support for both supply and demand fostered breakthroughs in technology and riding down the cost curve – especially in renewables and batteries. On the supply side, technological innovation in Chinese production and refining has allowed China to perfect the solvent extraction process to refine REEs.
Mindset
China takes a war-time mindset to allocating capital and other resources to ensure security of supply and demand through an entire value chain approach. The U.S., in contrast, lacks such urgency. It’s even moved away from strategic mineral reserves, by either not replenishing reserves relative to historical levels or, in the case of helium, selling reserves altogether. This is vastly different than the approach taken to crude oil, which maintains a strategic reserve and until 2015 had a continental export ban.
The big five: Canada’s non-fuel critical minerals
U.S. imports of all non-fuel mineral and metals reached $167 billion (U.S.) in 202423. Canada remains the largest source of U.S. imports (US$40 billion, or 24%), and is the #1 provider of steel, aluminum, potash, nickel and zinc to the U.S. (#2 for copper)24. Across the U.S.’s 50 critical minerals, Canada is also the largest source of imports (US$4.5 billion, or 20%)25.
With that said, the U.S. remains reliant on China for many less commercial yet strategically important critical minerals. Even more, China has implemented export controls on a number of these minerals, such as gallium. The economic significance from this supply risk is material; the U.S. Geological Survey estimates a 30% supply reduction in gallium (China is 90% of global supply) alone could cause a $600 billion (U.S.) drop in U.S. GDP26.
In the near to mid-term, Canada has an opportunity to gradually displace Chinese supply, while also furthering a U.S.-Canadian strategy to secure production across a range of technologies and applications critical to both continental security and the Fourth Industrial Revolution. Below, we identify five key critical minerals best situated around this opportunity.
1. Gallium
Gallium has one of the highest thermal conductivities among metals. It is used in the production of highly specialized integrated circuits and semiconductors for AI and advanced computing. Gallium-based semiconductors are also vital to U.S. next-generation missile defence, radar systems and electronic communications.
The U.S. remains 100% import reliant for its supply of gallium27. In 2024, Canada was the #1 provider of gallium metal to the U.S., accounting for over 50% of imports (effectively displacing Chinese supply)28. Current supply is sourced from recycled gallium at Neo Performance Materials’ site in Peterborough, Ontario. Rio Tinto’s Saguenay demonstration project could add another 5-10% of total global primary gallium metal production if it can reach commercial viability29. A proposed expansion at Teck Resource’s Trail, B.C. operations could also increase production of germanium and add gallium and antimony.
2. Graphite
High electric conductivity, temperature resistance, chemical inertness, and lubricity characterize this battery metal increasingly relevant in defence applications. Graphite’s unique properties make it difficult – even impossible – to substitute in many applications, such as where thermal resistance is essential to equipment performance and durability.
Global demand for graphite is forecast to nearly double by 203530. Canada has a unique opportunity to develop a full graphite value chain, a highly valuable proposition given China is 82% and 91% of global graphite production and refining, respectively31. Quebec is furthest along with Northern Graphite’s operating mine in Lac des Iles, northwest of Mt. Tremblant, and Nouveau Monde Graphite’s development projects underway for mining in Matawinie, north of Montreal, and refining in Bécancour, outside Trois-Rivieres. Ontario offers another potential graphite mine, Northern Graphite’s Bissett Creek, near the Ottawa River north of Algonquin Park, which is undergoing permitting.
3. Nickel
Nickel has high ductility (flexible), toughness and strength. The mineral is used in lithium-ion batteries and in the production of stainless steel. Global demand is forecast to grow 70% by 2035, largely on the back of demand for batteries, both within transport and stationary (utility)32.
The Dumont Nickel project (Nion Nickel) in Quebec’s Abitibi region is vertically integrated and under construction. Canada Nickel’s Crawford mine (world’s second largest nickel reserve) north of Timmins, Ontario, is undergoing permitting. Canadian nickel provides much needed diversification of supply, with Indonesia and the Philippines together alone accounting for two-thirds of global production33. Canadian nickel could exceed 100% of U.S. import needs if all projects come online34.
4. Tungsten
With the highest tensile strength (the maximum stress a material can bear without breaking) and melting point of all naturally occurring metals, tungsten-based alloys are key inputs for defence aircraft, naval vessels, and armour-piercing ammunition. Tungsten is also used within automobile x-ray machines, used in enhancing U.S. border security.
China produces 83% of the world’s tungsten and accounts for 52% of global reserves35. Canada is a past producer, with substantial reserves that include some of the world’s largest tungsten deposits. Northcliff Resources’ Sisson project, northwest of Fredericton, and Fireweed Metals’ Mactung mine, in eastern Yukon, are notable Canadian tungsten projects. In December 2024, the Canadian government and U.S. Department of Defense announced a joint investment of $35 million USD in the Mactung project, the world’s largest high-grade tungsten deposit36.
5. Germanium
The mineral has semiconducting characteristics comparable to those of silicon, but with superior optical and thermal properties. Its use is critical in night vision, space exploration, fiber optic cables, and semiconductors. The growing need for datacenters (fibre) has spurred demand in recent years.
Canada supplied 20% of U.S. germanium (oxide) imports in 202337. Canada’s Teck Resources holds an integrated germanium supply chain with zinc ores mined in Alaska and refined in Trail, B.C. The Trail facility has a proposed expansion to increase germanium production largely in response to China’s germanium export ban late last year.
Ensuring Canadian Competitiveness
Canada’s natural resource wealth has attracted natural resource investors and operators for over a century, backed by quality infrastructure, rule of law, robust environmental and labour standards, and deep trading relationships. Canada can build on those strengths, taking the following steps:
Leverage government capital. Critical mineral projects face capital shortages. Governments can help bridge this gap with either direct equity positions or by providing long-term offtake agreements. Defence procurement is a focal point, where Canadian, U.S. and allied nations defence departments can source future supply of critical minerals and stockpile reserve through “virtual inventories” or long-term purchase commitments. If Canada meets a commitment to spend 2% of GDP on defence, this could unlock as much as $17 billion of new capital, annually, for mine development.
Limit price distortions from China. The mining industry now requires a “China premium” to counteract market distortions – primarily to offset the risk of China oversupplying markets to suppress global pricing. A minimum price floor, supported by government purchase agreements and other intervenions, adds price transparency and establishes revenue certainty to buffer price fluctuations. Alternatively, restrictions on Chinese products could support domestic pricing. This includes restricting Chinese supply outright, or enacting price adjustments such as anti-dumping, countervailing duties, or border adjustments (environmental and human rights standards).
Expand tax credits. Canada’s Critical Mineral Investment Tax Credit (ITC) excludes key defence critical minerals such as tungsten, indium, and beryllium. Eligibility could be further expanded beyond the current list of 15 minerals. Other options: allow for the stacking of tax credits, introduce Production Tax Credits (PTC) to support operating expenses (buffering against Chinese dumping) and enhance various government programs to more explicitly support critical minerals, including the Strategic Innovation Fund and Canada Growth Fund.
Secure market access. Tariff threats and Buy America programs hinder capital flows into non-U.S. jurisdictions. Minimizing tariff barriers abroad and investing in domestic refining and processing capacity ultimately secures demand for our products. On the supply side, securing our own supply chain is also critically important. Gallium is a Canadian success story, but relies on imported electronics from Taiwan (via the U.S.).
Invest in human capital. The Toronto Stock Exchange and TSX Venture Exchange are home to more miners than any other major developed world index, and with them comes a deep bench of mining talent. This talent is at risk, however, as engineers and a tech-minded generation increasingly looks to software and AI for careers. One startling fact: China has 39 university degree programs to train engineers in critical minerals; Canada has none.
Reduce approval times. Canada needs to consolidate processes, where possible. Critical minerals are as strategic as transportation, and related projects can be declared to be in the national interest to accelerate their development. The same sort of pragmatism can be applied at the provincial level, where collaboration across departments, with local communities and with Ottawa can be improved. Lastly, and perhaps most importantly, we will need to find new ways to accelerate project approval processes while not undermining the duty to consult Indigenous communities. More Indigenous equity in these projects, including through the national and various provincial loan guarantee programs, can unlock greater Indigenous wealth and capital for re-investment in societal infrastructure and future resource projects.
Enabling infrastructure. Given the remote nature of many critical mineral deposits, the lack of existing infrastructure is problematic including rail, road, ports, power transmission, and cell towers. Increased collaboration by Federal and provincial governments to provide anticipatory, enabling infrastructure can support project economics and limit mine development times.
Shaz Merwat, Energy Policy Lead, RBC Climate Action Institute
John Stackhouse, Senior Vice-President, Office of the CEO, RBC
Vivan Sorab, Senior Manager, Clean Technology, RBC Climate Action Institute
Caprice Biasoni, Graphic Design Specialist
Shiplu Talukder, Digital Publishing Specialist
Natural Resources Canada
Center for Strategic and International Studies, Critical Minerals and the Future of the U.S. Economy, February 2025; Natural Resources Canada
Natural Resources Canada
U.S. Geological Survey
Deloitte, 2025 Global Semiconductor Industry Outlook
Arrow Electronics, Silicon vs. gallium nitride (GaN) semiconductors: Comparing properties & applications, March 21, 2024
IEA, Minerals used in electric cars compared to conventional cars, May 5, 2021
Bloomberg New Energy Finance, RBC Thought Leadership
IEA, Renewables 2024, October 2024
Bloomberg New Energy Finance, RBC Thought Leadership
Natural Resources Canada
Science History Institute, Manufacturers Case Study, Using the Rare Earth Elements
Wall Street Journal, What Scared Ford’s CEO in China, September 14, 2024
Center for Strategic and International Studies, Critical Minerals and the Future of the U.S. Economy, February 2025
Ibid
Natural Resources Canada
IEA, Global Critical Minerals Outlook 2024, May 2024
Ibid
Reuters, Chinese firms control around 75% of Indonesian nickel capacity, report finds, February 5, 2025
Center for Strategic and International Studies, Critical Minerals and the Future of the U.S. Economy, February 2025
AidData, Power Playbook: Beijing’s Bid to Secure Overseas Transition Minerals, January 28, 2025
IEA, Energy Technology Perspectives 2024, October 30, 2024
U.S. International Trade Commission, data accessed via DataWeb
Ibid
U.S. Geological Survey Mineral Commodities Survey; U.S. International Trade Commission, data accessed via DataWeb; USA Trade Online, U.S. Census Bureau
U.S. Geological Survey
Ibid
U.S. International Trade Commission, data accessed via DataWeb; USA Trade Online, U.S. Census Bureau
Company website
Natural Resource Canada
IEA, Global Critical Minerals Outlook 2024, May 2024
Natural Resources Canada
IEA, Global Critical Minerals Outlook 2024, May 2024
Company website
IEA, Global Critical Minerals Outlook 2024, May 2024
Natural Resources Canada
U.S. International Trade Commission, data accessed via DataWeb; USA Trade Online, U.S. Census Bureau
U.S. tariffs looming over Canada’s economy demand an urgent, forceful and strategic response. The next 30 days are critical: Canada must demonstrate to Washington that America’s path to energy and economic security depends on Canada. Especially, Canadian resources.
A focus on key commodities can underpin a broader Canadian industrial resurgence that boosts Canadian GDP, revitalizes technical innovation, attracts foreign and domestic investment in several key areas, enhances productivity and accelerate Indigenous investments in resources. That would make us indispensable to U.S. interests, and a key pillar of its economic and energy strategy.
Focusing on specific commodities can also drive a renaissance in Canada’s manufacturing and ancillary services, and can ensure robust Canadian sustainability policies, such as methane capture and conservation, advance emission reductions across the value chain. In other words, a resource-focused economic strategy need not be a strip-and-ship strategy.
There’s a broader imperative, too: geographic diversification. U.S. tariffs of 25% on all steel and aluminum imports from Canada and other countries highlight the urgency of finding new markets. Resource expansion would further derisk large-scale commodity projects and boost Canadian agriculture, materials and energy exports to Asia and Europe. Over time, this could widen the door to greater trade with many of the world’s largest and fastest-growing countries. Strategically owning parts of the value chain raises our global profile, boosts our leverage in trade negotiations with the U.S. and other partners, and makes us more resilient to shifting geopolitics.
Washington already recognizes Canada’s resource strength. The decision to impose less-punitive 10% tariffs on Canadian energy compared to 25% on other goods was a tacit U.S. acknowledgement of the strategic importance of resources to American interests. We need to seize on that geo-strategic edge and elevate commodities, and their end products, in future trade negotiations with Washington.
Here are three strategic sets of resources Canadian negotiators can focus on to deepen one of the world’s most valuable economic partnerships:
1. Abundant Canadian oil, gas and power can underpin America’s energy ambitions
Canada’s exports of oil, gas, and electricity strengthen U.S. energy reserves, reduce consumer costs, and support American objectives to expand international energy exports to global allies. Deep north-south integration of North American energy infrastructure means efforts to diversify away from Canada would be costly and time-consuming.
Although a net exporter of oil and natural gas, the U.S. is looking to help Europe and allied Asian countries reduce their reliance on less-friendly energy sources, while meeting its growing domestic demand. American reserves are plentiful but energy-intensive data centres to power artificial intelligence, and other technologies, are straining capacity. Stable Canadian energy production can add to U.S. supply through integrated pipelines and grids. That would give the U.S. a cushion to export oil and natural gas to global allies without raising prices at the pump for domestic consumers-a key Trump priority.
Oil: 60% of U.S. imports1
Canada’s advantage: Canadian oil can backstop U.S. efforts to become the de facto global swing oil supplier.
Canada’s share of U.S. crude oil imports has grown significantly over the past few decades, and now represent 24% of total U.S. oil consumption2. Cross-border pipelines deliver heavy crude directly to U.S. refineries that are specifically designed to process it. For these refineries, particularly those in the Midwest, moving away from Canadian heavy crude would leave them with high retooling costs or dependent on alternative sources such as Venezuela or the Middle East, exposing them to geopolitical risks. Recently, the Trans Mountain pipeline expansion has nearly tripled Canada’s oil shipping capacity to tidewater markets, carving out a role for Canada’s oil in supporting global allies, such as South Korea and Japan.
Electricity: 90% of U.S. imports3
Canada’s advantage: Low-cost and clean Canadian electricity can power several U.S. efforts including artificial intelligence, advanced manufacturing and advanced technology products.
Although the U.S. generates most of its own electricity, Canadian supplies keep the lights on and costs low across several U.S. states. New projects, such as Hydro-Quebec’s Hertel-New York powerline, aim to further increase electricity exports by providing 20% of New York City’s electricity needs, saving its residents an estimated $17 billion in electricity costs over the next three decades4.
With more than 30 cross-border transmission lines linking Canadian provinces with American states, Canada is essential for ensuring cross-border grid security and a potential source for incremental generation. For example, the rapid growth of AI technology–a U.S. strategic priority–is expected to drive a sharp increase in electricity consumption from U.S. data centres, which is estimated to account for up to 12% of U.S. total consumption by 2028, compared to 4.4% in 20235.
Natural Gas: 99% of U.S. imports
Canada’s advantage: Canadian natural gas can help America ensure ample domestic supplies and room for exports to allies in Europe and Asia.
Higher U.S. natural gas demand is expected to outpace supply growth in the next two years, according to the U.S. Energy Information Association. In addition, demand from data centres and reshoring of manufacturing could further strain natural gas power generation. Canadian natural gas is well positioned to meet supply gaps, and already accounts for 9% of total U.S. natural gas consumption with the capacity to expand further.
Canada is also poised to become a significant supplier of liquefied natural gas (LNG), and is uniquely positioned to export energy to strategic Asian allies. With six West Coast LNG projects proposed and under construction, including LNG Canada Phase I which is set to come online this year, Canada is estimated to have a total export capacity of 6.26 billion cubic feet per day (bcfd). This proposed capacity would put Canada among the top five global LNG exporters at current levels. In addition, West Coast terminals are strategically located just 10 shipping days from Asia, compared to 20 days for U.S. Gulf Coast exporters via the Panama Canal.
2. Canadian agriculture would strengthen American food security
Canada is a major part of the North American breadbasket, providing a stable and reliable supply of agricultural commodities that supplement the United States’ strengths in the sector. As a key provider of essential inputs like potash and seed oils, Canada supports U.S. food and biofuel production. With the U.S. facing potential labour shortages due to a crackdown on illegal immigration, Canada can help supplement this gap in the short term, while adding to continental food security in the long term.
Potash: 85% of U.S. imports
Canada’s advantage: Canadian potash, a critical fertilizer component, can boost American crop yields amid extreme weather patterns, reinforcing continental food security and supply chain stability.
With growing food demand, there’s significant potential to strengthen this partnership. The Jansen potash mine, slated to begin operations in 2026, is projected to boost Canadian potash production by 4.2 million tonnes per year (mtpa), with potential expansion up to 8.5 mtpa by 2029—boosting Canadian capacity by more than a third. The new project would raise Canada’s global market share to nearly 40% by 2026. The increased production will not only bolster American food security but also help displace potash exports from non-aligned nations such as Russia and Belarus.
Canola oil: 98% of U.S. imports6
Canada’s advantage: Canola, a product developed in Canada, can play a key role in U.S. food security and meeting biofuel demand.
Canada provides a stable and diverse supply of agricultural products to the U.S., second only to Mexico. The U.S. is heavily reliant on Canadian canola oil, which account for 98% of its total imports, and is a key input in U.S. food production and renewable fuels.
Canada is also the top U.S. import source for cereal products, underpinning the deeply integrated cross-border supply chain in these sectors.
Meat: 34% of U.S. imports
Canada’s advantage:Canadian meat, including bovines and swine, are an important part of the meat feedstock into the U.S.
Animal proteins will continue to play a significant role in American diets, with per capita consumption in the U.S. projected to increase from 68.7 kilograms in 2023 to 74.6 kilograms by 20288. Canadian meat producers are essential in meeting this rising demand, as the U.S. already imports 33% of its beef and 66% of its pork from Canada7. The strong integration between Canadian and American meat markets is driven by high safety standards, a similar market structure, and alignment on product quality. As a result, Canadian meat not only supports U.S. domestic consumption but also contributes to American meat exports to global markets.
3. Canadian critical minerals and uranium can power advanced technologies in North America
The U.S. has reserves of many of the critical minerals needed in semiconductors and other sensitive technologies. Its uranium reserves are also able to help build out a new wave of nuclear power projects. It’s aiming to mine and enrich as much as possible within its borders to displace supplies from China and Russia but faces constraints, especially in adding enrichment capability. Canada has capacity in key complementary areas, like uranium conversion, that can help the U.S. build out an efficient North American value chain.
Critical minerals: 19% of U.S. imports, in total minerals and metals9
Canada’s advantage: With the right investments and innovation, Canada can advance production of several critical minerals.
The new U.S. administration is looking to accelerate several critical mineral projects and considering opportunities to advance activity within the Quadrilateral Security Dialogue, comprising the U.S., India, Japan, and Australia. Although outside this alliance, Canada is a player in the critical minerals space. It is a top 10 global producer and already a major supplier to the U.S. for aluminum, iron, steel, copper, nickel and more.
Canada has been working toward U.S. efforts to reduce reliance on China, from establishing a Canada-U.S. Joint Act Plan on Critical Minerals to $3.8 billion in public investments to ramping up exports to the U.S. of gallium and germanium, both impacted by Chinese export controls. Canada’s existing extraction and processing infrastructure could further fill U.S. gaps in key areas, such as aluminum, nickel and zinc.
Uranium and nuclear expertise: 27% of U.S. imports, in uranium
Canada’s advantage: America’s path to nuclear renaissance goes through Canada—the world’s second largest producer of uranium after Kazakhstan.
The energy source is increasingly important to meet growing electricity demand to power AI data centres and other energy-intensive strategic advanced technologies. As the largest uranium supplier to the U.S., Canada can be an important part of the continental nuclear fuel cycle with world-leading technology and talent, small modular reactors (SMRs), and an 89,000-strong nuclear workforce honed through work on CANDU projects.
What Canada can deliver in advancing U.S. interests
In the short-term, there’s an urgent need for Canada to realign our economic interests with the U.S. For its part, the U.S. can go it alone, but it’s going to be a harder, costlier and longer route to self-sufficiency. A shifting economic and geopolitical environment behooves both to collaborate in the three core areas of mutual benefit.
This strategy heavily depends on the U.S. getting on board. We have a short window to convince Washington about the need to collaborate in the resource and energy space, which has been weaponized by several non-allied actors.
Canada also needs to get its own house in order.
A resource-focused economic and trade strategy would require billions of dollars in new infrastructure, including rail lines, seaports and processing facilities. However, domestic and foreign capital will only come to the table If there’s a stable regulatory environment and reliable pricing in what can be highly volatile markets.
These are not new challenges for Canada. Regulatory and policy uncertainty have hobbled economic development for decades. So, too, has lack of reliable demand from our major trading partners, including the U.S.
Resource production and processing calls for longer-term thinking, which will require the federal and provincial governments to work together to create entities, and strengthen existing ones, to attract and retain capital, and protect against extreme price volatility. We will also need to ensure our education systems are geared towards attracting the right talent and skills to ensure the economy is poised for long-term growth. And while positioning Canadian resources anew in the U.S. market, we will need to improve our trading relationships with many other countries and regions.
All this will require a different mindset among Canadians, to ensure our natural resources are not seen as a trading card with the U.S., but rather a strategic platform for growth, and prosperity, for decades to come.
It can be Canada’s greatest resource play.
Contributors:
Salim Zanzana, Economist, RBC Economics
Varun Srivatsan, Director of Policy, RBC Thought Leadership
Average last 5 years as 2023 figure distorted due to droughts affecting Canadian generation and export capacity.
2024 Fall Economic Statement
U.S. Department of Energy “Evaluating the Increase in Electricity Demand from Data Centers”
Includes imports of products under HS code 1514 in 2023
Agriculture and Agri-Food Canada “Sector Trend Analysis – Meat Trends in the United States”
Includes products under HS codes 0201 and 0202 for beef and 0203 for pork in 2023
United States International Trade Commission
Artificial intelligence (AI) is rapidly reshaping the global economy, driven by Big Tech’s breakthrough apps such as OpenAI’s ChatGPT. Businesses are eyeing ways to transform their operations through AI, which has serious implications—transformative and disruptive—for the wider economy. At the heart of this AI-driven transformation are data centres, the crucial infrastructure powering applications, from simple queries to complex generative tasks.
Every AI prompt requires significant computing power. A single ChatGPT query consumes 10 times more energy than a standard Google search. More advanced AI operations such as generating text or images, exponentially spike power consumption. Canadian data centres’ rising energy demands make them a major driver of electricity demand growth. If all the data centre projects currently being reviewed by regulators proceed, they would account for 14% of Canada’s total power needs by 20301, similar to 12-15% by 2030 in the U.S.2
The development of these data centres, likely between 20 to 30, would result in $100 billion in capital expenditures related to the construction and build of accompanying IT infrastructure3. However, AI’s energy-intensive nature raises concerns about power availability, grid reliability and its implication on emissions.
The power behind ChatGPT: How data centres process search queries
Key Findings
Canadian regulators are reviewing data centre applications with an estimated combined capacity of 15 gigawatts—enough to power seven out of 10 homes nationwide.
AI is the primary driver of this surge, with data centres offering a $100 billion economic opportunity for the construction and build out of data centres and accompanying data infrastructure.
Canada’s clean energy resources offer a strategic advantage for AI-driven growth. However, natural gas remains a critical part of the mix due to its reliability. Nuclear power is also an option but with a considerably longer lead time.
Canada’s annual emissions could rise 3%, if natural gas powers six additional gigawatts of data centres. However, carbon capture and storage (CCS) could throttle the rise of emissions.
Local data centres strengthen Canada’s position in AI by securing data sovereignty and enhancing cybersecurity.
Streamlining AI governance across Canada and the U.S. is a key next step in securing North American leadership. A review of CUSMA in 2026 would likely see refinements to the digital trade chapter.
Targeted efforts to increase AI adoption among Canadian SMEs—which account for half of Canadian GDP—could help reverse Canada’s lagging productivity.
A new trading chip
Canada faces a strategic moment as it captures the AI opportunity. Beyond the economic incentives, local data centres are essential for ensuring data privacy, national security, and resilience against cyber threats.
We can leverage our prodigious hydro, natural gas and nuclear power to emerge as a low-cost data centre hub. We can also build on this advantage further by harnessing AI’s power to boost Canadian productivity, enhance our competitiveness, and deepen our digital talent pool.
The AI opportunity also has trade and geopolitical implications, especially as Canada needs ever more chips to bargain with a transactional U.S. administration-in-waiting. With Washington increasingly focused on China, data sovereignty could become a key focus over the next few years. This provides Canada plenty of opportunities—but also some risks.
We could be a valuable partner for the U.S. and create a digital North American fortress, securely warehousing critical data at low cost. But that would require a realignment on data sovereignty between the two countries, which would most likely occur at the next round of Canada-United States-Mexico Agreement (CUSMA) in 2026.
A modernized digital trade chapter—Chapter 19—was a factor that drove Washington to seek a revised trade agreement during U.S. President Donald Trump’s first term. The next iteration of Chapter 19 could increase the focus on compatibility of North American data, both in terms of cross-border transfers and AI governance.
Powering up data centres
Substantial demand from “hyperscalers”—data centres with large compute capabilities—could strain Canada’s grid and drive up power bills, putting governments and regulators in a bind, as recently evidenced with the U.S. federal energy regulator’s refusal to allow Amazon Inc. to purchase more power from a Pennsylvania nuclear facility on the grounds it would raise customer rates and threaten grid reliability.
It also comes at a time many Canadian provinces are already facing sizeable power demands from population growth and electrified transport, as well as ambitions to decarbonize heavy industries. All told, Canada’s power demand was already set to double by 2050, potentially even triple4. And that was before AI became a compelling need for the global economy.
Canada has several energy sources it can draw on to power data centres, but each comes with its own challenges and considerations:
Wind and solar: growing sources of power but in the absence of storage, their intermittency makes them unsuitable for data centres that demand consistent baseload power.
Nuclear: The emerging energy of choice for Big Tech in the U.S. It’s an option in Ontario, too, but would require long lead times stretching out to a decade, if not more. Nuclear remains a viable long-term solution.
Hydro: Several provinces such as Quebec and British Columbia already rely heavily on the power source, and, like nuclear, would require a long time to boost capacity.
Natural gas: Alberta’s preferred option, and a key part of Ontario’s transition until 2040. But powering AI through natural gas comes with an emissions cost that provinces will need to weigh.
Provincial Imperatives: Honing regional approaches to AI
Provinces will ultimately drive Canada’s AI ambition.
Alberta, with ample natural gas and lower grid pressures, prefers data centres operate off-grid, minimizing the strain on public grids. The “bring your own power” (BYOP) model allows for faster deployment and supports local natural gas prices, driving economic benefits for the province. It is also aligned with the proposed Canadian Electricity Regulations, given the facilities would not be net exporters to the grid. However, BYOP is not necessarily a viable model for all Canadian jurisdictions.
Quebec, with its rigorous environmental standards and cap-and-trade system, prioritizes low-emission solutions. The province’s hydro power provides clean energy but its capacity to meaningfully expand hydro in the short term is limited. British Columbia faces similar constraints, with a preference for hydroelectric power and tight regulations on carbon-intensive energy sources.
Ontario’s more flexible energy policy allows for a mix of solutions. Its population density and industrial base create competing demands for grid capacity—from electric vehicle and battery supply chain to greenhouses. The province’s primary challenge will be to strike a balance between these competing needs.
Decisions about where and how to build data centres will involve a complex matrix of economic, environmental, and social factors. Our research shows that data centres rank higher in GDP impact compared to, say, manufacturing and transport, but contribute fewer jobs compared to those industries.
That’s where federal and provincial alignment will be critical to Canada’s AI strategy. Policymakers will need to create frameworks that allow provinces to develop bespoke policies that balance growth, sustainability and the demands of the new economy. This includes targeted support for AI adoption among SMEs and ensuring that data centres contribute to productivity gains across sectors. For example, as part of a greater commitment to invest $25 billion in Canadian data centres, Amazon Web Services (AWS) apportioned dedicated compute capacity to the University of Alberta in 2023, sourced from a recently completed $4-billion cloud computing data centre in Calgary.
Power Supply: Capturing the ‘hyperscaler’ opportunity
Data centres require vast amounts of electricity, ranging from 200 megawatts to 500 megawatts. Canada’s low-cost, clean energy gives it a significant advantage. Hydroelectric and nuclear power in cities like Montreal, Vancouver, and Toronto offers some of the cheapest and cleanest electricity in North America. Comparatively, U.S. industrial power prices in key data centre states such as Arizona, Illinois, and Texas are on average 30-40% more expensive, and that excludes their warm climates adding an extra 20-40% power for cooling purposes.
Global hyperscalers are seizing on the Canadian opportunity. We estimate various provinces are reviewing applications for 15 GW of new data centre capacity—a 20-fold increase from current levels5 and enough to power 70% of Canadian households today. In addition, the “expressed interest” in data centres is likely far greater. Alberta alone is being pitched proposals for 50 projects with a combined capacity of 20 GW6.
The mass electrification of the economy is already expected to place unprecedented demand on Canada’s grids. Canada’s power generation is expected to reach 750 GWh7 over the next ten years, compared to an estimated demand of 875 GWh8, implying a shortfall of about 15%. It underscores the need for careful resource management.
Emissions: Leveraging carbon capture
AI’s energy footprint raises concerns about Canada’s climate goals. With provinces being asked to provide power for important industries such as heavy industry, liquefied natural gas electrification and greenhouses, most provinces will have to determine where data centres fit with their economic priority and emissions-cutting ambitions.
Data centres depend on consistent baseload power, which wind and solar cannot reliably provide due to their intermittent nature. New renewable projects are also facing opposition in certain jurisdictions. Natural gas, with its reliability as baseload power and quick scalability, can fill the gap.
However, using gas for data centres raises emissions concerns. If natural gas powers six additional gigawatts of data centres, annual emissions could rise by 16 million tonnes of CO2e—a 3% increase9 in Canada’s total emissions.
Carbon capture and storage (CCS) could throttle the rise of emissions. In Alberta, companies are already in discussions to incorporate carbon capture into gas-fired power plants for data centres. That would alleviate environmental concerns, leverage existing energy infrastructure and drive further investments in natural gas production and the development of CCS.
Big Tech companies, that are investing heavily in nuclear power in the U.S. to feed their AI operations, could replicate that playbook with abated natural gas in Canada.
However, the high costs and technical complexities of CCS mean it’s not an all-of-Canada solution. While the CCS technology is readily transferable, only Alberta and Saskatchewan have the required geology and infrastructure in Canada to store carbon.
Economy: Unlocking a $100-billion opportunity
The digital economy is expanding rapidly, from cloud computing to AI applications, and transforming every aspect of the economy.
Current estimates suggest the digital economy accounts for 6.3% of Canada’s GDP, but broader estimates place it at 15%—and it’s growing 2.5 times faster than conventional economic sectors10. Data centres are critical to this digital ecosystem, hosting and processing the vast volumes of data generated by AI and other advanced technologies. Development of the proposed data centres alone could spark a $100-billion construction and IT infrastructure boom, in addition to its positive impact on the wider economy.
But there’s an even greater prize for Canadian businesses: an AI ecosystem that helps them gain a competitive edge in areas as diverse as healthcare, autos, manufacturing and clean-tech. That could be in the form of AI revolutionizing biotech research, accurately detecting weather patterns, or improving navigation in autonomous vehicles.
Canada’s AI adoption, however, lags its peers. Only 35% of Canadian firms use AI, compared to 72% in the U.S.11 The discrepancy is partially due to the high percentage of small and medium-sized enterprises (SMEs) in Canada, which employ 65% of the private workforce12. SMEs often lack the capital and talent to invest in cutting-edge technology. Addressing this gap is essential to boosting Canadian productivity, which has been in decline for more than 30 years13. With its R&D spending at 1.7% of GDP14—less than half of U.S. levels—Canada faces an urgent need to increase investment in AI and technological innovation.
The federal government has taken steps to close the productivity gap, launching initiatives such as the $2-billion AI Compute Access Fund to boost Canadian businesses’ technological capabilities. The fund aims to deliver computational power needed to drive innovation in both large companies and SMEs.
Bridging the AI adoption gap is critical not only for immediate economic gains, but also for positioning Canada as a global leader in the technology. This includes deepening the country’s AI-ready workforce, with training programs and partnerships with academic institutions key to fostering a new generation of AI professionals.
Data Security: Safeguarding sovereignty and privacy
Data sovereignty is also crucial. Canada’s strict data privacy laws mandate that sensitive information remains within its borders, ensuring compliance and protecting citizens’ privacy. As digital data grows, so do cyber risks. IBM reports 27,000 data breaches in Canada annually, with potential economic losses in the billions.
But keeping data within borders has two inherent tradeoffs: on power and trade. Data centres’ impact on the grid, to date, has been marginal given that in Canada they are used largely for hosting purposes. The proliferation of AI and resulting power draw from hyperscalers, however, accentuates this tradeoff. Most likely, segments of demand will still likely require to be hosted locally, i.e., for economically sensitive areas such as government, healthcare, banking and insurance, and research and development where latency can impact effectiveness. For other pockets of demand, such as e-commerce, an integrated North American data corridor, as envisioned by OpenAI CEO Sam Altman, could result in comparative advantages for less constrained jurisdictions to power North America’s AI economy. But that would require greater collaboration between Canada and the United States.
Data centres can also help Canada build on its AI expertise. The country has been a leader in AI research since the 1980s, thanks to renowned academics including Geoffrey Hinton and Yoshua Bengio. Yet, the country’s lack of domestic AI infrastructure threatens its leadership. To remain competitive, Canada must likely prioritize dedicated data resources for public sectors such as healthcare, education, and defence. These resources are essential for fostering innovation and maintaining Canada’s technological edge.
Conclusion
There’s an opportunity for Canada to build on its AI leadership beyond economic considerations and productivity. An AI ecosystem can infuse the wider economy with tools that crunch big data and algorithms to boost domestic companies’ competitiveness in areas as diverse as healthcare, clean-tech, manufacturing and services and transportation and logistics.
A flexible approach, combined with federal collaboration, would ensure Canada’s AI infrastructure powers the digital economy in a way that aligns with the country’s broader sustainability, security, and economic goals.
Contributors:
Shaz Merwat, Energy Policy Lead, RBC Climate Action Institute
Yadullah Hussain, Managing Editor, RBC Climate Action Institute
Caprice Biasoni, Graphic Design Specialist
Shiplu Talukder, Digital Publishing Specialist
The data centre power estimate is based on the current set of data centre projects believed to be in application with provincial electricity regulators. Total estimated power consumption for Canada by 2030 is taken from the Canada Electricity Advisory Council.
As estimated by S&P Global, BCG and McKinsey.
Estimate is based on total data centre build costs, including land costs, construction costs, and accompanying data processing and networking, and power and cooling expenses.


 EN
EN