EN
EN 

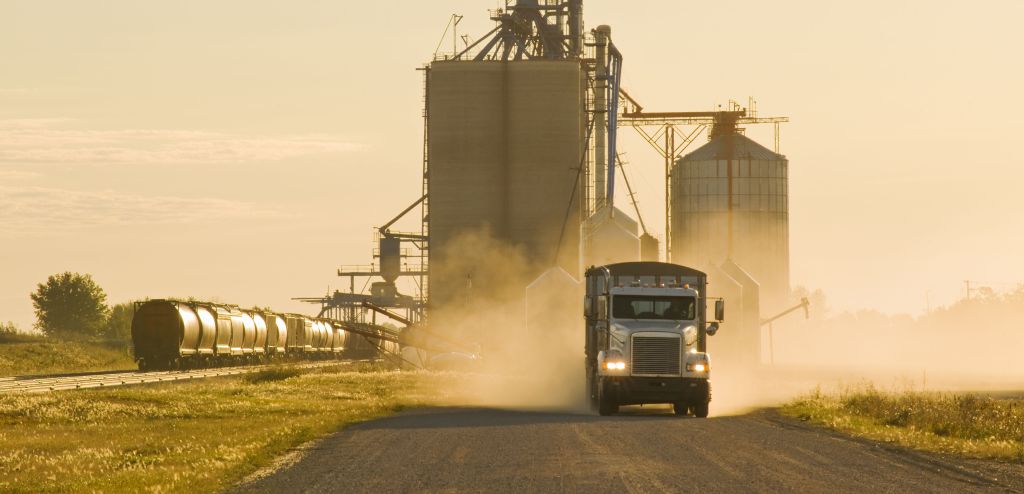
Despite recent crop and export volume hitting records, a key risk to the Canadian grain sector is its ability to move its products to overseas markets efficiently and reliably. Infrastructure—particularly rail networks and port terminals—isn’t keeping pace with the growth of bulk commodities like wheat and canola. The risks of disruption leaves money on the table for farmers and limits investment and business opportunities—all while Canada seeks to diversify and expand its trade.
Targeted infrastructure investments can mitigate the risks of disruption and congestion, but that requires agriculture to receive the same focus as other critical sectors in the nation’s conversation about competitiveness and growth.
Export Development Canada notes that the country’s infrastructure investment trails many OECD peers, and the ratio of infrastructure investments to trade volumes has been falling.1 Canada has an overall infrastructure deficit ranging from between $110 billion to $270 billion,2 and investments for railways and seaports needed by 2070 are estimated at $284 billion and $110 billion, respectively.3
Ag is a national priority
-
The agriculture and agri-food sector contributes more than $150 billion to GDP and supports 2.3 million jobs. It is export-dependent, sending more than $100 billion in agriculture products to international markets, making it the 9th largest globally.4
-
The ranking follows a decades-long story of crop productivity gains, both in efficiency and absolute terms. Since 2000, Canadian wheat production has grown by an annual average of 3.9%, and canola yields by annual average 3.4%, meaning farmers are getting more output from the same area of land.5
-
The U.S. accounts for more than 60% of Canada’s agri-food exports1. As Canada looks to become less reliant on a single customer across all sectors, more agri-food export sales will have to come from overseas markets in Asia and Europe, with commodities primarily shipping through the west coast.
-
The Port of Vancouver moved a record 170 million metric tons of cargo in 2025, 30 million of which were bulk grains. Prince Rupert is also a growing western alternative corridor, handling 26 million metric tons of goods in 2025, up 14% from the year prior.6
Exports are at risk of disruption
Canada’s port and rail network is strained with several bottlenecks, with a history of disruptions:
-
The 57-year-old Second Narrows Rail Bridge is the crossing for 50% of the country’s grain production that moves through the port, and nearly a third of all cargo. It is the key rail path to the North Shore terminal for servicing grains, potash, and coal. In February 2026, the bridge was locked in its down position due to a mechanical problem, which halted ships access to the inlet for four days.
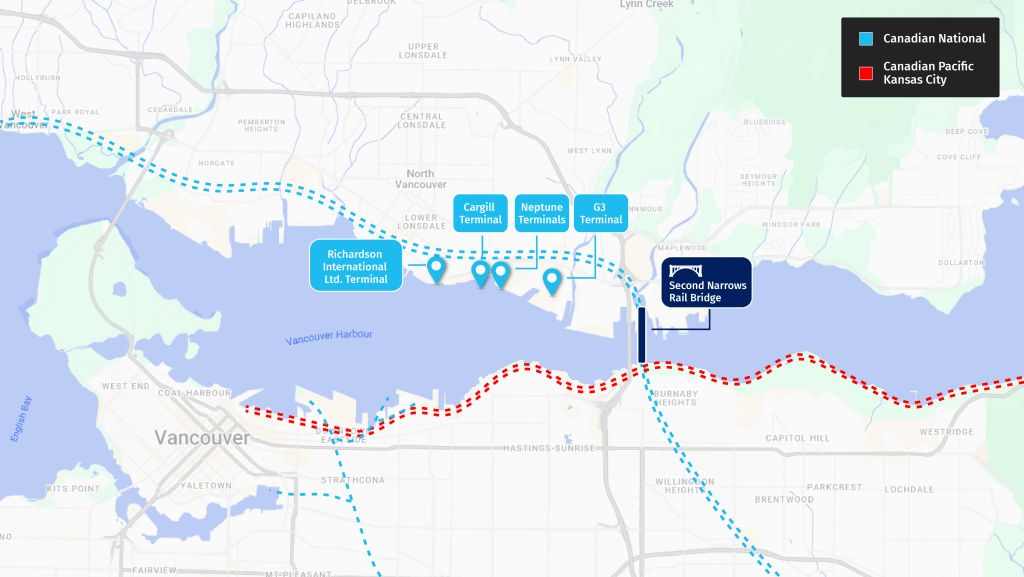
Figure 2. Second Narrows Rail Bridge: Critical chokepoint connecting shipments to the Port of Vancouver’s North Shore terminals operated by G3, Cargill, and Richards, as well as Neptune potash and coal terminals
-
U.S. ports offer alternative export terminals for some commodities, particularly potash, for several reasons—favourable labour conditions and less port congestion among them. This is leading some Canadian businesses to consider large terminal investments on U.S. shores, rather than Canada. Bulk Canadian grain has no such relief for overseas markets and moves almost exclusively through Canadian ports, creating vulnerabilities at the country’s critical choke points.
-
Labour issues can also come into play. In 2024, a four-day Grain Workers Union strike cost the sector an estimated $35 million per day in stalled export shipments.7 These vulnerabilities lead to lower profits for farmers and more hesitation from international buyers.
-
If a significant disruption shuts down either Canadian National Railway Company (CN) or Canadian Pacific Kansas City (CPKC) railways for a single week, the estimated economic damage to the grain industry from lost sales, contract penalties and other costs could reach $250 million8.
New investments are helping, but much more is needed
-
The federal-government owned Trans Mountain Expansion Pipeline shows how new infrastructure investments in one sector can relieve pressure for another. When the oil pipeline capacity grew to 890,000 barrels per day, Canadian crude-by-rail dropped to the lowest levels since 2012,9 freeing up capacity for Western grains, pulses, and oilseeds, and other commodities.
-
Investments like DP’s World’s Port Authority Rail Yard project at the Fraser Surrey Terminal in Surrey, British Columbia, aim to improve handling capacity and efficiency for agricultural exports. The newly announced Canada-British Columbia Cooperative Prosperity Agreement includes $10 billion in federal funding to upgrade the Roberts Bank Terminal 2 in Delta, B.C., along with other potential investments at the Prince Rupert port, further north of the province. (For more on this topic, listen to the Disruptors podcast discussing the Roberts Bank Terminal 2 expansion).
-
Other efficiency enhancements underway at the Port of Vancouver include the port’s new Active Vessel Traffic Management Program (AVTM) and a centralized scheduling system, which coordinate bridge lifts and vessel movements with train scheduling and reduce delays10. Improving methods for loading grain in the rain, which can halt loading between 30-60 days a year, can also increase port turnaround times.
Recent years have shown where Canada’s transport system is fragile. The rail and port infrastructure decisions made over the next few years will influence how gains in productivity translate into stronger export growth, and whether the country’s supply chains stay anchored in Canada. Addressing these acute risks should be core to Canada’s nation-building conversation, and large capital investments are needed alongside supply chain efficiency improvements. Farmers have done their part to boost production—the systems moving the output need to keep up.
Berz, Darwin et al. (2020). 15 things to know about Canadian Infrastructure. Boston Consulting Group.
Analysis from Deloitte, commissioned by the National Transportation Supply Chain Task Force and considers data from Statistics Canada, Oxford Economics and Deloitte.
Calculated using data from Statistics Canada. Table 32-10-0359-01 Estimated areas, yield, production, average farm price and total farm value of principal field crops, in metric and imperial units
Anderson Economic Group, LLC. (2026) Economic Impacts of Transportation and Labour Disruptions on Canada’s Grain Sector. Prepared for The Strategic Issues Subcommittee of the Crop Logistics Working Group.