WP Menu

wp-menu

Despite recent crop and export volume hitting records, a key risk to the Canadian grain sector is its ability to move its products to overseas markets efficiently and reliably. Infrastructure—particularly rail networks and port terminals—isn’t keeping pace with the growth of bulk commodities like wheat and canola. The risks of disruption leaves money on the table for farmers and limits investment and business opportunities—all while Canada seeks to diversify and expand its trade.

Targeted infrastructure investments can mitigate the risks of disruption and congestion, but that requires agriculture to receive the same focus as other critical sectors in the nation’s conversation about competitiveness and growth. 

Export Development Canada notes that the country’s infrastructure investment trails many OECD peers, and the ratio of infrastructure investments to trade volumes has been falling.1 Canada has an overall infrastructure deficit ranging from between $110 billion to $270 billion,2 and investments for railways and seaports needed by 2070 are estimated at $284 billion and $110 billion, respectively.3

  • The agriculture and agri-food sector contributes more than $150 billion to GDP and supports 2.3 million jobs. It is export-dependent, sending more than $100 billion in agriculture products to international markets, making it the 9th largest globally.4

  • The ranking follows a decades-long story of crop productivity gains, both in efficiency and absolute terms. Since 2000, Canadian wheat production has grown by an annual average of 3.9%, and canola yields by annual average 3.4%, meaning farmers are getting more output from the same area of land.5


  • The U.S. accounts for more than 60% of Canada’s agri-food exports1. As Canada looks to become less reliant on a single customer across all sectors, more agri-food export sales will have to come from overseas markets in Asia and Europe, with commodities primarily shipping through the west coast.

  • The Port of Vancouver moved a record 170 million metric tons of cargo in 2025, 30 million of which were bulk grains. Prince Rupert is also a growing western alternative corridor, handling 26 million metric tons of goods in 2025, up 14% from the year prior.6

Canada’s port and rail network is strained with several bottlenecks, with a history of disruptions:  

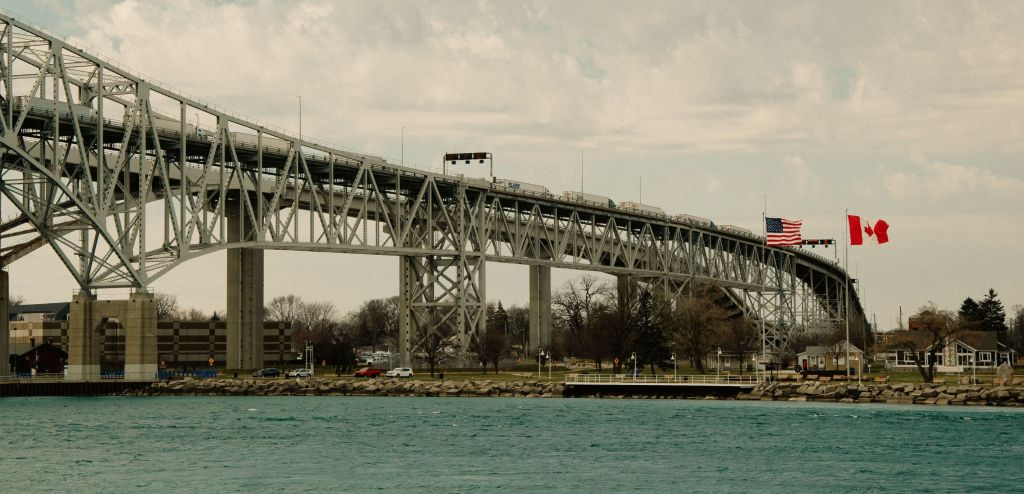
  • The 57-year-old Second Narrows Rail Bridge is the crossing for 50% of the country’s grain production that moves through the port, and nearly a third of all cargo. It is the key rail path to the North Shore terminal for servicing grains, potash, and coal. In February 2026, the bridge was locked in its down position due to a mechanical problem, which halted ships access to the inlet for four days.  
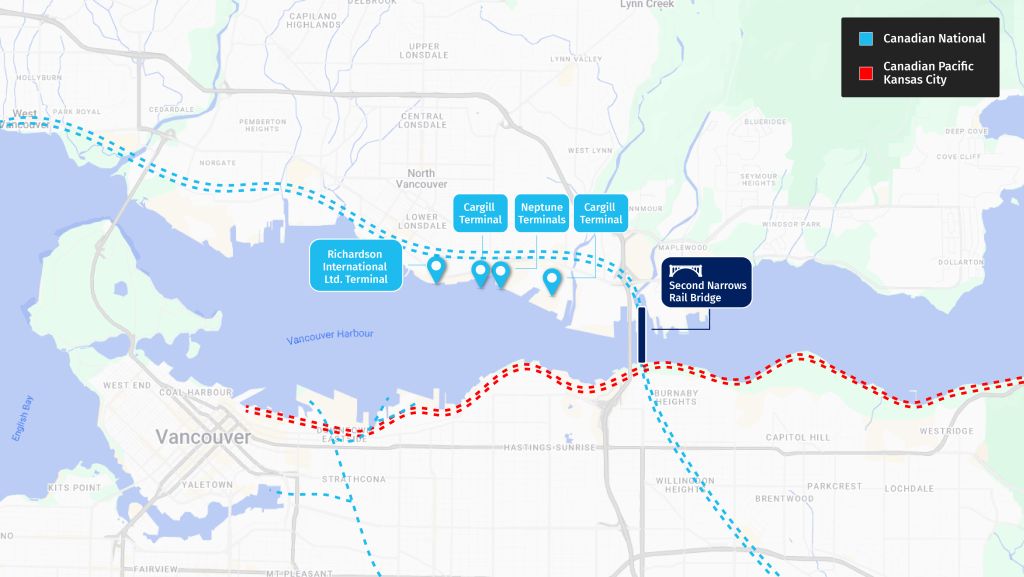
    Second Narrows Rail Bridge: Critical chokepoint connecting shipments to the Port of Vancouver's North Shore terminals operated by G3, Cargill, and Richards, as well as Neptune potash and coal terminals

    Figure 2. Second Narrows Rail Bridge: Critical chokepoint connecting shipments to the Port of Vancouver’s North Shore terminals operated by G3, Cargill, and Richards, as well as Neptune potash and coal terminals

  • U.S. ports offer alternative export terminals for some commodities, particularly potash, for several reasons—favourable labour conditions and less port congestion among them. This is leading some Canadian businesses to consider large terminal investments on U.S. shores, rather than Canada. Bulk Canadian grain has no such relief for overseas markets and moves almost exclusively through Canadian ports, creating vulnerabilities at the country’s critical choke points. 

  • Labour issues can also come into play. In 2024, a four-day Grain Workers Union strike cost the sector an estimated $35 million per day in stalled export shipments.7 These vulnerabilities lead to lower profits for farmers and more hesitation from international buyers.  

  • If a significant disruption shuts down either Canadian National Railway Company (CN) or Canadian Pacific Kansas City (CPKC) railways for a single week, the estimated economic damage to the grain industry from lost sales, contract penalties and other costs could reach $250 million8.

  • The federal-government owned Trans Mountain Expansion Pipeline shows how new infrastructure investments in one sector can relieve pressure for another. When the oil pipeline capacity grew to 890,000 barrels per day, Canadian crude-by-rail dropped to the lowest levels since 2012,9 freeing up capacity for Western grains, pulses, and oilseeds, and other commodities. 

  • Investments like DP’s World’s Port Authority Rail Yard project ⁠at the Fraser Surrey Terminal in Surrey, British Columbia, aim to improve handling capacity and efficiency for agricultural exports. The newly announced Canada-British Columbia Cooperative Prosperity Agreement includes $10 billion in federal funding to upgrade the Roberts Bank Terminal 2 in Delta, B.C., along with other potential investments at the Prince Rupert port, further north of the province. (For more on this topic, listen to the Disruptors podcast discussing the Roberts Bank Terminal 2 expansion). 

  • Other efficiency enhancements underway at the Port of Vancouver include the port’s new Active Vessel Traffic Management Program (AVTM) and a centralized scheduling system, which coordinate bridge lifts and vessel movements with train scheduling and reduce delays10. Improving methods for loading grain in the rain, which can halt loading between 30-60 days a year, can also increase port turnaround times. 

Recent years have shown where Canada’s transport system is fragile. The rail and port infrastructure decisions made over the next few years will influence how gains in productivity translate into stronger export growth, and whether the country’s supply chains stay anchored in Canada. Addressing these acute risks should be core to Canada’s nation-building conversation, and large capital investments are needed alongside supply chain efficiency improvements. Farmers have done their part to boost production—the systems moving the output need to keep up. 

WP Menu

wp-menu

As debate continues over the costs of building Alberta’s proposed West Coast Oil Pipeline (WCOP), there is a question of how Canadian heavy crude can compete with the Persian Gulf and ever-rising Venezuelan grades that already serve the Asian market. There are several key elements that need to hold for the economics of the proposed pipeline to work—and none are guaranteed.

A Canadian barrel costs roughly twice what a Gulf barrel costs to land at the same refinery—the arithmetic of being 1,200 kilometres from tidewater. On delivered cost alone, any case for the pipeline must explain what offsets a gap that wide.

A Competitive Oil Market

Heavy sour crude delivered to Northeast Asia (C$/per barrel)

WCSArab HeavyMerey
Delivered costs (C$/b)(CA)(Gulf)(VZ)
Field to tidewater$9-$11$2-$3$4-$6
Freight to NE Asia$4-$6$3-$4$4-$5
Delivered, all-in cost$13-$17$5-$7$8-$11

Notes: Persian Gulf and Venezuelan field-to-tidewater costs are RBC Thought Leadership estimates. Western Canadian Select (WCS) costs are modelled off Trans Mountain’s shipping costs to China from its Westridge Marine Terminal.  Freight rates are mid-cycle estimates.

The new pipeline does not need to follow the same path that unfolded for the Trans Mountain Expansion Project (TMX), i.e., cost overruns that were part passed onto shippers.

Pipeline Economics

West Coast Oil Pipeline (WCOP) vs. Trans Mountain (TMX) financial metrics

WCOPWCOPTMX
Pipeline Metrics (C$)LowHighActual
Capacity, 000 bpd1,0001,000890
Capital cost, $ billion$35.2$43.7$35.3
Capital cost, $ per bpd$35,200$43,700$59,831
Pipeline toll, $/bTBDTBD$9-$11
Freight to Asia, $/b$2-$3$2-$3$4-$6

Notes: The TMX toll reflects the revised rates as disclosed in the July 7 submission to the Canada Energy Regulator ($9.20-$11.05 per barrel). The TMX capital cost per barrel is calculated based on expansion volumes only (590,000 bpd). Freight rates are mid-cycle (normalized). All dollar figures are quoted in Canadian dollars.

The West Coast Oil Pipeline’s transportation costs should hopefully be less expensive than TMX, given the use of a larger line along a ‘de-risked’ corridor, and loading supertankers (Very Large Crude Carriers) directly rather than the mid-sized Aframaxes. The challenge would be to keep the project on budget. The $35-$44 billion estimated price tag for the project excludes escalation and financing—key concerns from a competitiveness standpoint.

Western Canadian Select (WCS) trades well under global benchmarks, much of it due to captivity (as it’s one and only market is the U.S.) rather than quality. While a cheaper price improves competitiveness (buyers get a similar barrel for less cost), it is less than ideal for producers and getting oil to tidewater lets the barrel escape this structural disadvantage. The Alberta government estimates WCOP could narrow the price gap between WCS and the U.S. benchmark West Texas Intermediate by up to US$3 per barrel. For reference, WCS has historically traded at a US$10-15 discount to WTI, but has at times gone in excess of US$20 per barrel.

Buyers are hoping Canadian crude is more reliable. Cheap Persian Gulf barrels carry a Strait of Hormuz risk, while Venezuelan barrels are dependent upon an extended economic reconstruction. Canada’s oil carries neither risk, with Asian buyers willing to pay for that security.

Producer commitments are less a question of Asian demand—TMX’s fill rate suggests the demand is clearly there, but cost overrun concerns need to be alleviated to ensure the West Coast project’s competitiveness.

The trade case rests on several conditions: the project is built on time and on budget, with a discount that is more structural in nature rather than subject to periodic events, and a reliability premium outlast recent disruptions. If these conditions hold, the prize is significant: roughly $20 billion in incremental annual exports (based on 1 million barrels per day at 90% utilization, and a WCS price of $60 per barrel), along with a potential US$3-per-barrel tightening in a spread across future bitumen production of between 4.5 and 5 million barrels per day by 2035, worth about $5 billion annually. Whether Canada should make this bet with public money is a fiscal judgment, particularly given the country’s recent history with pipeline development, but one that seems increasingly likely with each passing day.

–By Shaz Merwat, Energy Policy Lead

RBC brought together more than 500 business, government and policy leaders last month for the U.S.-Canada Summit, in partnership with the Eurasia Group. Ministers, governors, ambassadors, economists, investors—and an astronaut—gathered in one room to talk about the future of the world’s most prosperous relationship.

Donald Trump threatens to cut off trade to Spain

  • The U.S. President issued the threat over the European country’s refusal to increase defence spending to 5% of GDP by 2035. The U.S. administration is now preparing a list of Spanish goods to potentially embargo.

Canada tells the UAE it’s not ready for an inflow of cash

  • The federal government’s Major Projects Office told an official UAE delegation that it was too soon to inject billions of dollars into Canada, as projects are still in early stages. Prime Minister Mark Carney landed a $70 billion investment commitment from the UAE last year, but that capital has yet to be deployed.

Brussels launches probe into imports of Chinese duck

  • The European Commission has launched an anti-dumping investigation targeting Chinese Pekin duck, the breed used to make the iconic Peking duck dish. The latest dispute highlights growing trade tensions between the EU and China.

Global trade and economic groups warn of uncertainty

  • The heads of major global organizations—the International Energy Agency (IEA), International Monetary Fund (IMF), World Bank Group (WBG) and World Trade Organization (WTO)—met to discuss the impact of the war in the Middle East. While they noted that the global economy has been “broadly resilient,” they warned that uncertainty remains high and that the impacts of the war may linger.

U.S. trade deficit widens, as does Canada’s surplus

  • The U.S. trade deficit increased sharply in May, ballooning to a 14-month high despite tariffs on imports. Canada, meanwhile, saw its trade surplus widen to a four-year high in May, with exports of metals and energy increasing during the war in the Middle East.

WP Menu

wp-menu

➔ The big fight over methane

➔ Canada is going global with its nuclear ambitions

➔ Why a Canadian municipality paused a data centre project

Corporates are returning to the fore: Corporate sustainability appears to be turning a corner, with companies demonstrating renewed commitment propelled by the tailwinds described above, says Brian Hong, RBC Director, Environmental Markets Solutions Group, who attended London Climate Week. The breadth of representation across the events—spanning large corporates, financial institutions, investors, government representatives, and NGOs—was another positive indicator. Read his full impressions of #LCAW2026 here.

Canada is an Energy Transition Index laggard. The country, ranked 32nd, dropped one spot in the World Economic Forum’s 120-country index and trails most of its advanced peers (the U.S. is ranked 19th and Australia 26th).Canada’s step down was part of a more sweeping decline in advanced economies on rising energy prices and weaker climate policies.

El Niño is fuelling a cooling crisis. Space cooling is already the fastest-growing energy demand in buildings globally (4% annually), straining power grids. As temperatures remain oppressive, expect AC adoption—and demand for power—to ramp up: only 52% of Canadian renters have AC access, while only 15% of the 3.5 billion people in hot climates worldwide own air conditioners.

By Vivan Sorab, Clean Tech Lead

Canada’s electricity strategy is at a critical juncture with policymakers and industry grappling with the push and pull of managing growth and keeping it—mostly—clean.

At the electricity strategy summit in Ottawa, hosted by Natural Resources Canada and Smart Grid Innovation Network, I came away with the following insights:

The action is at the distribution end: New housing is driving a wave of transformer and metering demand, while rooftop solar, EVs, and other inverter-based resources are climbing sharply. Data centres, squeezed by caps such as Alberta’s 1.2-gigawatt limit and global chip shortages, are increasingly seeking to connect at the distribution level.

Affordability is a binding constraint: A hyper-focus on lowest cost is choking the investment the electricity system needs to grow. Yet affordability is also the single greatest threat to political continuity, and with it the durability of any national strategy.

Planning needs to extend beyond the kilowatt-hour. Integrated resource planning optimizes for capacity and energy, but distributed energy resources and demand-side management deliver more than power, boosting local economic development, customer comfort, and household savings. Today, those benefits are not priced properly, some say, and so the distributed solutions that could ease the system are systematically undervalued.

Workforce and supply chains limit what can be deployed and how fast. Deployment forecasts, such as for heat pumps, assume trajectories that available labour and supply chains cannot deliver. The achievable pace will be more modest than headline targets imply. The skills gap compounds this: every retirement removes 30–40 years of expertise, with no systematic upskilling regime to replace it.

Interties and an East-West grid are back on the table. Shifting geopolitics has revived interest in regional integration, but Canada’s grid remains dominantly north-south. Cross-time-zone interties could materially raise the value of renewables by offsetting peaks across the country, though deeper modelling and feasibility work are necessary.

The biggest export opportunity may not be physical. The export conversation fixates on hardware such as small modular reactors and large nuclear components. But Canada has an underused advantage in electrification expertise and grid software.

By Shaz Merwat, Energy Policy Lead

The U.S. and Qatar are at odds with the EU over methane import rules. Brussels is holding the line—while quietly suspending enforcement. The framing is now familiar: energy security versus climate ambition.

That could prove to be an advantage for Canada, given its high methane compliance standards. Most major global sources of gas supply anxiety right now have a Canadian answer, says Shaz Merwat, our energy policy lead.

Years of work on methane are yielding results. The Montney is among the lowest methane-intensity gas plays in the world. Enhanced federal regulations finalized in December target 72% below 2012 levels by 2030. The compliance burden the U.S. and Qatar are lobbying against is already baked into Canadian operations.

Chokepoints? Kitimat ships west. No concerns around the current conflict in the Strait of Hormuz, blocked traffic in the Suez Canal, the Panama Canal is running dry, or the future of the Taiwan Strait.

For Canadian operators, methane performance is turning out to be a quieter, cheaper way, with a growing list of buyers who are starting to make it a condition rather than a preference.

By Vivan Sorab, Clean Tech Lead

Canada’s new Nuclear Energy Strategy leverages its civil nuclear energy legacy for energy security, industrial policy, and exports.

Here are six insights into the scope and depth of Canada’s new nuclear ambitions:

  • New reactors: The strategy targets up to 10 new large reactors (two under construction by 2035, five more planned by 2040), at least one deployment outside Ontario (Canada’s current nuclear stronghold), by 2035, a modernized CANDU design by 2030, and a doubling of the nuclear workforce.

  • A fleet approach: The strategy concentrates regulatory, supply-chain, and construction effort behind specific reactor designs for every use case, helping to standardize deployments, drive down costs, and build a construction track record.

  • It’s about Team Canada: The strategy emphasizes nuclear exports and envisions a unified “Team Canada” export posture with several goals: securing CANDU in at least four new markets by 2040, engaging six to 10 new-entrant countries, and capturing supply-chain share in at least five non-CANDU projects globally. A dedicated Export Financing and Commercial Framework is meant to let Canada compete on sovereign financing, a key driver of nuclear technology exports.

  • Leveraging uranium: Canada is the world’s second-largest uranium producer, and CANDU reactors run on natural uranium, insulating it from the enrichment supply chains that are dominated by Russia. The strategy aims to double uranium exports by 2035. While Canada’s current reactors do not require enriched uranium to operate, Canada’s SMR fleet will require enriched fuel, which the strategy says remains under consideration but will be secured for reactors that require it.

  • Leading with innovation: Nuclear fusion, a defence-led advanced microreactor, and a medical isotope push are also key components of the strategy.

  • The next steps: Execution hinges on financing, supply chain, and jurisdiction. Federal financing policy that defines terms isn’t due until April 2027, and the plan aims to attract private and pension capital that has been hard to mobilize for Western nuclear projects. On the supply-chain side, heavy-water production capacity closed in the 1990s and would have to be rebuilt, alongside heavy forgings and nuclear-grade materials. And provinces, not Ottawa, choose the technology and manage downstream effects, with the federal role being one of signalling and supporting de-risking.

➔ Can Canada build more homes and build more defence infrastructure in a climate-smart way? RBC’s John Stackhouse offers some thoughts on the triple play that’s about to be tested as Canada embarks on a new housing expansion.

➔ When municipalities fight back.In a sign of municipal backlash against data centres, Hamilton, Ont., councillors unanimously paused a data centre project on the grounds that it could impact the environment, water use, and affordability. Councillor Nrindr Nann, who led the initiative, said 21 other municipal councils have requested her motion letter.

➔ It’s 25% by 2035. That’s the new proposed climate target for energy consumption intensity in the building sector under the COP31 Presidency of Türkiye. It could strike a chord—and build momentum as rising power bills has emerged as a critical challenge for businesses and consumers.

Curated by Yadullah Hussain, Managing Editor, RBC Climate Action Institute.

Climate Crunch would not be possible without John Stackhouse, Jordan Brennan, John Intini, Farhad PanahovLisa AshtonShaz MerwatVivan SorabCaprice Biasoni, Lavanya Kaleeswaran and Joelle Schonberg .

Have a comment, commendation, or umm, criticism? Write to me here (yadullahhussain@rbc.com)

Climate Crunch Newsletter

WP Menu

wp-menu

➔ The beautiful game’s rising carbon footprint

➔ How to acknowledge, encourage and scale conservation

➔ Notes from the U.S.-Canada Summit: Canada must play its critical minerals, and nuclear cards strategically

  • The Canadian Deep Geothermal Coalition will develop the country’s first national geothermal energy roadmap. Ottawa tasked the group— comprising industry and Indigenous leaders, researchers, policymakers—to tap a nascent clean industry that has caught the eye of 50 jurisdictions globally.

  • Quebec rolled back its target of 100% zero-emissions sales by 2035. It’s now 80%, a “balanced approach,” the government said, that accounts for supply chain challenges facing the global auto industry. In March, Ontario Premier Doug Ford urged Quebec and British Columbia to drop their EV sales targets to boost the country’s competitiveness.

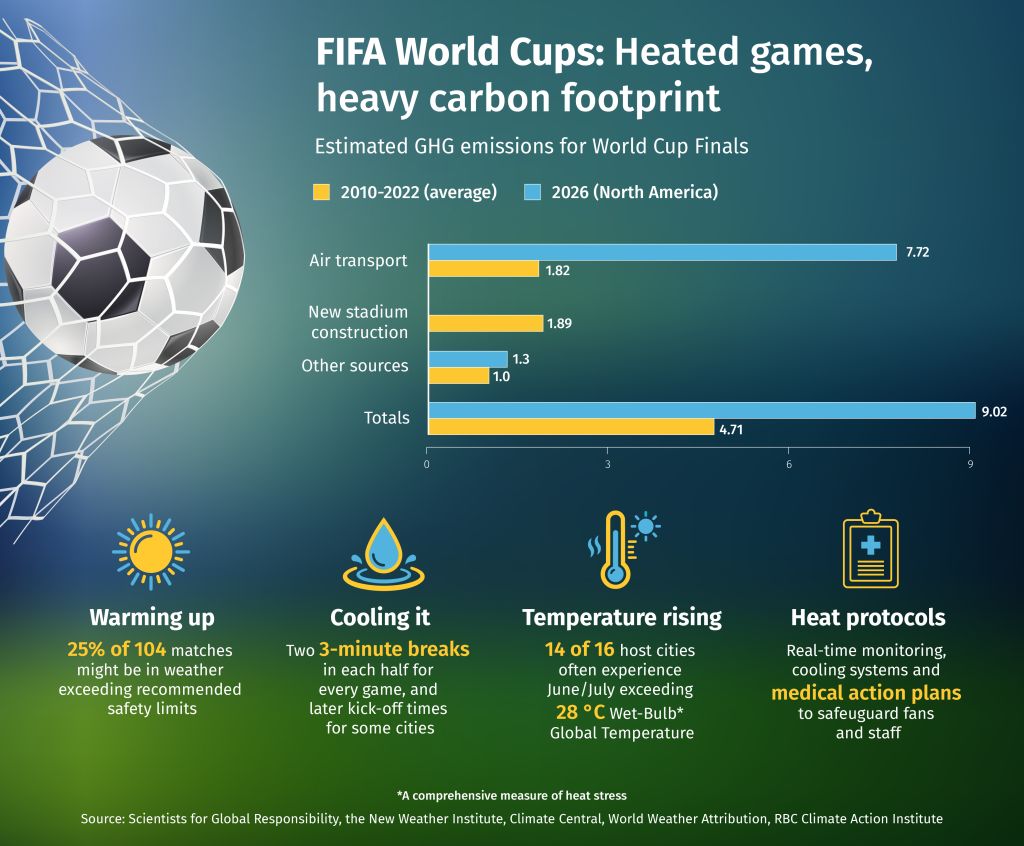
  • It will be a sizzling summer of soccer. As 48 teams clash in the FIFA World Cup, they are also facing another formidable opponent: unusually hot weather, and El Nino, a natural warming cycle, that will “pour fuel on the fire of a warming world,” according to UN Secretary General António Guterres. The event, hosted by Canada, the U.S. and Mexico, also has a heavy carbon footprint.

    FIFA World Cups: Heated games, heavy carbon footprint

In a guest commentary, Catherine Grenier, President & CEO, Nature Conservancy of Canada, writes about assigning value to nature.

From agriculture and forestry to municipalities and mining, many sectors are actively managing their lands in ways that deliver real, measurable conservation outcomes. But these outcomes are not properly acknowledged or reflected on balance sheets. These outcomes do not formally advance conservation targets or inform conservation decision-making, and are not included in the frameworks that assign value to nature. 

It is time to acknowledge these sectors more intentionally as contributors to the conservation community and conversation. Together, we can identify and advance practical approaches to using our lands that continue to support biodiversity outcomes.

OECMs: Acknowledge, encourage, scale

The first step in deepening this collaboration is formally acknowledging the work that is already being done. One approach is through Other Effective Area-Based Conservation Measures (OECM) recognition.

OECMs are sites, other than Protected Areas, that achieve effective, long-term conservation–even though they are managed primarily for other reasons. They offer a way to value and sustain strong land management practices, which allows biodiversity to persist over the long term.

Consider, for example, the choices cities make to protect drinking water through land-use restrictions and watershed management. Or how landowners and corporations exempt portions of forestland from active logging and industrial extractive use. Ranchers support conservation-compatible activities like grazing native grasslands. Green infrastructure sustains wildlife connectivity by limiting the land fragmentation caused by human development.

OECM recognition is one way to make these long-term commitments visible and credible, offering something real to show in markets that are increasingly asking about environmental contributions. 

OECMs in action

Earlier this year, the city of Saint John, New Brunswick, formally recognized 4,800 hectares of city-owned land as having special conservation status. The land includes mature, intact forests, lake shorelines, and rich wetlands that are used to enhance and safeguard the city’s drinking water supply, with its benefits extending beyond the health and well-being of its citizens.

In 2022, J.D. Irving, Limited, became the first forestry company in Canada to have some of its land recognized as an OECM: nearly 10,000 hectares of Acadian forest and coastline. This land supports public commitments and recreational use, while also conserving some of the province’s most unique and species-rich areas.

The path forward

OECMs are not new, but the federal government’s recently released Strategy to Protect Nature has reinvigorated a policy environment that can accelerate their use. Collectively, we have an opportunity to define the path forward, embrace innovation, collaborate on new ways to engineer solutions for, and with, partners whose efforts are not currently being accounted for.

For conservation leaders, this means exploring ideas like: How and where are industry-led management decisions leading to durable conservation outcomes? How can these management practices be strengthened and supported for the long term? And where is there opportunity to develop tools that can respond to both industry and biodiversity needs?

OECM recognition has gained momentum on working ranches, within sustainably managed forests, in municipalities, and within research and recreation landscapes. The opportunity ahead lies in working alongside industry to dig deeper, get creative, and determine where else they might apply.

This approach also opens the door to greater recognition, more meaningful support, and stronger community engagement. It makes clear that when considered together, nature and economics can work harmoniously.

  • In the new world order, Canada will need to play its many cards more assertively: low-carbon natural gas, critical minerals, food and fertilizer, nuclear fuel, and a stable rule-of-law environment that capital increasingly prizes, notes John Stackhouse, Senior Vice-President, Office of the CEO, RBC, in his analysis of the recently-concluded U.S.-Canada Summit hosted by RBC and the Eurasia Group.
  • At the Climate Smart Buildings Alliance 2026 Leadership Summit industry leaders explored ways building and construction sectors can drive Canada’s economic growth while meeting our climate commitments. Stephanie Shewchuk from RBC Thought Leadership engaged with the ideas and innovators driving this conversation forward. Read some of the highlights from the event here.

  • At London Climate Action Week next week, more than 75,000 attendees will discuss the state of energy transition, supply chains, energy security, sustainable cities, and carbon removal, among others. Are you attending? Send us your thoughts. #LCAW2026

  • The rise of batteries shoots down the argument that “the wind doesn’t always blow, and the sun doesn’t always shine,” notes Alison Reeves, program director at Grattan Institute. “Who cares any more if we can store electricity at scale?”

Curated by Yadullah Hussain, Managing Editor, RBC Climate Action Institute.

Climate Crunch would not be possible without John Stackhouse, Jordan Brennan, John Intini, Farhad PanahovLisa AshtonShaz MerwatVivan SorabCaprice Biasoni, Lavanya Kaleeswaran and Joelle Schonberg .

Have a comment, commendation, or umm, criticism? Write to me here (yadullahhussain@rbc.com)

Climate Crunch Newsletter

WP Menu

wp-menu

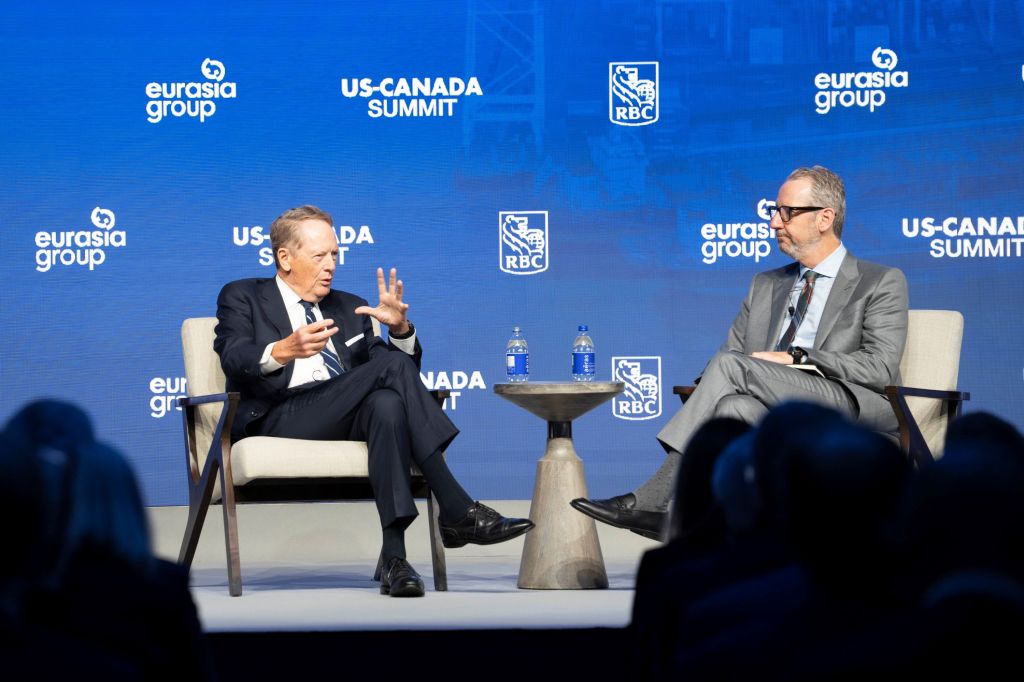
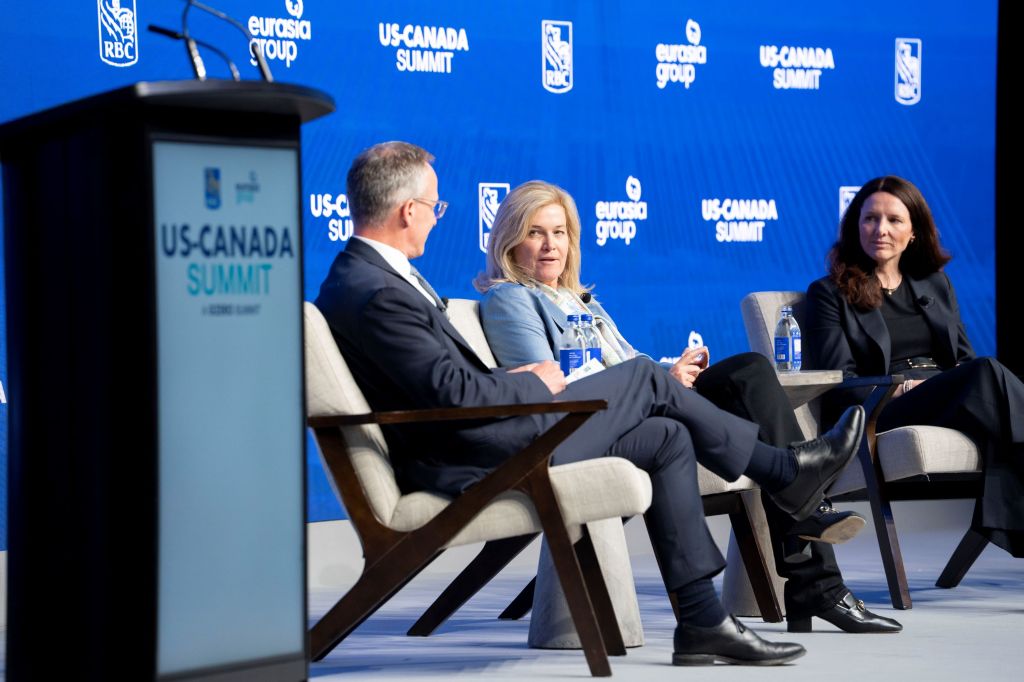
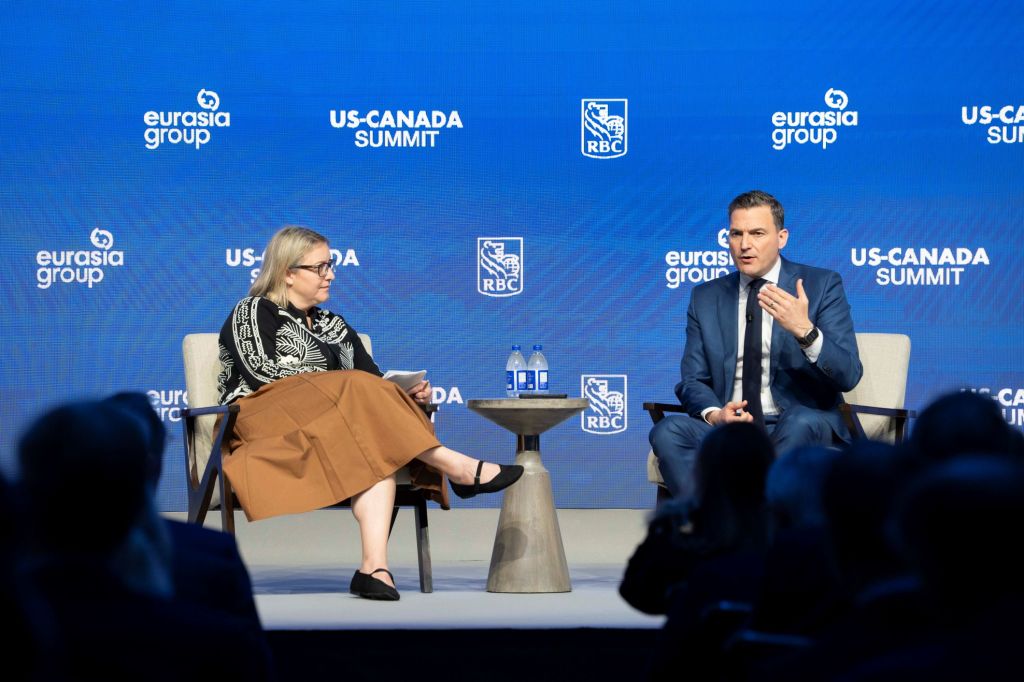
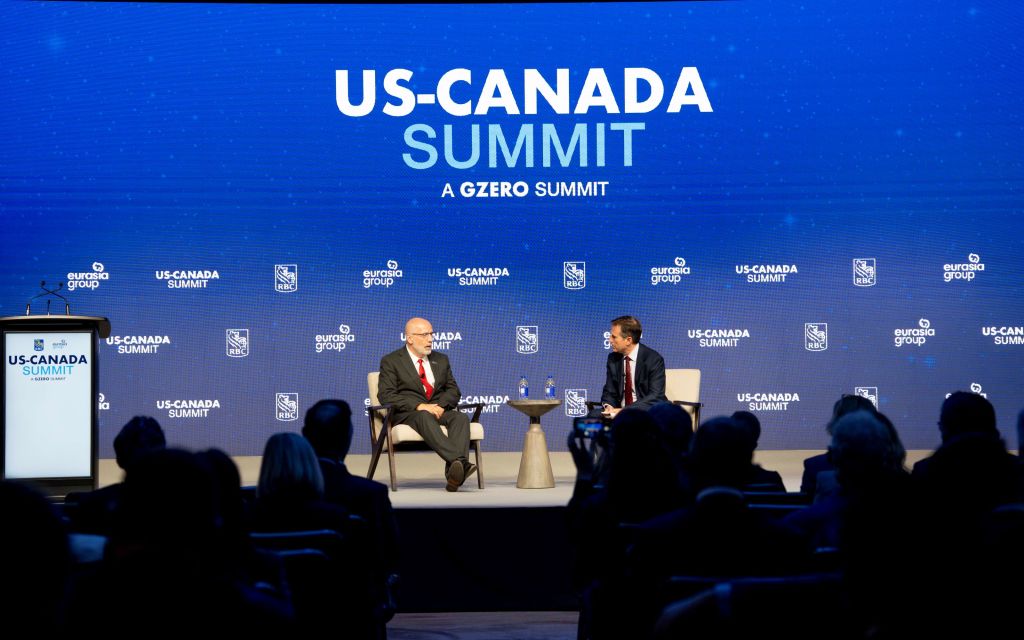
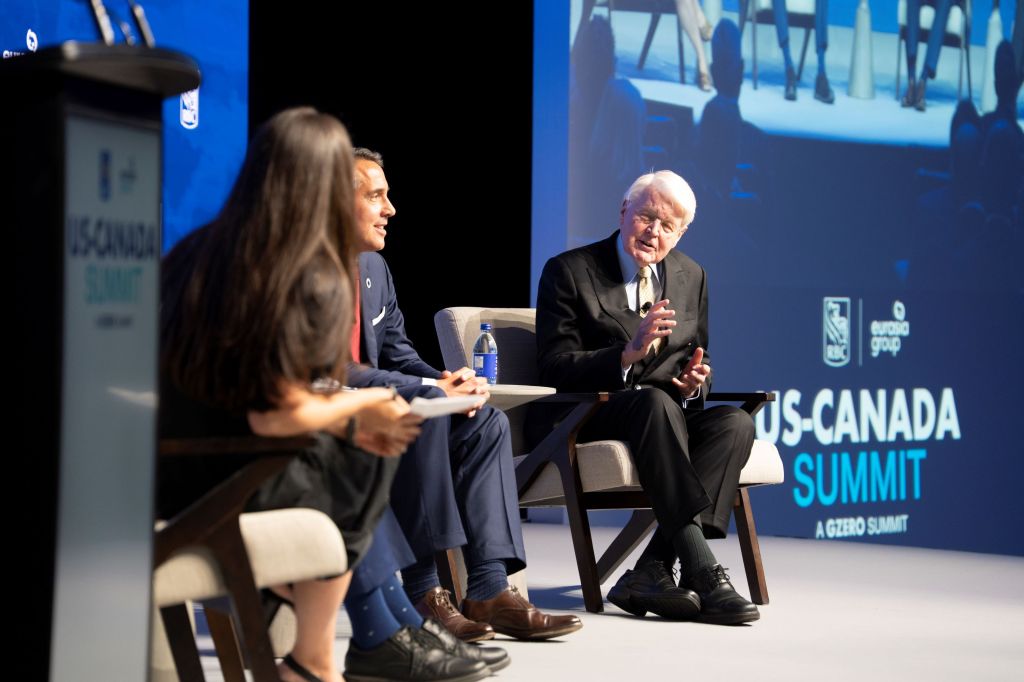
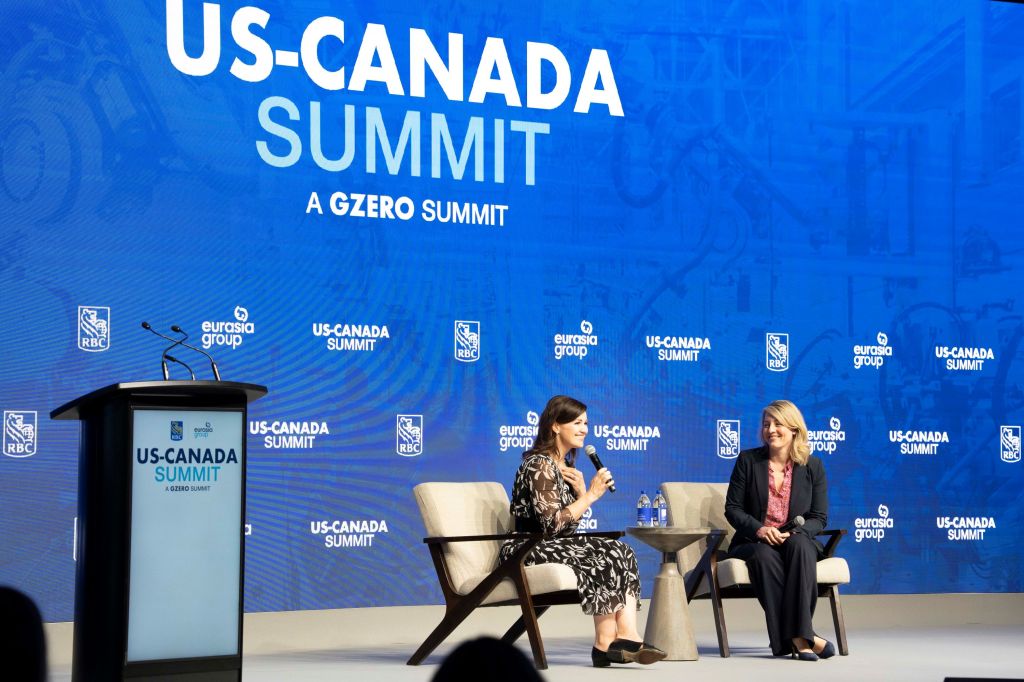
More than 500 business, government, policy, and community leaders, along with policy thinkers and academics, came together for the annual U.S.-Canada Summit, hosted by RBC and the Eurasia Group in Toronto on June 11, to discuss where the world’s most prosperous relationship is at—and where it might go.


Here’s some of what emerged:

Tone matters—and this year’s summit carried none of last year’s hostility. Both countries’ ambassadors spoke of hope, although with different expectations, and both sides spoke of tariffs as a new normal, again with different expectations. The fundamentals are too large to ignore: $1.3 trillion in annual two-way trade, 120-million border crossings per year, and a relationship woven through shared IP, talent, capital, and innovation. Trump’s former trade czar Robert Lighthizer acknowledged Canada is not the main problem—America’s real frustration is with China, Germany, and Japan. But Canada isn’t exempt, and he was blunt: tariffs aren’t going anywhere for a generation.

That’s not to suggest there’s rapprochement. Business leaders agreed the damage to Canada-U.S. relations is not irreparable—but there is damage, and it will take time to heal. Trust comes back slowly. Uncertainty recedes slowly, too. But the economic logic of closer Canada-U.S. ties remains strong. One Canadian portfolio manager said that no matter how they run their risk models, they end up with a 50-60% allocation to the U.S. The two governments now have the summer, and likely part of the fall, to find a way forward on trade. They’ll also have to recognize how much their economies are changing at the same time. This isn’t your parents’ trade zone anymore.

As hopes for free trade fade, a new age of state capital is evolving. Both Washington and Ottawa are now explicitly using government spending, tariffs, procurement, and regulation as tools of economic strategy—and the era of assuming that politics would leave globalization alone is over. Daleep Singh of asset manager PGIM put it plainly: we are in a world of fiscal dominance, with industrial policy in the midst of renaissance. Every cross-border linkage—trade, capital, energy, technology—is now at risk of being weaponized for geopolitical leverage. The result is more government debt, higher trend inflation, more political risk and a stronger case for physical assets connected to economic security.

Will this also mean a return to mercantilism? If governments try to gain economic favour by diminishing and constraining others—competitive strength over comparative advantage—Canada will need to play its many cards more assertively: low-carbon natural gas, critical minerals, food and fertilizer, nuclear fuel, and a stable rule-of-law environment that capital increasingly prizes. It presents material opportunities for business, too, as governments create incentives to reshore economic sectors and underwrite the scaling of companies, from AI to life sciences. Annesley Wallace of pension manager HOOPP captured the investor mood: Canada now has the attention of global investors in a way it didn’t a few years ago. But capital wants to see execution and policy certainty, not just ambition.

Data centres are the new factories—the physical infrastructure of the AI economy. And Canada is largely absent from the map. Hamid Moghadam of Prologis, one of the world’s leading logistics companies with $5 billion invested in Canada, was direct: companies building data centres go where it is easiest. Canada is not on that list. Prologis currently has no AI data centre capacity in Canada, with the Netherlands and the United States dominating. The culprit is a “quirky provision” in Canadian tax law that imposes a 15% burden on U.S. tax-exempt capital invested in Canadian properties—a friction that doesn’t apply in reverse. That could be the greatest cross-border risk as enterprise users (unlike the hyperscalers) turn more to inference models that can use low-latency infrastructure. Bell Canada is seizing on that with a new data centre in Regina that is, initially at least, expected to rely on U.S. users.

The slower pace of AI adoption in Canada—fewer than one in five companies, and fewer public sector users have deployed the technology—is starting to show up in economic and business performance. Canada is trying to catch up with a new national AI strategy that aims to invest in AI awareness and skills, as well as business adoption. Jenny Johnson of investment management firm Franklin Templeton put it starkly: the pace of AI is moving so quickly that companies that get it right will leave others in their sector behind permanently. She told her own executives: if you aren’t building agents yourself, you’re already behind. Trouble is, citizens in both countries are increasingly anxious and skeptical about AI. That’s leading to more grassroots pressure, including in this year’s mid-term election campaigns in the U.S., to regulate AI. 

Both Canada and the United States are navigating a crisis of public trust in technology—but they are responding in ways that could put them on a collision course over regulation, data, and digital trade. In the U.S., the AI boom is turbocharged by private capital, hyper-scalers, and a permissive regulatory culture. The concern is less about governance and more about falling behind China in the AI arms race, although local resistance to data centres, especially over their use of electricity and water, could change the conversation. Canada, by contrast, is pursuing a more rights-based, sovereignty-first approach. 

In both countries, and across their borders, the AI revolution is moving so quickly that governments seem destined to react. Ian Bremmer, Eurasia Group’s founder and president, warned of a deepening crisis in which no political leader could overcome a structural gap between technological transformation and outdated governance systems. Technology companies, he said, increasingly act as functional sovereigns in their own domains—and the absence of governance around AI is one of the most urgent risks on the horizon. Canada’s AI Minister Evan Solomon acknowledged the paradox: Canada’s best and biggest AI partner remains the United States, and access to frontier models, compute, and capital still flows primarily north-south. But as Canada builds its own AI sovereignty framework—and as the Safe Social Media Act, new privacy rules, and the AI for All strategy take shape—conflicts over data flows, platform regulation, and digital trade are increasingly likely. 

Defence is again central to the relationship, and central to emerging divisions. One big one: what technologies will dominate the battlefields and defensive lines of tomorrow? Case in point: Three days before the summit, an Iranian drone shot down a U.S. Apache helicopter, and then an American sea drone rescued the two downed airmen. The U.S. is investing heavily in AI systems, robotics and autonomous war machines, as well as bio- and cyber-weaponry. Canada is trying to catch up on advanced military technology, and at the same time restore and restock bigger hardware like fighter jets and submarines. The Canadian strategy is driven by economic policy as much as defence strategy, to build trade ties with European and Asian allies.

The wars in Ukraine and the Middle East have rewritten defence doctrine. Scalable production and resilient supply chains have proven as decisive as firepower. MDA Space CEO Mike Greenley put it this way: defence and space remain areas of full collaboration and full integration, even amid trade tensions. “The stronger we are, the better partner we are.”

That may require an intricate matrix of supply chains and partnerships in which Canada could continue to play a role in the F-35 fighter jet program while also building the GlobalEye partnership between Sweden’s Saab with Bombardier to make surveillance aircraft for Arctic defence. Energy and critical minerals will be a critical component of this new chapter. Vivek Lall of defence firm General Atomics identified a technology triad linking AI, nuclear energy, and autonomy as the defining framework for the next generation of defence capability—and argued Canada-U.S. collaboration has significant potential across all three.

The Arctic is no longer a remote policy afterthought. It has become a global economic, geopolitical, and strategic battleground—and one where Canada and the United States have no choice but to work together, and quickly. Olafur Grimsson, former President of Iceland, framed the challenge: the past decade has seen a flood of new arrivals into the Arctic, as China, Russia, and a constellation of Asian economies sought access. The old notion of sovereignty, where lines on a map settled the question, no longer applies in an environment that is rapidly becoming both economically accessible and strategically contested.

Thomas Dans, Chairman of the U.S. Arctic Research Commission, was direct about Washington’s view: both countries have “a lot of room both to catch up, but also to surpass and to really lead.”

He said North America needs to look over the North Pole and also toward the North Star. First challenge is Russia. Even though there may be room for cooperation over fisheries and shared resources with the Kremlin, Grimsson warned the West risks losing sight of what Moscow is doing in its own Arctic, particularly as Russia deepens energy, pipeline, and mining links with China, India, and other Asian powers. The same sort of resource development is possible on the North American side. Then there’s the skyward trajectory. Continental defence may rest in the ionosphere, but it doesn’t stay up there. The two countries need to develop land and sea-based systems in the Arctic to connect with their growing space-based defence operations.

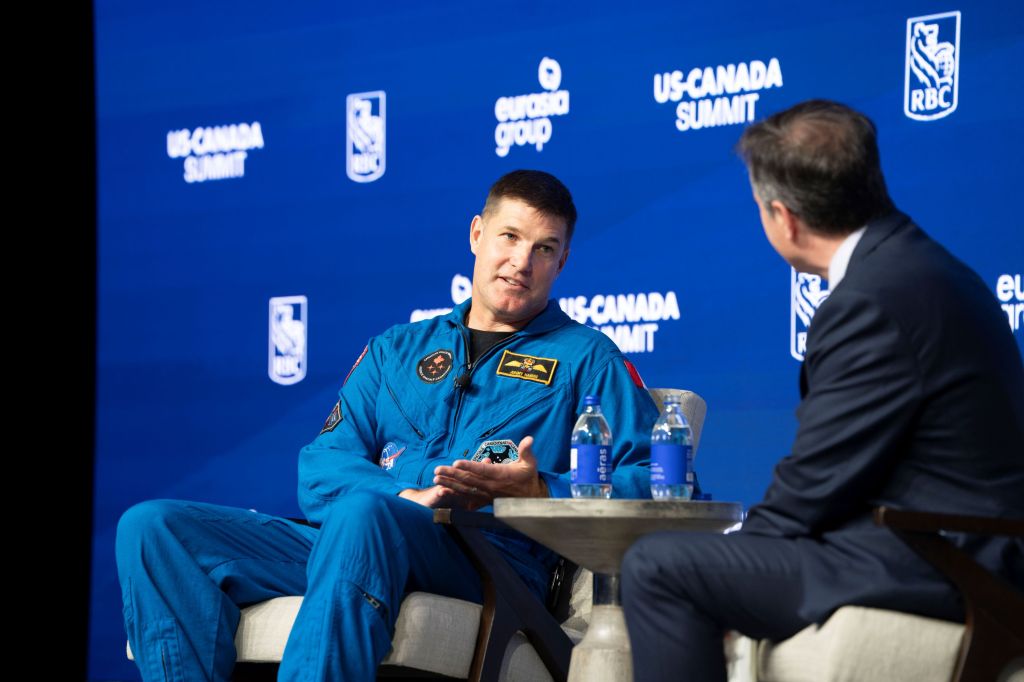
Canada has always punched above its weight in space—but largely as a junior partner to NASA. That posture is shifting. Canada is now trying to carve out a distinct space identity, rooted in its own strengths and connected to a broader set of international partners, while remaining deeply integrated with the U.S. It may pose the greatest challenge to continental cooperation. Canadian astronaut Jeremy Hansen said the two countries will find the most opportunity by playing to their strengths, rather than for diplomatic reasons. For Canada, those strengths include Earth observation, space-based communications, and robotics, as well as onboard computing.

Countries are increasing spending rapidly, creating a 2.5x economic multiplier for space manufacturing and technology. But leaving the so-called final frontier to commercial firms may underestimate the geopolitical tensions up there. In the race to return to the moon, China is partnering with 11 nations, the U.S. with 60. Canada is in the latter coalition and contributing meaningfully. Hansen compared the challenge to the ethos of a space crew: “People who can point out what’s broken and stop there is not acceptable in our space culture.” Canada’s space ambition requires the same discipline—specific proposals, not just aspirations.

Canada is seeking to diversify its economic and security relationships, without undermining its integral relationship with the U.S. Industry Minister Mélanie Joly said Canada has trade agreements with 52 countries. Discussions with the EU are deepening—not just as a response to tariffs, but to create genuinely integrated Canadian-European companies, and align industrial policies. Michael Sabia, Clerk of the Privy Council, was equally clear: Canada’s U.S. strategy and its broader global strategy are mutually reinforcing. “We are not decoupling. We are diversifying.” On China, his framing echoed U.S. language precisely—de-risking, not decoupling—with clear guardrails defining where Canada can and cannot engage.

But diversification is not free, and the infrastructure required to redirect Canadian trade is largely not built yet. West Coast pipeline capacity remains critically constrained, limiting Canada’s ability to sell oil and gas at premium prices in Asian markets. Port infrastructure in Vancouver and other Pacific gateways—rail connections, bridge capacity, terminal throughput—lags badly behind the ambition of a serious Pacific trade strategy. And permitting timelines for new infrastructure projects remain a systemic bottleneck. Those are solvable problems. Sabia’s closing argument was that Canada holds a genuinely strong hand—low-carbon gas, food, fertilizer, critical minerals, AI capabilities, and a trust premium that flows from values and history. “This is not a time for national anxiety. This is a time for confidence.” 

Download the Report

WP Menu

wp-menu

It’s more than a year into the historic U.S.-Canada trade shock, and the two economies suddenly find themselves at another nexus—the future of CUSMA, and a next chapter where precedents don’t necessarily hold. 

In some ways, it’s a moment of relief. What initially seemed like a monumental disruptive trade shock became a watered-down version of threats, and a growing list of exemptions for traded goods for many trading partners. Canada’s list has been the largest, thanks mostly to CUSMA, which makes about 90% of exports to the U.S. tariff-free. As a result, the trade schism between the two countries has been quite narrow, albeit deep.  

But there’s also hesitation. The U.S.-Canada ties seem to be bruised, not broken, but the outcome of the trade negotiations remains far from certain, and adjustments to this new relationship are still in play. Trade-related jobs have still bled on both sides of the border, and Americans are beginning to see the rise in tariff-related inflation. 

The trade war has turned out to be a slow leak—a disruption and transformation in slow motion. Slow leaks buy time to maneuver, but they can also produce some complacency. And they have a way of revealing cracks in the foundation that had been papered over before. This trade shock has uncovered under-the-radar stories about global trade, and the U.S.-Canada trade relationship. Here are six worth highlighting:  

  1. Global trade growth doubled without the U.S. 

    A big Liberation Day concern was that mass tariffs would spark a global recession, given the U.S.’s importance in the world economy. Instead, global trade, excluding the U.S., doubled, growing 4.4% year-over-year.

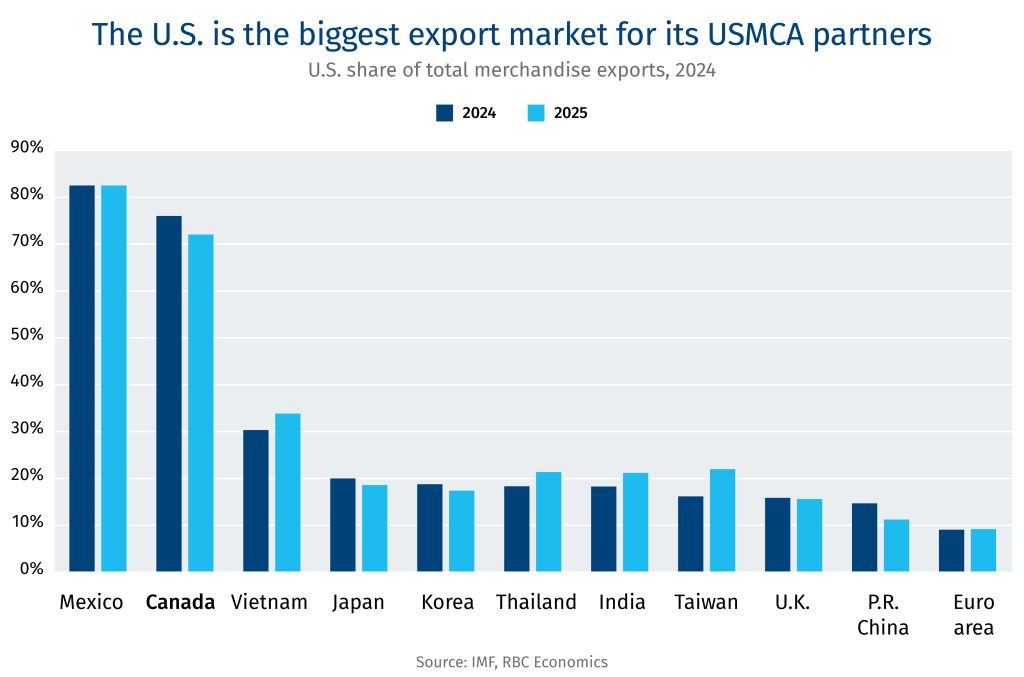
    A North American centric view of the world would, perhaps, have missed that outside of Mexico and Canada, American trade partners are far less exposed to the U.S. consumer market. Prior to 2025 tariffs, exports to the U.S. ranged from 30% in Vietnam to 15% in China, and 9% for the Euro area.

    Indeed, rather than break the global economy, the rest of the world is adapting to re-orient around the U.S. market. In a world focused on trade leverage, the jump in trade amongst global partners would suggest the U.S., perhaps, has less than initially appears. 

  2. The year of Canada’s trade divergence 

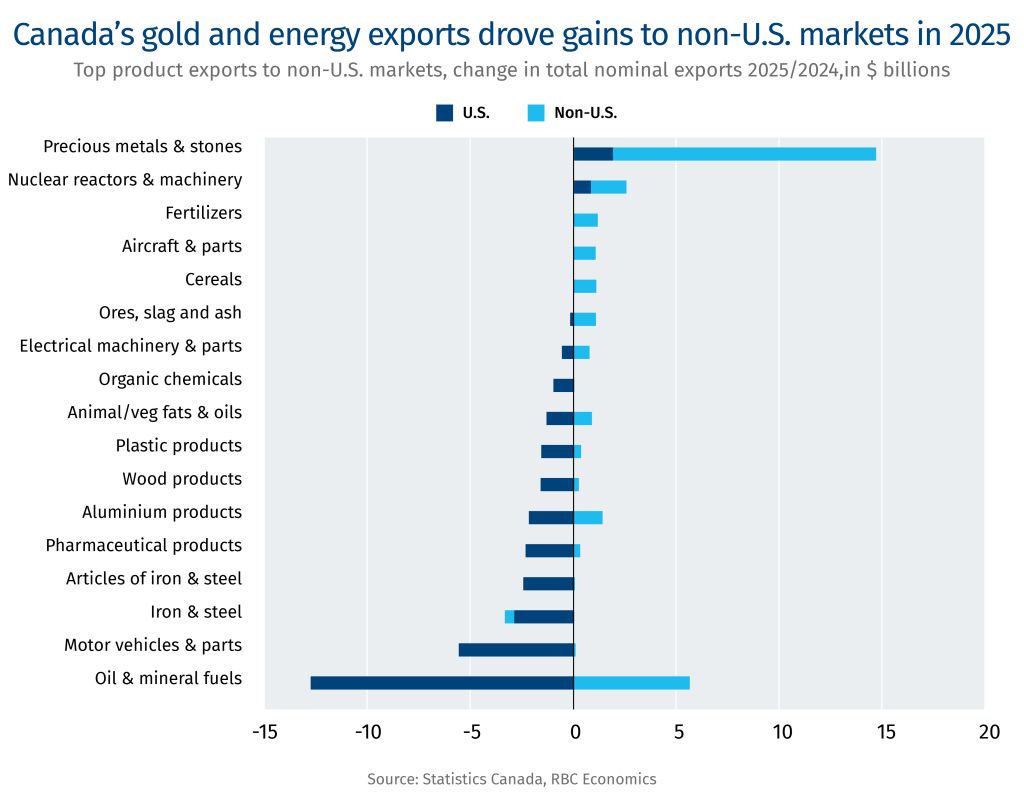
    Canada also re-oriented trade away from the U.S. in 2025—the U.S. share of total Canadian exports went from 76% in the fourth quarter of 2024 to 68% in the same period in 2025. While exports to the U.S. fell 6% year-over-year, or by about $35 billion, this was offset by a hefty $29 billion increase in exports to the rest of the world.

    Diversification didn’t come from finding new buyers for tariffed products. The increase, instead, came thanks to a surge in gold prices, which rose more than 60% in 2025. The result: gold exports to the U.K. alone spiked by $17 billion, or 76%, last year, making gold Canada’s second-largest export after crude oil. This significantly cushioned declines in other goods. 

    Gold also provided a big lift to the Canadian stock market, boosting Canadians’ financial wealth. The gold rally accounted for an estimated third of the TSX’s 28% gain and was the biggest driver behind the index outperforming the S&P 500 last year.  

  3. The U.S.-Canada trade war has been more narrowly impactful 

    Coupled with the energy shock, the trade shock is creating more distinct regionalization across Canada with some provinces and local economies disproportionately bearing the brunt of the breakdown. Though, none have been entirely immune.   

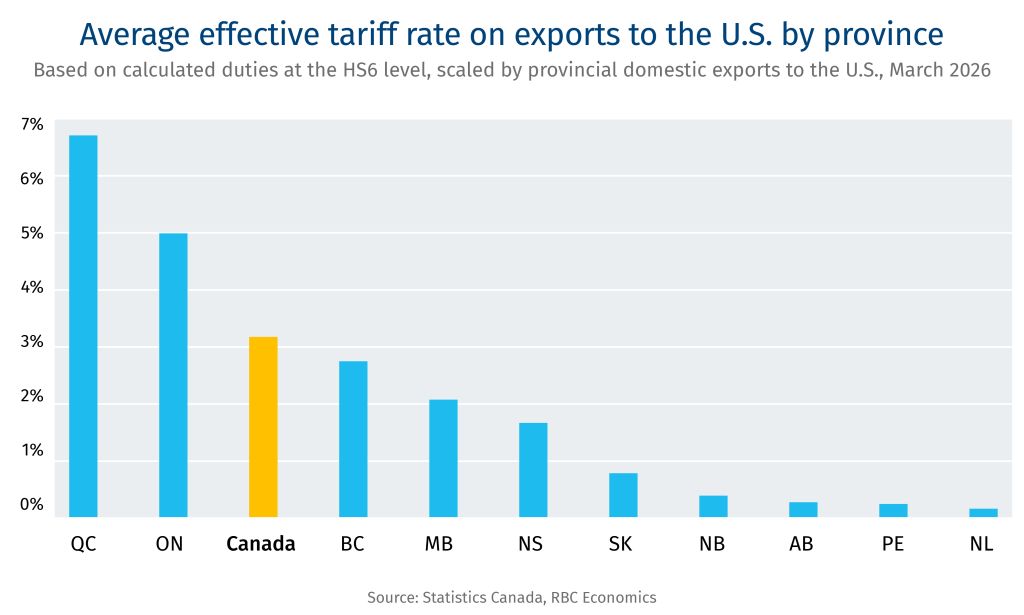
    Thanks to CUSMA, a narrower subset of industries, and therefore geographies, experienced the bulk of the trade shock. While the trade war became a national fixation, it hit manufacturing-heavy provinces of Quebec and Ontario the hardest. Steel, motor vehicles and parts saw the largest export losses, creating particularly acute challenges for regions like southwestern Ontario. Cities like Windsor, Ont., saw unemployment rates rise as high as 11.1%, while the national average peaked at 7.1%.  

    Outside of Ontario and parts of Quebec, the rest of Canada—particularly energy and agricultural-producing provinces—felt minimal direct impacts from the trade war. They benefitted from having very little trade being exposed to U.S. tariffs, and greater overall trade diversification. B.C., for instance, didn’t find itself at the heart of the conversation in 2025, but is likely to feel some pain in 2026 from the knock-on effects of lumber duties, which jumped in October 2025.  

    Coupled with the energy shock, the trade shock is creating broader economic divergence across the country, with several implications worth exploring for policymakers at all levels of government.   

  4. The U.S. trade deficit was redistributed 

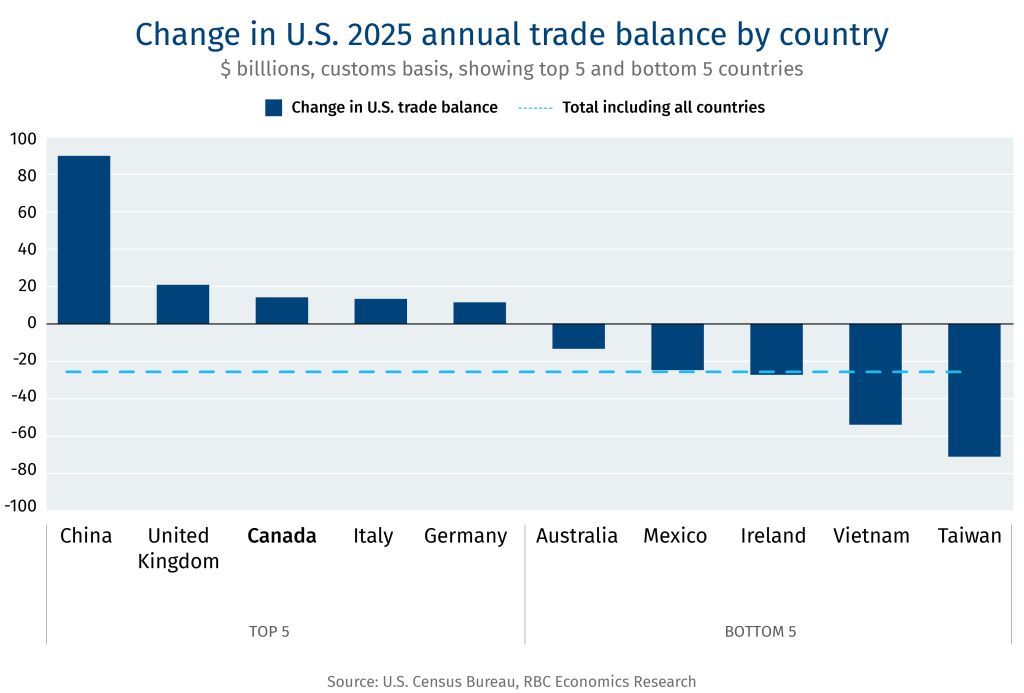
    Tariffs were justified by the U.S. administration, in part, as a method to reduce the U.S. trade deficit. One year on, however, the deficit has moved in the wrong direction. Overall, the goods and services deficit widened by US$47 billion in 2025 compared to 2024. The goods trade deficit alone hit a record US$1.26 trillion in 2025.  

    Beneath the surface lies a clear trade policy shift: While the total deficit grew, its mix changed meaningfully. Tariffs successfully reduced imports from primary targets (especially China), while ramping up from other Asian countries, including Vietnam, Taiwan, India, Thailand, and Malaysia. 

    Some other targets, including Mexico, saw exports to the U.S. rise. The U.S. deficit with Mexico grew significantly by US$25 billion despite being subject to 25-35% tariffs at various points in 2025, but with significant exemptions. Some trade goals are a poor match for deeply integrated manufacturing supply chains. 

    Ultimately, the geography shifted substantially, but the aggregate scale of trade did not.  

  5. Canadians have taken economic protection, and damage, into their own hands

    Retaliatory measures were put in place by governments, but Canadians took the trade war personally, particularly with travel. And, it had an impact on Canada, and a key sector in the U.S. 

    Limited retaliatory measures from the Canadian government minimized the impact of the trade war on consumer prices at home, but consumer behaviour, especially in travel, still changed

    The federal government’s initial tariff retaliation only covered about a third of U.S. imports before being repealed by September, except those on steel, aluminum, and autos. This kept consumer prices down and gave the Bank of Canada flexibility to further lower interest rates. Meanwhile, provincial governments have exercised product boycotts, notably around American-made liquor, while federal and provincial governments now have “Buy Canada” procurement policies. 

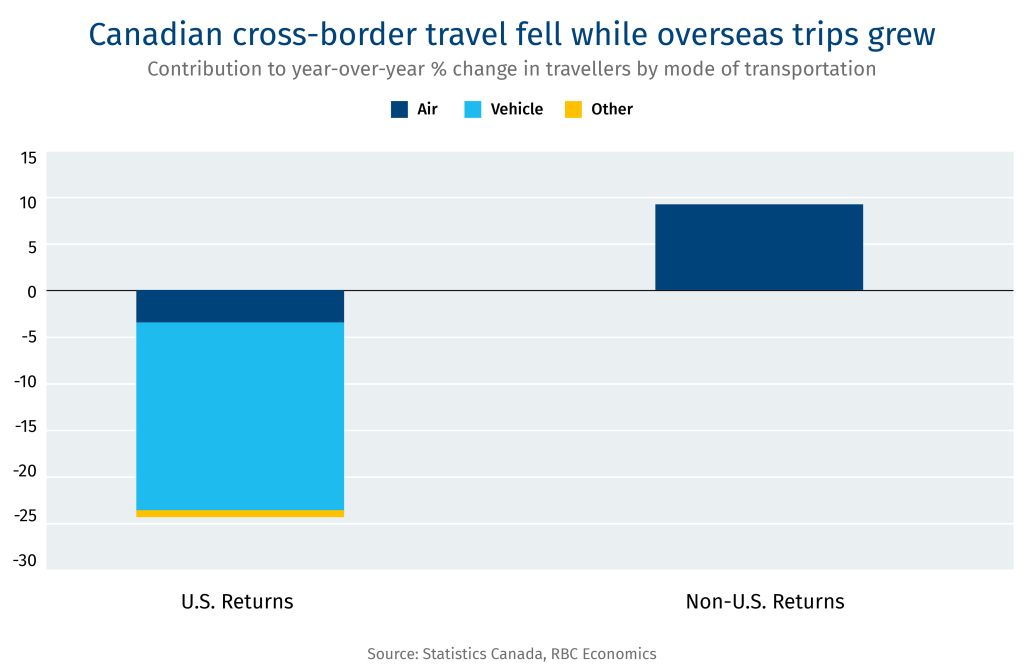
    Still, the country responded in less official, more targeted ways. Travel is the most notable example. Canadian returns from the U.S. shrank 25% year-over-year in 2025.

    Instead, travel to the rest of the world was up 9.2% compared to 2024. And Canadians spent more at home with a 2.7% bump in domestic tourism, raising spending to 11% above its pre-pandemic average. This has been a positive driver for increased domestic consumption. 

  6. Canada added more jobs than the U.S. in 2025 as both sides suffered from the shock 

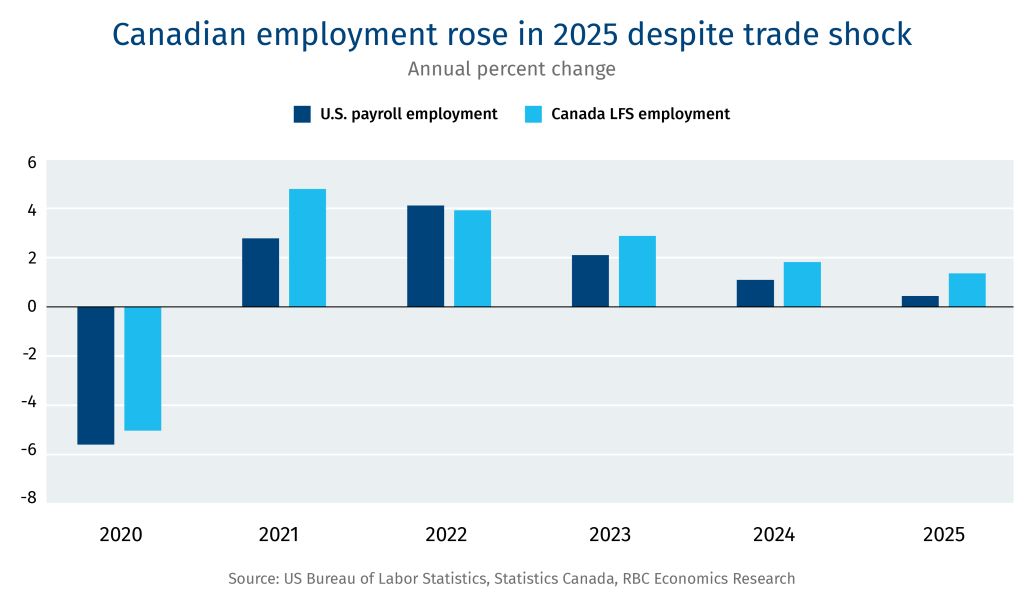
    Jobs data tells a surprising story. Canada’s Labour Force Survey showed 211,000 jobs were added in 2025, up 1%. Meanwhile, the American Nonfarm Payroll survey showed a 116,000 increase, a 0.07% bump to the employed number. 

    What’s even more interesting is what happened beneath the surface. In the U.S., about 275,000 jobs were lost last year in trade-exposed sectors, including manufacturing, wholesale, retail, transportation and warehousing, and temporary help services. Out of all trade-exposed sectors, transportation and warehousing were hit the hardest with the magnitude of job losses reminiscent of COVID era cuts. Nearly 430,000 jobs were added on net in all other sectors combined.  

    In Canada, jobs dependent on U.S. demand fell by 2%. The silver lining, at least for Canada, is that while the country’s exports (~68%) are heavily dependent on the U.S., only ~12% of jobs are dependent on U.S. demand, helping to stem the bleeding from the trade shock.  

    The bottom line: Workers in both economies have suffered and would benefit from improving trade relations over deterioration.  

WP Menu

wp-menu

➔ F1’s race ahead in sustainable fuel initiative

➔ Arrell Food Institute’s Evan Fraser on what keeps him up at night

➔ What’s Canada’s next big climate policy moment?

Clean energy spending is set to nearly double that of fossil fuels for the first time. For every dollar going to oil, gas, and coal (US$1.2 trillion), nearly two are expected to flow to renewables, nuclear, grids, storage, efficiency, and electrification in 2026, estimates the International Energy Agency in its World Energy Investment 2026 report. The Middle East conflict is reshaping energy investment in real time, pushing energy security to the forefront, notes Clean Tech Lead Vivan Sorab. Global energy investment is on track to hit US$3.4 trillion this year, a 5% rise from 2025, with solar investments attracting US$1 billion a day on average. Nuclear is also back, with 78 GW under construction across 15 countries and annual investment above US$80 billion. However, not all signals are positive, with coal supply investment reaching US$180 billion, the highest since 2012.

Montreal recently hosted Formula 1 with a new generation of sustainable fuels, continuing its legacy of climate leadership (Montreal Protocol, 1987; Kunming-Montreal Global Biodiversity Framework, 2022), writes Senior Vice-President, Office of the CEO, John Stackhouse, who was at the high-but-sustainable-octane event. It was part of F1’s new fuels standard this season targeting net zero by 2030. The cars ran on 100% Advanced Sustainable Fuel, with Team Mercedes winning the Canadian Grand Prix using fuel developed by partner Petronas. The sustainability initiative extends beyond fuel: support crews travelled via cargo planes using sustainable aviation fuels, and cars feature enhanced efficiency designs. Montreal also recently hosted the FIA Sustainable Innovation Series exploring how AI and technology drive efficiency gains.

For Sarah Goodman, the wildfire crisis hits close to home. Almost everyone in British Columbia now knows someone who’s been evacuated from their home due to wildfires, said Vancouver-based Goodman, who leads NorthX, the B.C. firm that’s identified wildfire as a strategic sector to deploy “hard” climate solutions.

The firm, backed by federal and provincial governments and Shell, has invested $5.5 million in wildfire tech, including a fresh $2.2 million round in three promising startups. This year’s wildfire season is already ravaging parts of B.C. and Alberta, as temperatures recently hit 23.9 degrees in Vancouver—breaking a 128-year-old May record.

Wildfires both result from, and accelerate, climate change. Hotter weather turns forests into tinderboxes, sparking economic and environmental disasters:

  • Insured losses from wildfires in Canada soared 1,003% to reach $8.1 billion between 2016-2025, compared with $734 million the previous decade, according to CatIQ.

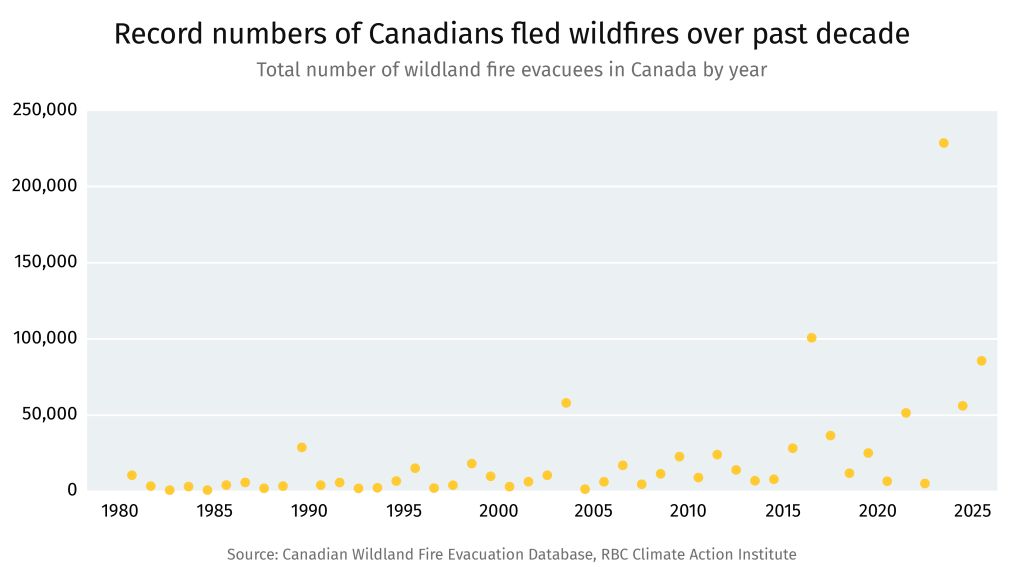
    Record numbers of Canadians fled wildfires over past decade. Total number of wildland fire evacuees in Canada by year.
  • As much as 7% of Canada’s oil production was briefly shut during an Alberta wildfire last year, with major pipeline infrastructure perilously close to the flames.

  • 2023 and 2025 were Canada’s two worst wildfire seasons ever. Wildfire carbon emissions in Canada in the first 10 months of 2025 hit 250 megatonnes (for context the nation’s GHG emissions were 661.5 MT in 2024), according to the European Commission’ Copernicus database.

  • If Canada’s forest wildfires were a country, they would have been the world’s eighth-largest emitter in 2023, according to 440megatonnes.ca. Yet wildfires from unmanaged forests are not counted in Canada’s official emissions.

  • “The rate of change in wildland fire severity and behaviour is accelerating faster than we can comfortably keep pace with,” says Stacey Sankey, Natural Resource Canada’s policy advisor and author of Blueprint for Wildland Fire Science in Canada (2019-2029).

Investment is ramping up to suppress, mitigate and manage wildfires—but as Goodman notes, “we are in the early stage of wildfire tech”:

  • In April, NorthX Climate Tech invested a combined $2.2 million in three B.C. startups in a new round: Crown.ai, Nova and Skyward Wildfire Technologies.

    • Crwn.Ai uses artificial intelligence to predict power line-caused ignitions;

    • Nova—another AI-powered tech—uses aerial data to identify potential hotpots;

    • and Skyward aims to tackle lightning—often sparking destructive fires.

  • “Wildfires behave differently in different geographies,” said Goodman, but there are opportunities to export Canadian tech. Nova, for example, operates in 200 jurisdictions globally.

  • The federal government is boosting wildfire funding by $70 million to $629.8 million through 2030. Some of the $290-billion defence budget could also serve dual purpose for aerial monitoring and wildfire suppression.

When it comes to wildfires, Stacey Sankey wrote the blueprint—literally. The Senior Policy Advisor at the Canadian Forest Service authored the Blueprint for Wildland Fire Science in Canada (2019-2029). The situation has improved significantly, but there is still meaningful work to be done, Stacey said. The interview is edited for brevity:

Q: Have the challenges you identified in the report improved or worsened since its publication?

A: Blueprint made 15 recommendations to guide science investments, attract new partnerships, and align national research efforts. Progress on the human resources gap has been real. A $5 million investment, through Natural Resources Canada (NRCan) and the National Science and Engineering Research Council (NSERC), created a Wildland Fire Research Network, anchored at the University of Alberta, developing 68 wildland fire professionals across master’s, PHD, and post-doctoral programs. As a part of this network, numerous universities have expanded their programs to include wildland fire related research and courses. The federal government has also invested heavily in training more community-based firefighters. That said, progress continues to be stretched by the scale of growth in wildland fire severity.

Q: Which of your recommendations have been implemented?

A: There has been substantial and concrete movement across the Blueprint’s core recommendations: on increasing research and innovation capacity, respecting Indigenous knowledge, expanding partnerships, and sharing governance and coordination.

NRCan has strengthened data, modelling and decision support systems, including modernization of the Canadian Wildland Fire Information System (CWFIS) and the Canadian Forest Fire Danger Rating System (CFFDRS). New target investments have advanced wildland fire risk assessment tools, while NSERC Network created a new generation of trained wildland fire expertise.

On Indigenous fire stewardship, implementation includes establishment of REDFire (Reciprocity, Ecology, and Diversity in Fire) Lab and Thunderbird Collective, which work to advance Indigenous leadership and knowledge in wildland fire management.

The federal government is supporting provinces and territories to procure specialized equipment, train firefighters, and secure aerial firefighting capacity. Canada also committed to international cooperation through the G7 Kananaskis Wildfire Charter and WildFireSat, a collaboration between NRCan, Environment and Climate Change Canada, and the Canadian Space Agency, which will be the world’s first government-owned satellite system for monitoring wildfires.

Q: What other challenges have emerged since the report was published?

A: The rate of change in wildland fire severity and behaviour is accelerating faster than we can comfortably keep pace with and firefighting resources continue to be stretched, keeping Canada reliant on international resources during extreme fire events. There also continues to be more work that can be done in advancing Indigenous wildfire stewardship.

Sitting at the intersection of food, sustainability and climate change, Evan Fraser, Executive Director at the Arrell Food Institute at the University of Guelph, is worried a changing climate could trigger a global polycrisis. Still, he believes Canada can step up to be a source of food stability for the world.

Q: What’s one thing you wish more people understood about the relationship between climate change and our food system?

A: While we often talk about energy systems (heating, lights, power, gas) as a key lever through which we can address climate change, food is also a very big lever. Food systems produce around 30% of the world’s greenhouse gas emissions. But systems can become net-zero, or even “net-negative” (i.e. absorb more greenhouse gases than they emit), with a few big changes. The secret is to reduce fossil fuel use in food production and supply chains, apply inputs like fertilizer with precision, and build up the soil’s organic matter. The latter is where the “net-negative” opportunity lies. Soil organic matter is essentially carbon dioxide turned into plant material. If farmers adopt practices such as reducing soil disturbance, it allows soil organic matter to build up, pulling carbon dioxide from the atmosphere. Soil organic matter also acts like a sponge, trapping water when it is available and holding onto it when it is needed, making soil more resilient to extreme whether events.

Q: What climate and food-related issues are keeping you up at night?

A: What’s keeping me up at night isn’t climate change on its own, but the interaction of climate, geopolitical and economic changes. I worry these stressors are building to a cascade of crises that may overwhelm countries and households. 

Since the U.S./Israel-Iran war started, and the Strait of Hormuz was blockaded, fertilizer prices have skyrocketed, forcing farmers all over the world—especially small-scale farmers in Africa and other places—to cut back. This will result in lower yields. At the same time, the U.S. Mid-West is experiencing severe drought, the Indian monsoon is set to be weak, and a major El Niño threatens the Southern Hemisphere’s next growing season.

I am worried we are facing a polycrisis. Over the next six to 12 months, several things may go wrong in the food system, triggering another rash of food inflation. One risky scenario is a repeat of widespread food riots of 2008-2011 that exploded in Haiti, Cameroon, and dozens of other countries. I am already seeing worrying signs that we could be heading back to this area in places like Kenya. A bad harvest this year due to climate change could accelerate the disturbances, leading to political volatility. 

Q: What innovations in the food system are you most optimistic about? And what do you think Canada’s role is (or should be) in advancing the innovation?

A: Canada should set itself up to become the world’s most reliable and trusted exporter of food and agri-food exports not only as an economically valuable commodity to be traded but also a strategic lever. Through food exports, we can export geopolitical stability and resilience, and that is a role that Canada should lean into, especially in this extraordinarily turbulent moment. 

To lead, we need major investment in agri-food research and training, focusing on innovations like drought and pest-tolerant seeds, AI decision-support tools for farmers, and smart tractors. These advances will help Canadian farmers navigate climate change and geopolitical disturbances. These innovations, combined with our farmers, geography and land and water resources, Canada is positioned to become one of the world’s most important breadbaskets this century. 

  • Rick Smith of the Canadian Climate Institute believe Canada’s next big climate policy moment will be the release of federal vehicle regulations to reach the equivalent of a 75% EV adoption rate by 2035.

  • Michael Liebreich on the Great Clean Energy Acceleration 2.0—a discontinuity in energy markets as profound as the oil shocks of the 1970s.

  • Jonathan Stern, Distinguished Research Fellow at the Oxford Institute for Energy Studies, asks in a report: are efforts to reduce flaring from oil and gas upstream operations a lost cause?

  • Celeste Saulo, secretary general of the World Meteorological Organization, warns why the El Niño weather phenomenon expected this summer is an “urgent climate warning.”

Curated by Yadullah Hussain, Managing Editor, RBC Climate Action Institute.

Climate Crunch would not be possible without John Stackhouse, Jordan Brennan, John Intini, Farhad PanahovLisa AshtonShaz MerwatVivan SorabCaprice Biasoni, Lavanya Kaleeswaran and Joelle Schonberg .

Have a comment, commendation, or umm, criticism? Write to me here (yadullahhussain@rbc.com)

Climate Crunch Newsletter

WP Menu

wp-menu

The Strait of Hormuz blockade has exposed two chokepoints amid the Middle East conflict: one for fossil fuels, and another for Western decarbonization policies. In many respects, it is China that’s leading the global energy transition. Emerging trade data highlights China’s often-underappreciated position in global clean energy supply chains, which has only accelerated with the Hormuz crisis.

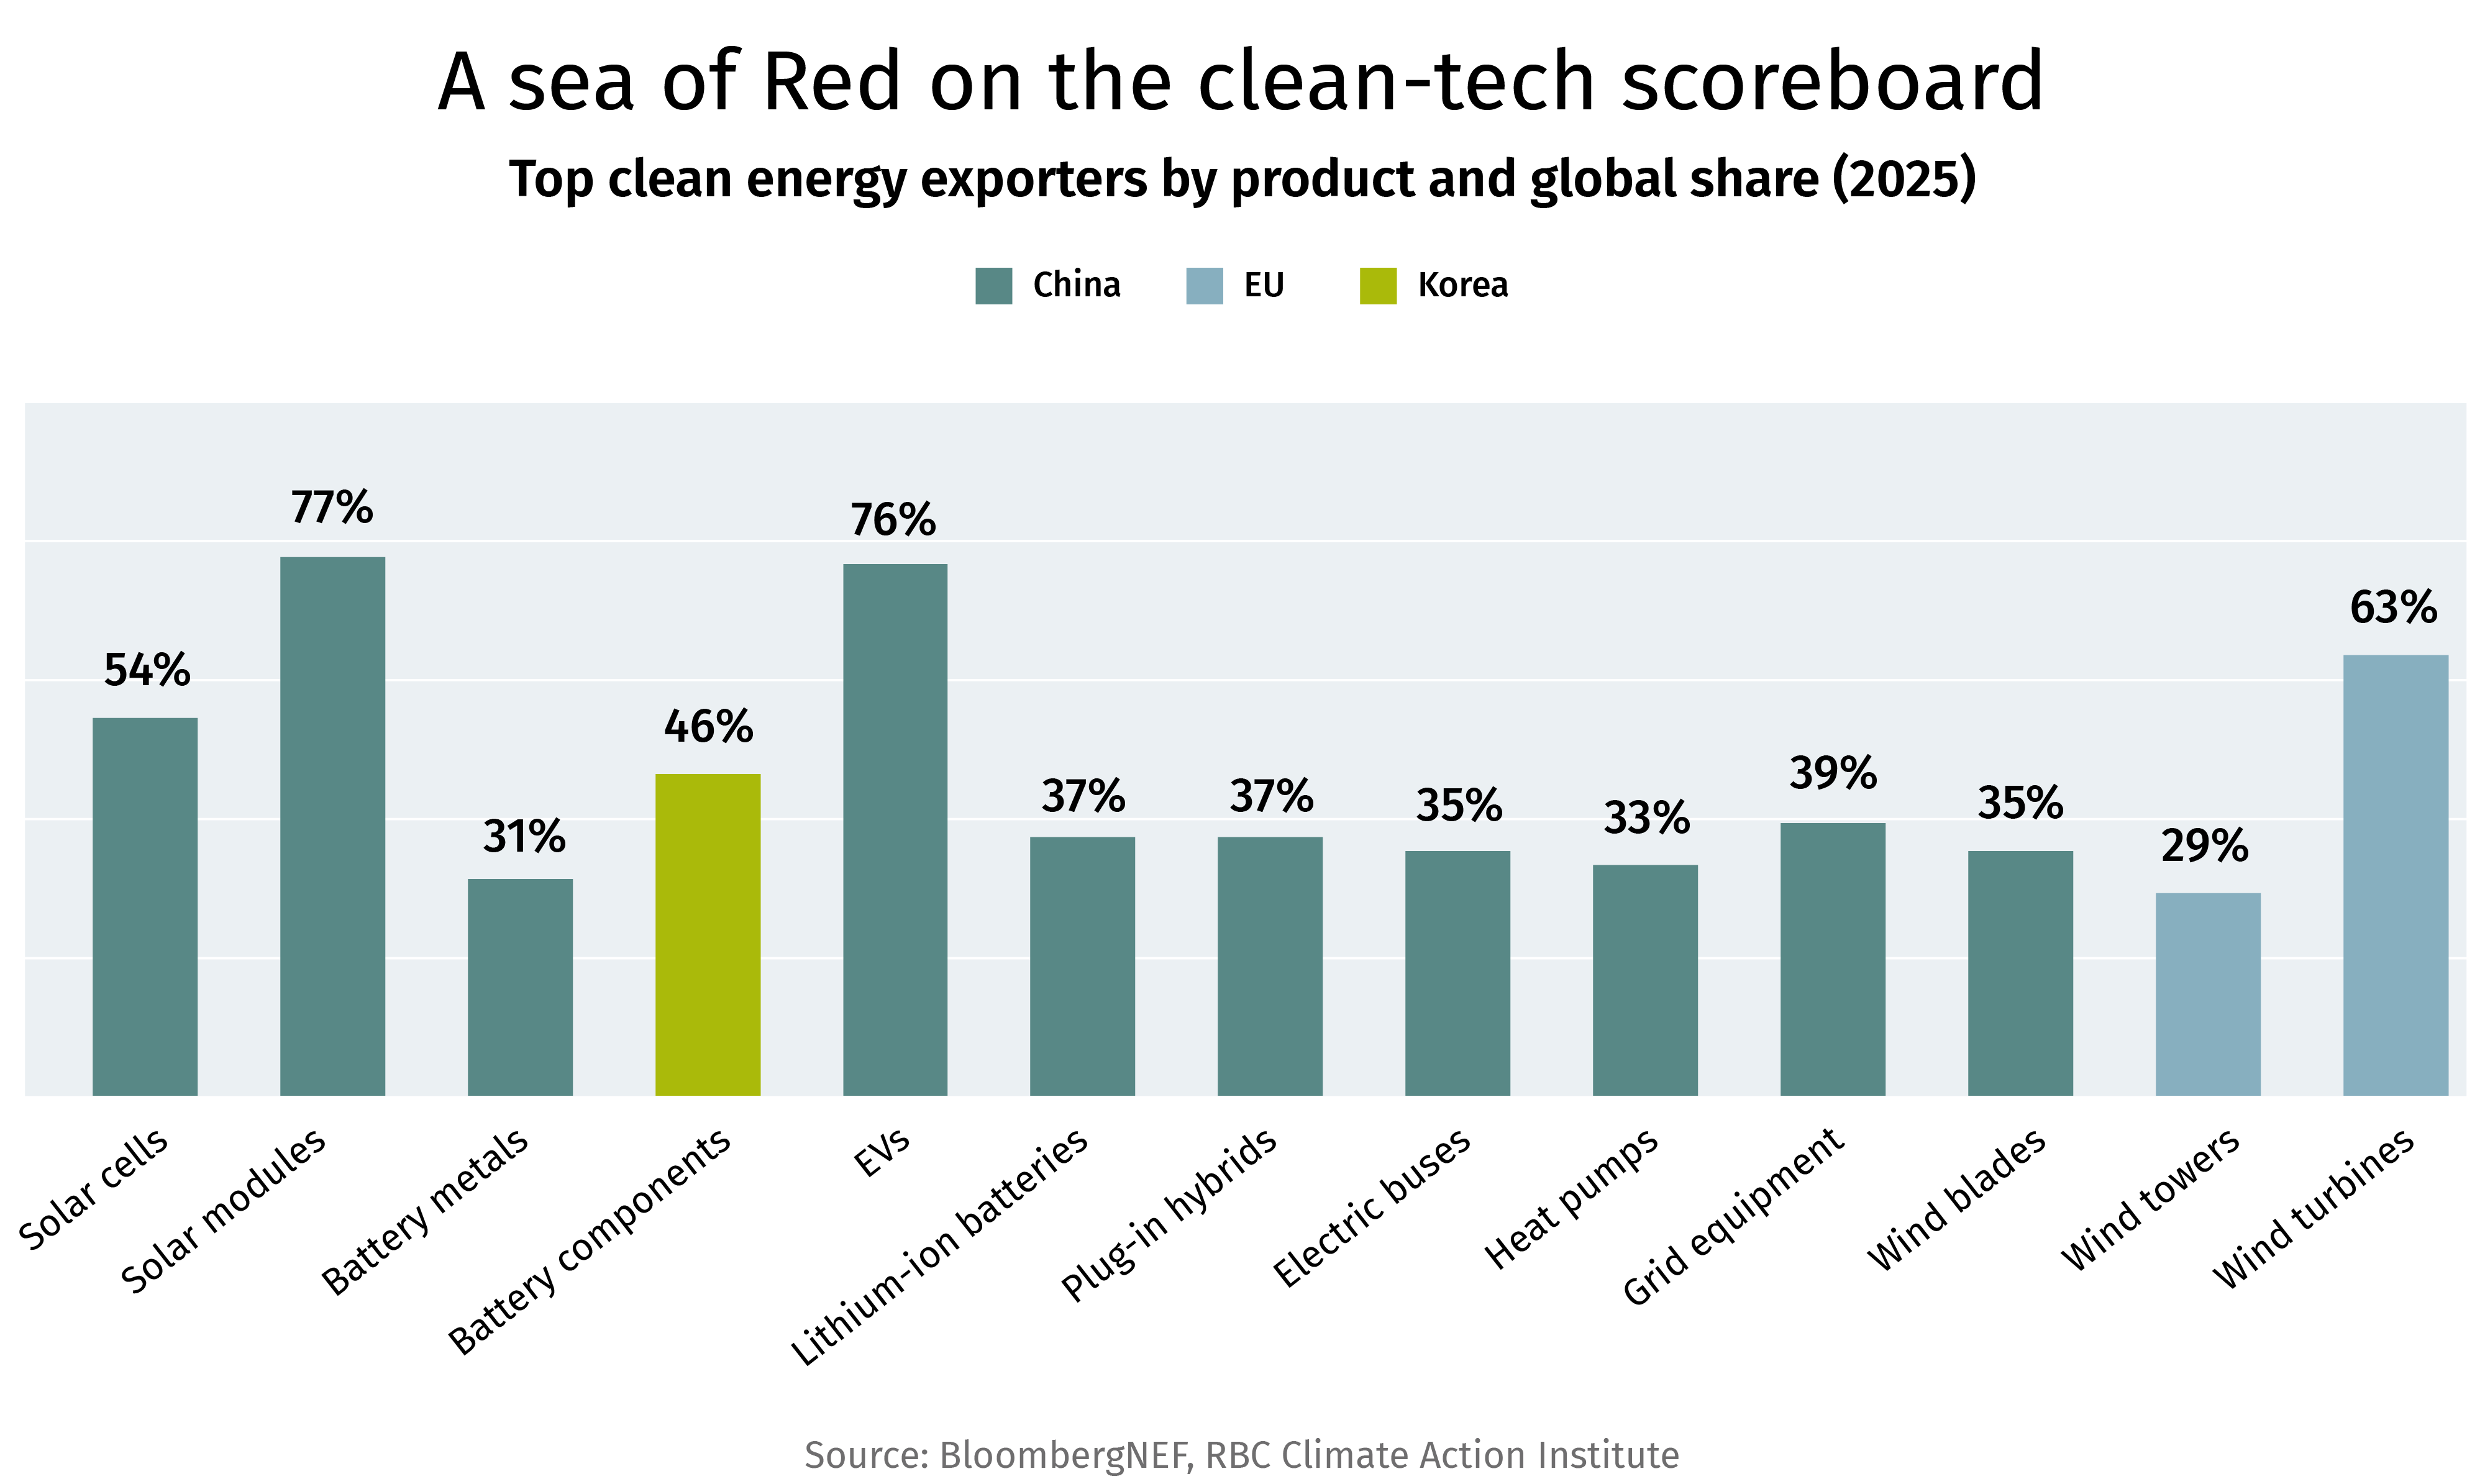
A sea of Red on the clean-tech scoreboard. Top clean energy exporters by product and global share (2025)

China is the largest exporter of almost every major clean technology, often by a significant margin. Non-Chinese leaders—the E.U. for wind towers and turbines, and South Korea for battery components—either source from, or invest alongside, China. In North America, geopolitical sensitivities (to date) have outweighed benefitting from China’s structural advantage.

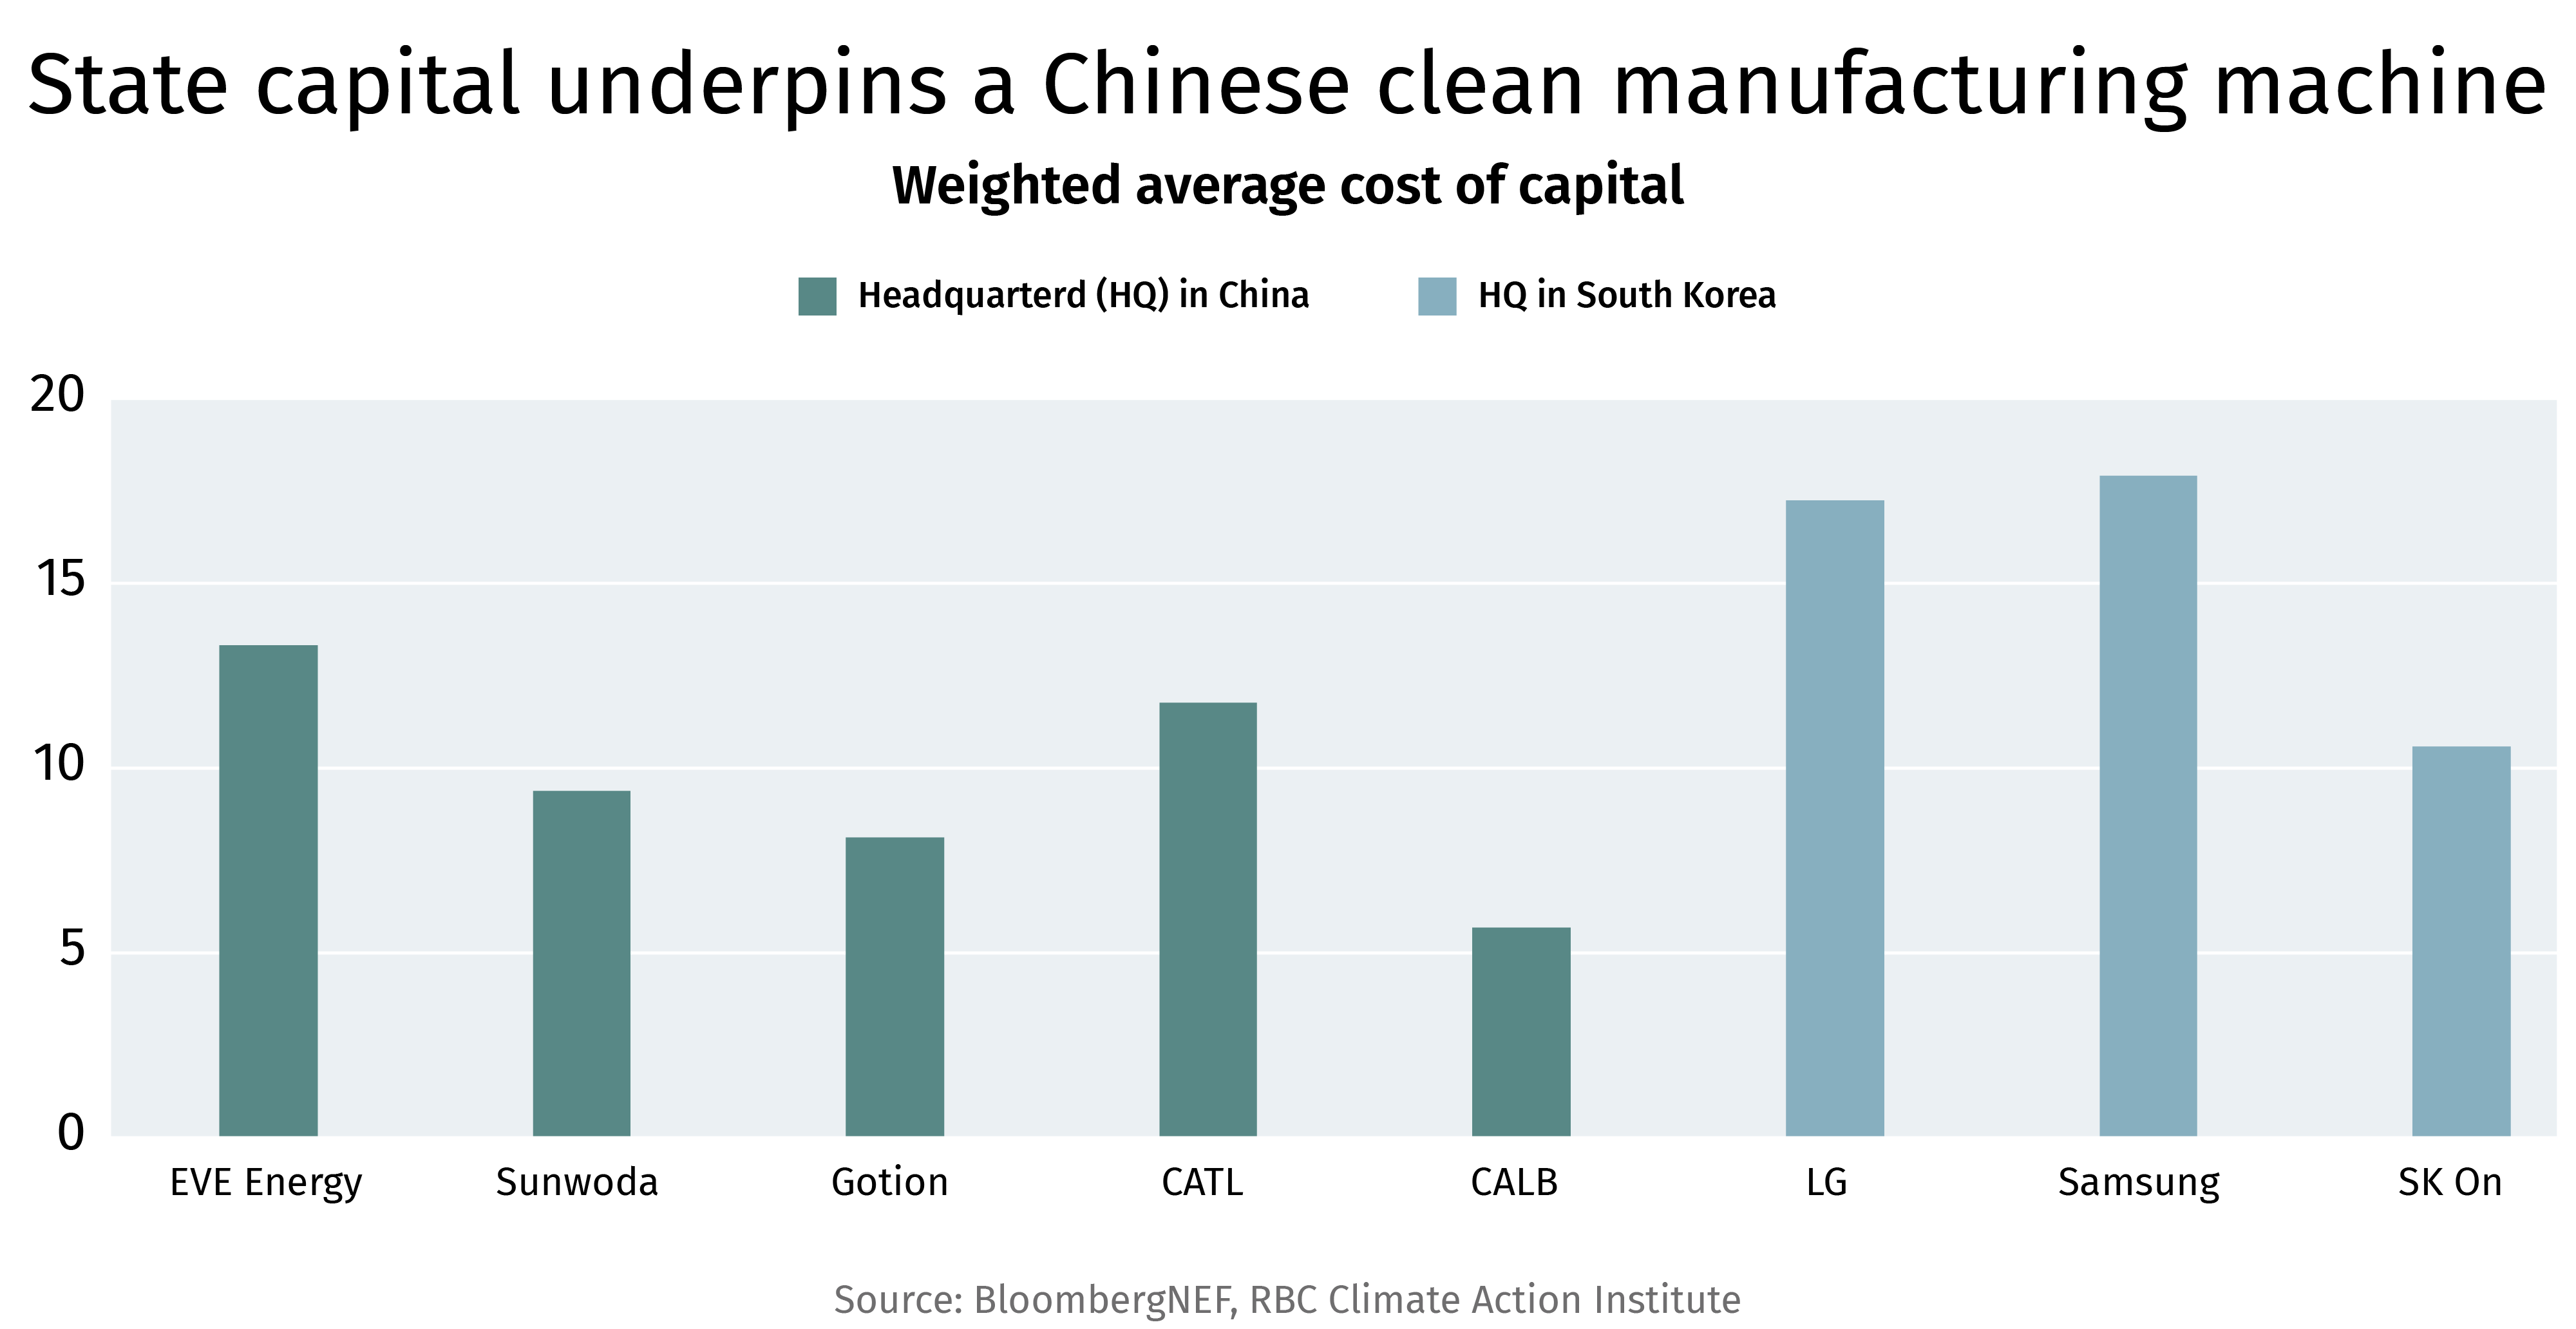
State capital underpins a Chinese clean manufacturing machine. Weighted average cost of capital
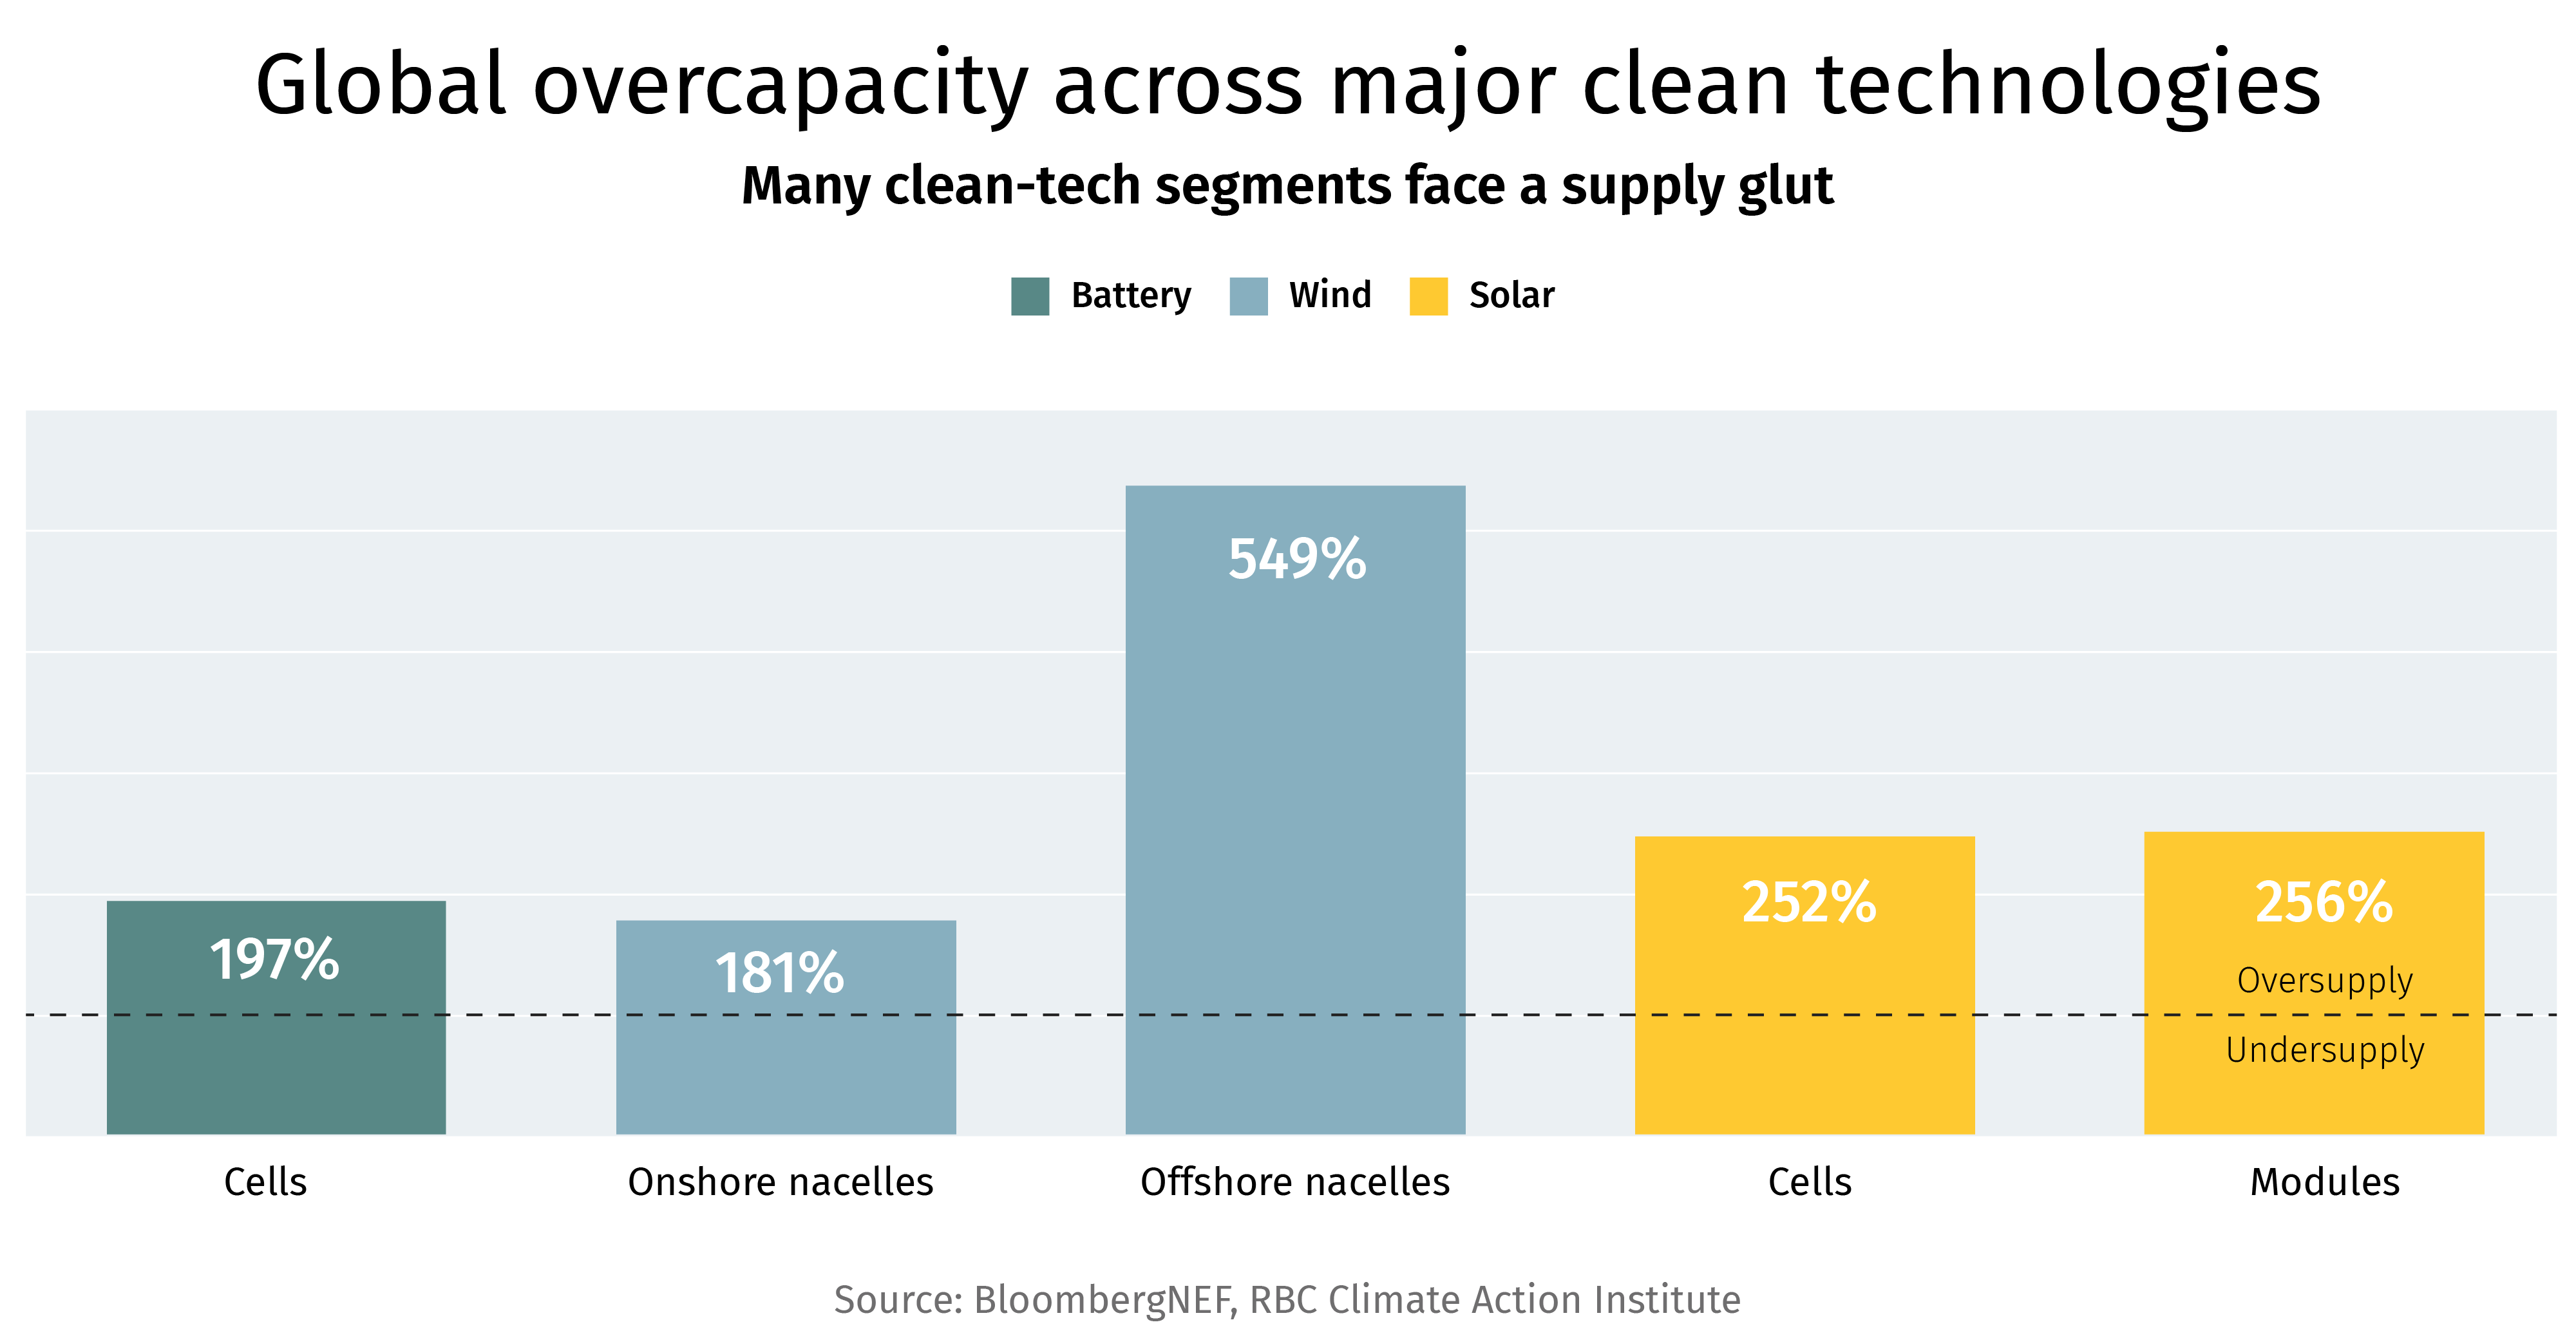
Global overcapacity across major clean technologies. Many clean-tech segments face a supply glut

Chinese producers carry a structurally lower cost of capital than peers—state backing and preferential financing, which in turn often generates and perpetuates overcapacity at a scale private markets cannot, and would not, sanction. This creates a self-reinforcing cycle of fierce domestic competition where only the fittest survive, resulting in a cost floor that continues to fall. If and when demand responds, China is best suited to gain incremental market share given the overcapacity. China has since tried to slow this competition through self-discipline agreements among manufacturers, but thus far has been unsuccessful.

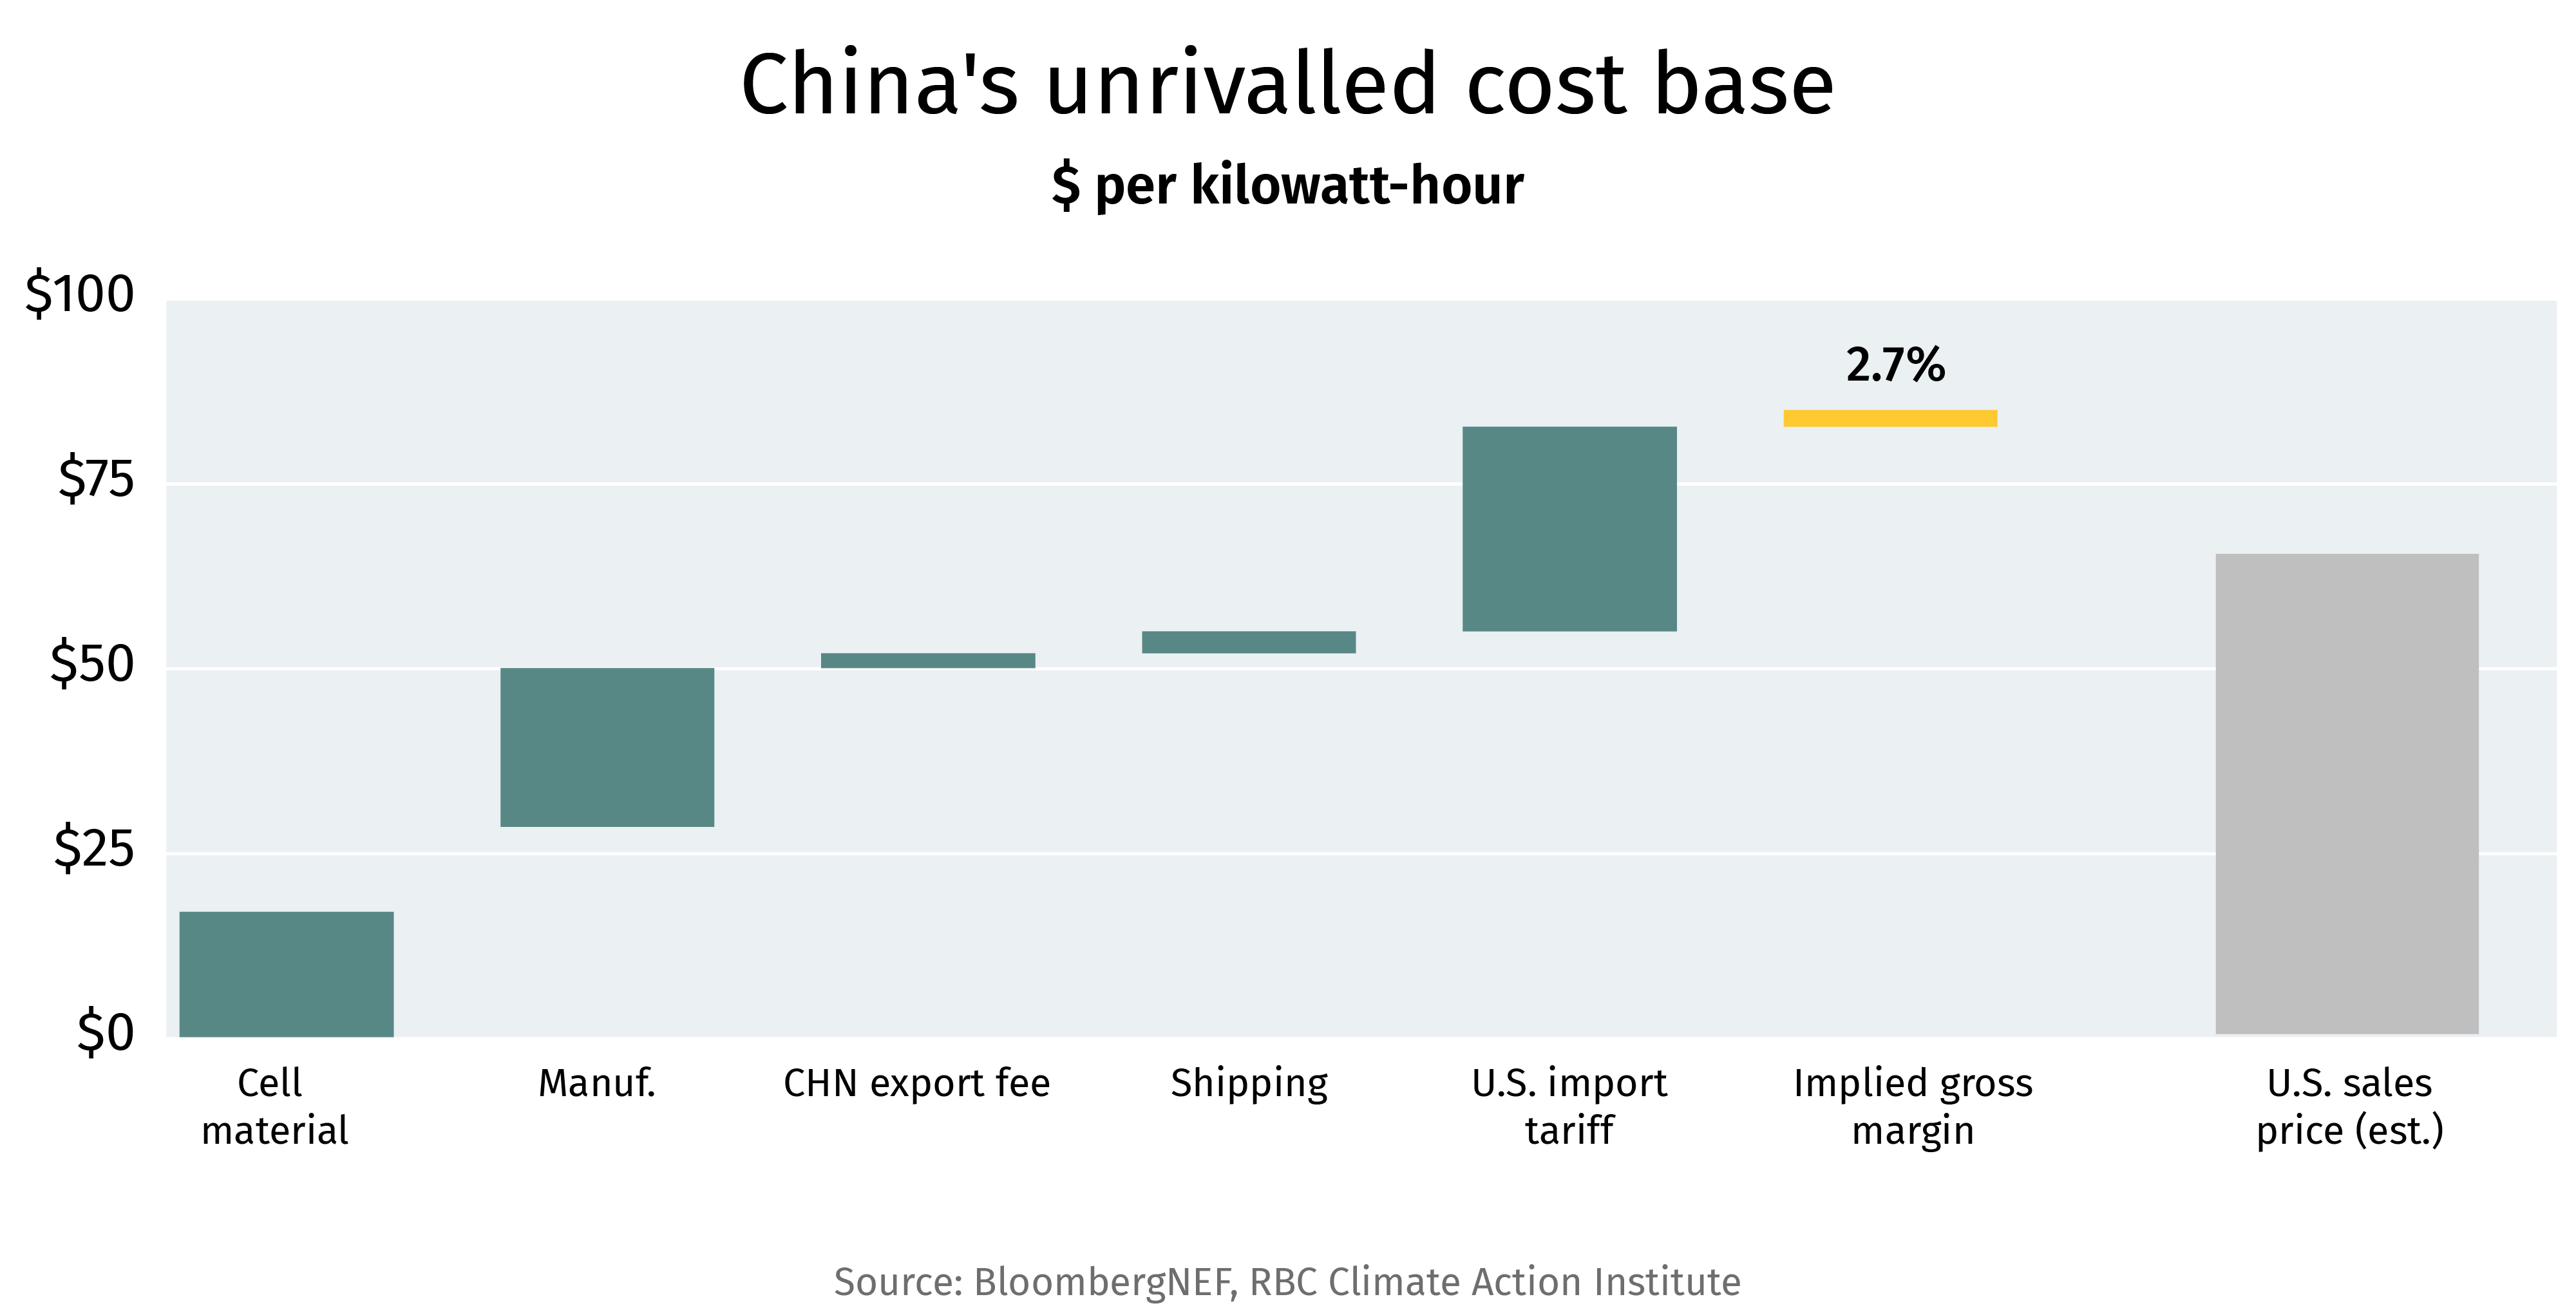
China's unrivalled cost base - $ per kilowatt-hour

Chinese cell materials and manufacturing account for less than US$50 of an US$84 per kilowatt-hour (kWh) delivered cost for battery cells sold into the U.S. The import tariff adds US$27/kWh—more than China’s entire manufacturing cost. Still, Chinese exporters earn a 2.7% margin.

By comparison, S&P Global estimates North American NCM811 (nickel-cobalt-manganese) battery cells cost roughly US$95/kWh, around 90% more expensive than Chinese battery cost. To put this into context, a Tesla Model Y Standard Range carries a 60 kWh LFP (Lithium Iron Phosphate) battery pack. At median Chinese LFP pack prices of US$81/kWh (as per Bloomberg NEF data), a similar sized battery would cost roughly US$4,900 ($6,500), or about 13% of the Model Y’s Canadian sticker price.

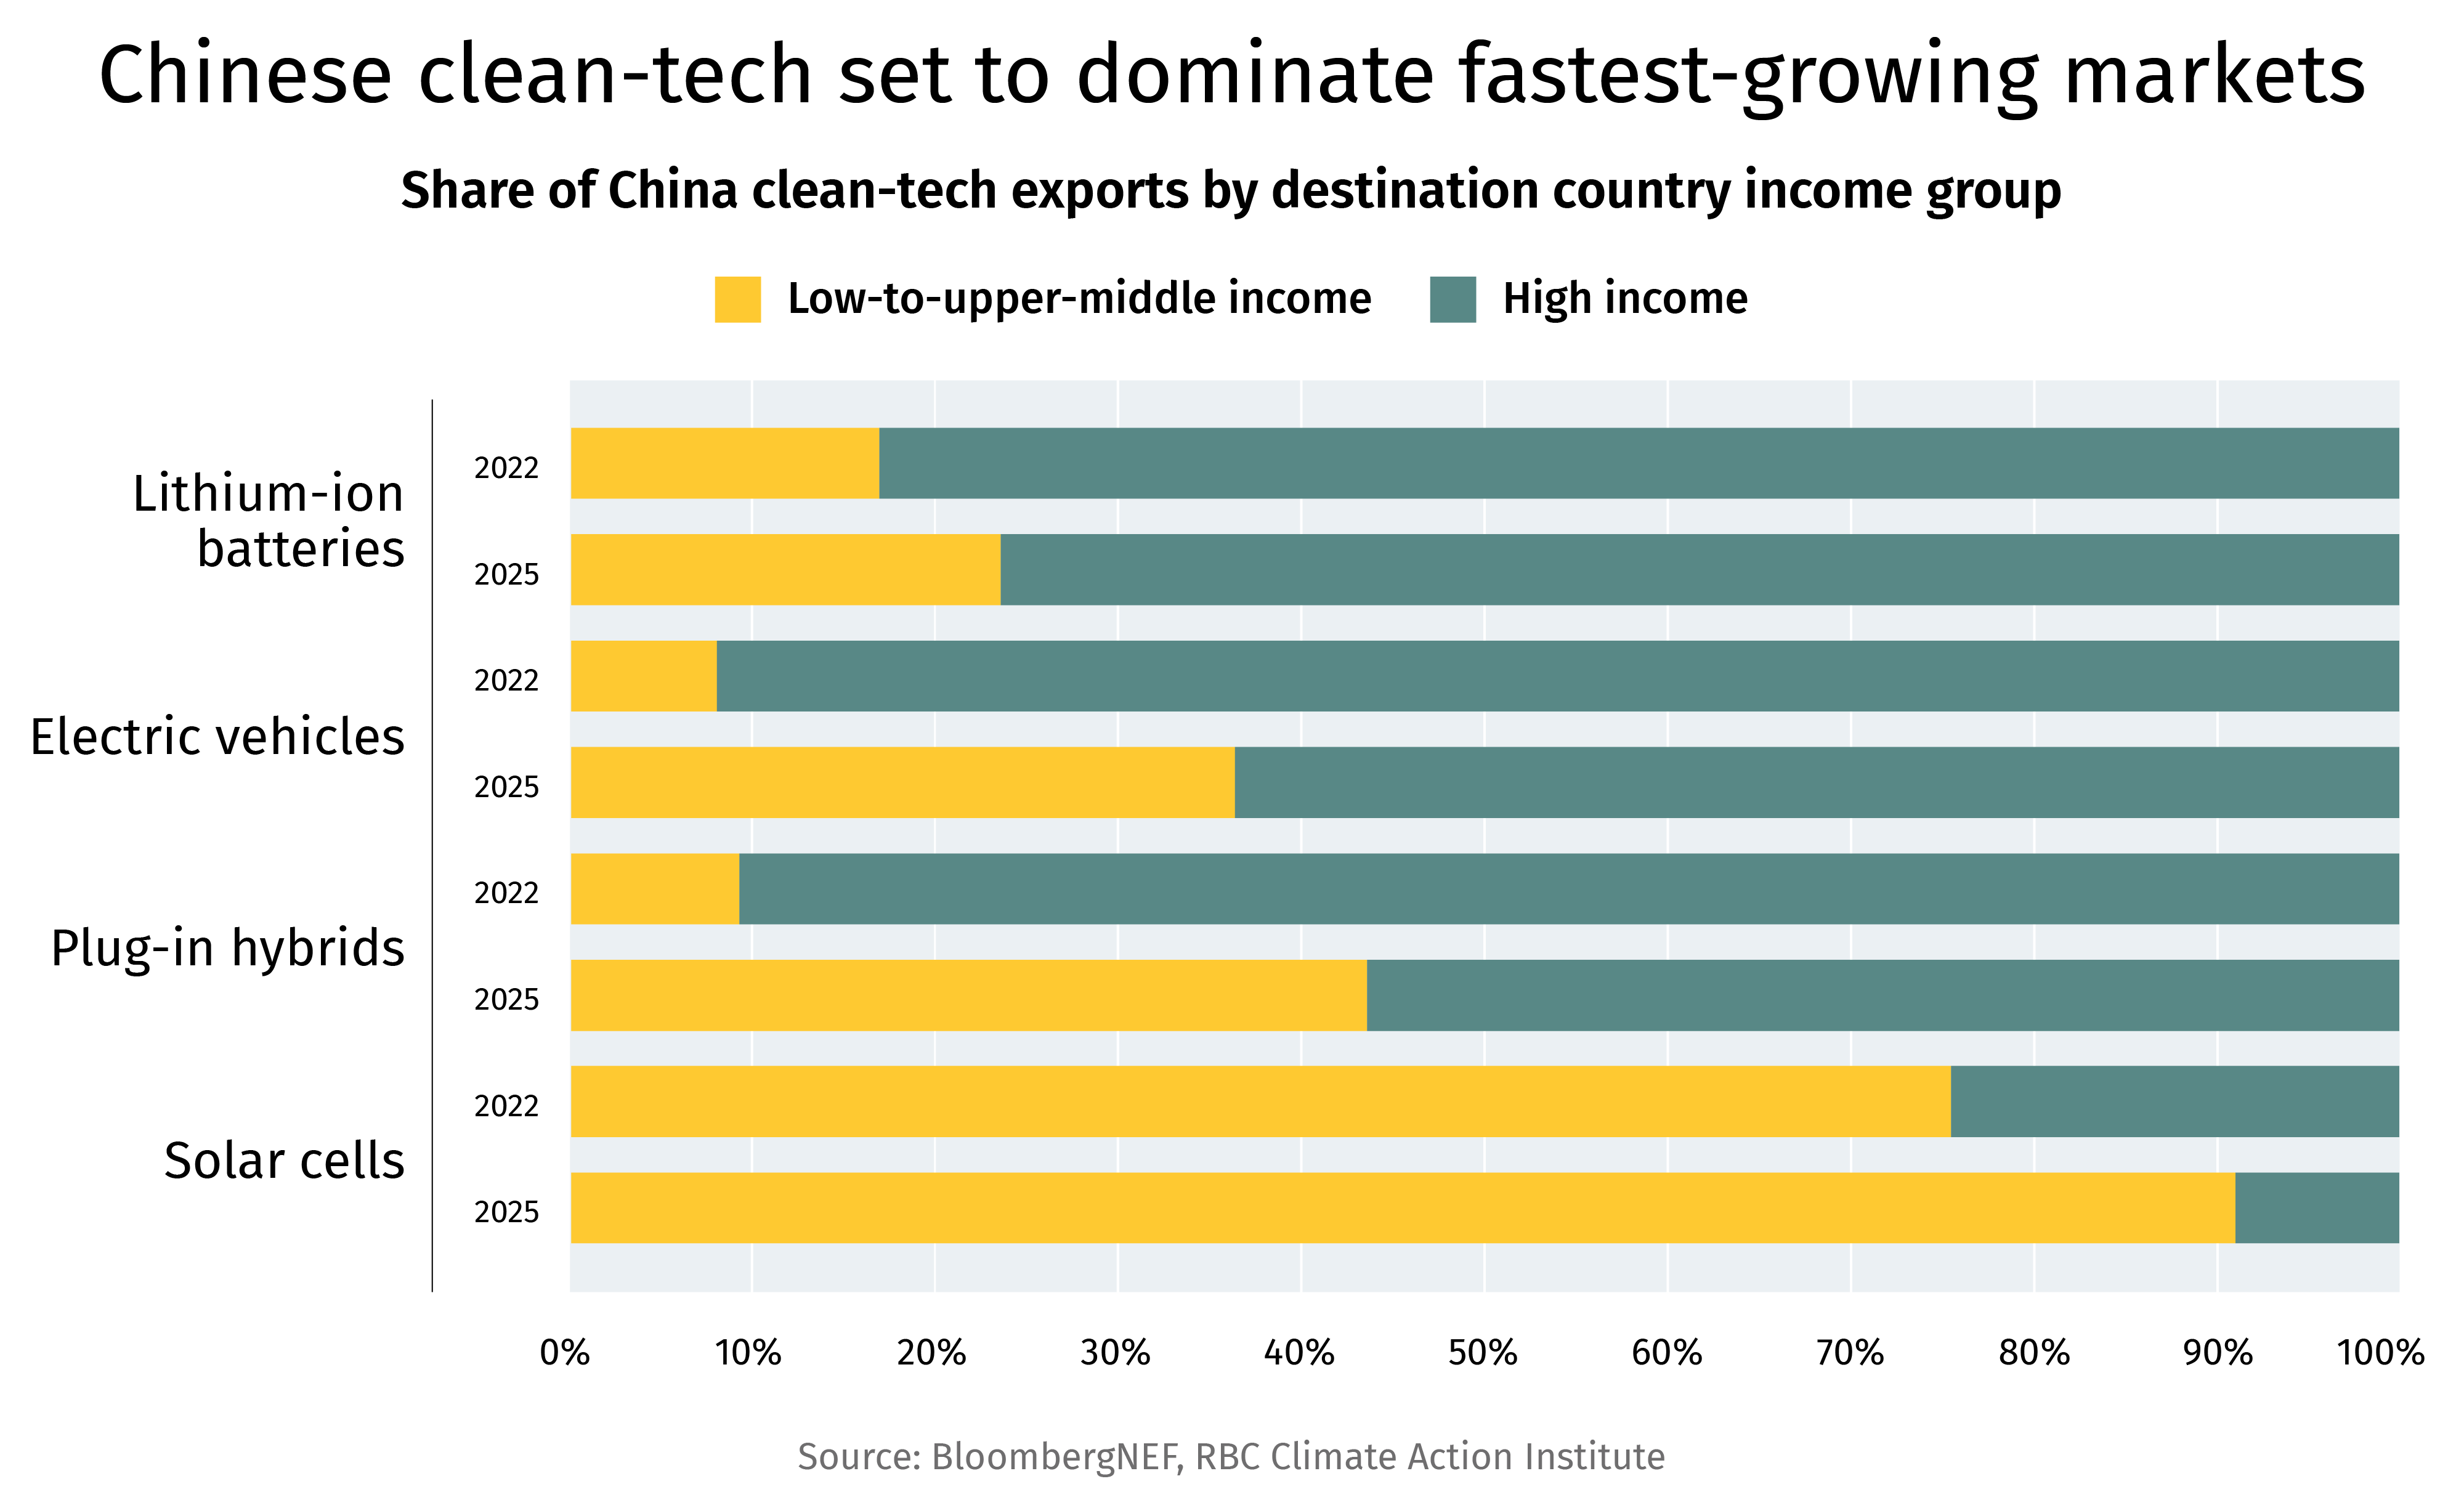
Chinese clean-tech set to dominate fastest-growing markets. Share of China clean-tech exports by destination country income group

While the West is often fixated with the higher cost of clean technologies, roughly 40% of China’s EV exports and over 90% of solar cell exports went to lower-income countries in 2025. China’s cost base has unlocked a category of clean buyer no Western producer will likely ever reach—fast-growing markets, concentrated in Asia, where clean energy adoption is accelerating rapidly.

Pakistan added 18.3 GW of solar in 2025 alone—75% of Canada’s entire installed solar and wind capacity to date—mostly imported from China. Adoption of EVs in Vietnam and Thailand—countries where nominal GDP per capita is less than $10,000—run north of 40% and 20%, respectively (Canada’s EV adoption in 2025 stands at 11%). Vietnam and Thailand do not provide fiscal incentives for the purchase of electric vehicles.

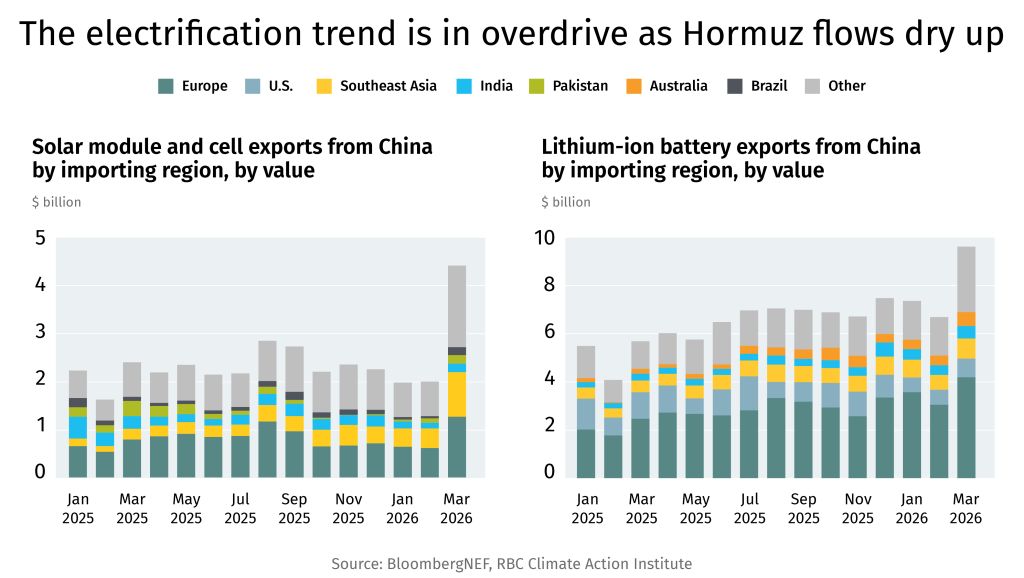
The electrification trend is in overdrive as Hormuz flows dry up. Solar module and cell exports from China by importing region, by value. Lithium-ion battery exports from China by importing region, by value

The Middle East conflict that choked the Strait of Hormuz brought the electrification trend into focus, with fossil-fuel importing countries accelerating their clean energy procurement.

As a result, Chinese battery exports reached nearly US$10 billion in March of 2026 alone, with Europe, Southeast Asia and the Middle East absorbing the volume. U.S. demand was just 8% of March exports.

The transition is happening on Chinese terms. South Korea and Europe have treated that as a sourcing and partnership question, rather than a binary one, and have advanced as a result. North America must also pursue strategies that find a balance between utilizing Chinese content but also building a domestic base that can compete and scale up to meet the opportunity offered by the global energy transition.

WP Menu

wp-menu

  • Pathways for pipeline: Breaking down the Alberta-Canada deal

  • Why Hope Bay project boosts Indigenous participation

  • Oil is spiking, but clean energy stocks are the ones getting a bump

Honda may have shelved its $15-billion EV plant in Ontario—but there’s a world where Canada’s assembly lines bustle with activity. In Steering Through Uncertainty, RBC Thought Leadership’s Managing Director Jordan Brennan outlines four possible futures for the embattled Canadian auto industry. One of the rosier forecasts sees the industry restore access to the U.S. market, unlock billions in pledged investment for EVs and conventional vehicles, and ramp up car assembly to two million by 2040 (from 1.3 million today). Leveraging critical mineral reserves bolsters the case for made-in-Canada cars. That’s the fast lane scenario. Other projections lead to diversification, deceleration, and even a dead end. Dive into all four scenarios here.

Hope Bay project promises Inuit-led development. Ottawa broke ground on the $2 billion redevelopment of the Hope Bay gold mine in Nunavut—projecting $2.6 billion in annual export growth and nearly 2,000 jobs. Ottawa also committed $25 million to the Kitikmeot Tugliq Energy Hope Bay Wind Project, an Inuit-owned wind and battery storage system that will power the mine. The project is a useful real-world test of the framework examined in Nations Building, our assessment of Indigenous loan guarantee programs in Canada’s new project wave. Hope Bay is promising on three counts:(1)The mine will be powered by wind and batteries rather than diesel. (2) Indigenous equity participation in mining remains structurally underrepresented. Hope Bay is gold, not a critical mineral, but it establishes a template for the harder projects that follow. (3) An Inuit-owned energy project powering a mine on Inuit lands offers opportunities communities in remote regions toparticipate in Canada’s new projects.

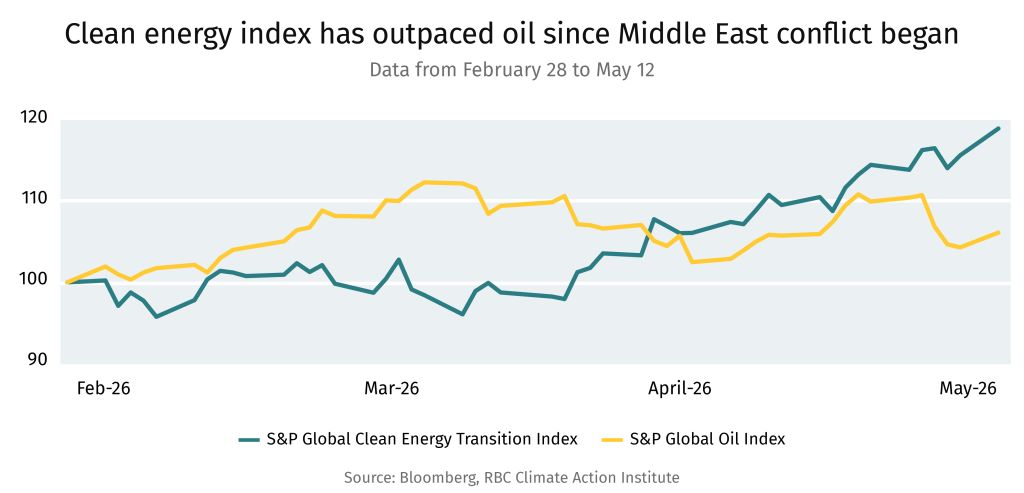
Clean energy index has outpaced oil since Middle East conflict began

Oil prices are spiking, but momentum rests with low-carbon stocks. Clean energy companies benefit from both elevated fossil fuel prices and accelerating renewable policy support on growing concerns over energy independence, Christopher Dendrinos, RBC Capital Market’s clean energy analyst, told us. This is particularly pronounced in oil-and-gas import-reliant Europe. While natural gas dominates the data centre space, renewables are also benefiting from rising demand to power AI. “The sector remains resilient going forward given the strong energy demand macro backdrop,” Dendrinos said.

Canada and Alberta’s landmark Implementation Agreement last week builds on the November 2025 Memorandum of Understanding that aimed to balance Canada’s economic and environmental goals.  However, the Implementation Agreement doesn’t stand alone. A day before, Carney had launched a National Electricity Strategy committing to double Canada’s grid capacity by 2050, with consultations now underway with provinces, territories, Indigenous Peoples, utilities, and unions. The strategy projects up to $15 billion in total energy savings and lower energy costs for 7 in 10 Canadian households. Natural gas retains a role for grid stability, nuclear and geothermal get explicit support, and the Clean Electricity Investment Tax Credit is being extended to intra-provincial transmission. A joint Alberta-Canada Electricity Working Group has been struck to advance the work.

Other stakeholders will now weigh in on the national electricity strategy, but the Alberta-MoU is much further ahead and poised for action. Energy Policy Lead Shaz Merwat breaks down its key highlights:

  • Carbon pricing in Alberta is locked in through 2040: Headline TIER (Technology Innovation and Emissions Reduction) prices: $95 today, $115 per tonne in 2030, $130 in 2035, $140 in 2040. The federal backstop will be updated to match — this is now effectively the national industrial carbon pricing framework.

  • A binding floor on TIER credits — for the first time: Starting at $60/t in 2030, rising to $110/t by 2040. Pre-MOU, TIER credits traded at roughly $20 against a $95 headline. The floor is the most consequential new mechanism in the deal.

  • 75 Mt of Carbon Contracts for Difference: Jointly issued 2030–2040, equally cost-shared, $600 million maximum liability per party ($1.2 billion aggregate). If either government walks back, that party assumes sole liability.

  • The West Coast pipeline has a defined timeline: Alberta submits to the Major Projects Office by July 1, with Ottawa designating it as a “project of national interest” under the Building Canada Act by October 1. The one million barrels per day pipeline to Asian markets could start construction by September 2027.

  • No Pathways, no pipeline. The two projects are explicitly mutually dependent. Pathways targets 16 Mtpa in total emissions reductions: 6 Mtpa by 2035, 5 Mtpa by 2040, 5 Mtpa by 2045. The trilateral MOU with the Oil Sands Alliance is still unsigned.

  • Sector-specific stringency rates. Large oil sands companies face 2% annual tightening of emissions intensity through to 2040 under revamped TIER, while Pathways operators see a tightening of just 1% from 2031 onwards.

  • Co-operation agreement on Impact Assessment. Two-year cap on impact assessments and federal deference to provincial processes where projects fall primarily within Alberta’s jurisdiction.

  • Indigenous economic participation centred across the framework. Co-ownership and equity partnership paths referenced repeatedly in today’s Implementation Agreement and the Co-operation Agreement on Impact Assessment.

  • The Co-operation agreement reflects intriguingly different working on UNDRIP. Canada maintains its commitment, while Alberta views UNDRIP as non-binding.

  • Climate targets remain intact. Both Alberta and Ottawa re-commit their target of net zero by 2050.

Taken together, the twin announcements represent a potential move towards creating the most comprehensive federal-provincial energy framework Canada has produced in a decade — covering carbon markets, carbon capture, storage and utilization, oil export infrastructure, and grid expansion simultaneously. The architecture is scoped, but execution will be key. The proxies to watch over the summer, in the lead-up to Ottawa’s Canada Investment Summit in September: a named pipeline proponent, the trilateral MOU with the Oil Sands Alliance, and the first material Indigenous consent agreement on the pipeline route.

  • Long-term uncertainty in global oil markets may ultimately accelerate the shift toward EVs as Canada strengthens domestic electricity generation, Victor Fedeli, Ontario’s Minister of Economic Development, Job Creation and Trade, told John Stackhouse at the Toronto Region Board of Trade Auto Event.

  • Agriculture Policy Lead Lisa Ashton on why Canada and other countries are embarking on a fertilizer emissions accounting overhaul. Read the brief here.

  • It’s hard to trace where critical minerals come from, weakening their environmental bona fides. Around 30-40% of the companies have a traceability system. The International Energy Agency says strengthening incentives for collecting and sharing data could be one of five ways to address the challenge.

  • Alberta’s “failure” to build new transmission could cost consumers in the province over a  quarter of a billion dollars annually through higher electricity bills, Will Noel, of the Pembina Institute, estimates.

  • Leah Stokes, a professor of environmental politics at the University of California-Santa Barbara, says the current U.S. administration’s push away from clean sources is costing each American household US$1,508 this year alone.

Curated by Yadullah Hussain, Managing Editor, RBC Climate Action Institute.

Climate Crunch would not be possible without John Stackhouse, Jordan Brennan, John Intini, Farhad PanahovLisa AshtonShaz MerwatVivan SorabCaprice Biasoni, Lavanya Kaleeswaran and Joelle Schonberg .

Have a comment, commendation, or umm, criticism? Write to me here (yadullahhussain@rbc.com)

Climate Crunch Newsletter

WP Menu

wp-menu

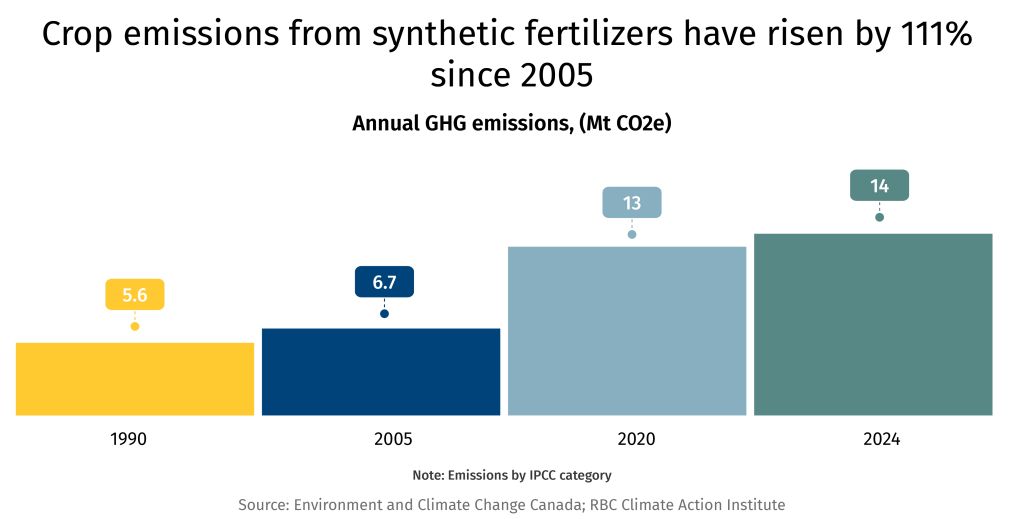
As Canadian farmers produce more per acre to feed a growing global population, fertilizer use has jumped 108% over the past two decades. That has come with an environmental impact: synthetic fertilizers now account for a quarter of the agriculture sector’s emissions in Canada.1 But the current emissions accounting system is flawed as it primarily focuses on the quantity used. What’s missing in the equation is farmer stewardship of fertilizer use to optimize placement, source and timing that help lower emissions.

Crop emissions from fertilizers have risen by 111% since 2005.

Source: Environment and Climate Change Canada and RBC Climate Action Institute

In an effort to optimize fertilizer use, the number of Canadian farmers with a nutrient stewardship plan has more than tripled over the past five years.2

Rising adoption rates are a sign of climate action. But it’s also an economic decision, especially as geopolitics continue to disrupt fertilizer supplies and raise prices. Nitrogen fertilizers have faced the brunt of supply chain shocks from geopolitical conflicts over the past five years as key producers include the Middle East and Russia. Nitrogen is also the primary driver of GHG emissions from fertilizer use. When nitrogen is not fully consumed by crops to grow, nitrogen can be emitted into the atmosphere as nitrous oxide (N2O) emissions, a GHG that is 273 times more potent than carbon dioxide over a 100-year time scale. When farmers adopt nutrient stewardship practices, GHG reductions can be substantial. An Ontario study, for example, found that when nitrogen fertilizer rates are optimized, and technology and practices that improve the source, timing and placement of fertilizer are adopted, N2O emissions can fall by up to 57%.

To capture in the accounting the full suite of practices, Canada, and other agriculture producing countries, including Australia, Denmark, New Zealand, Brazil and the U.S., are developing research and industry networks to collaboratively advance N2O measurement and monitoring systems.  

These research-driven networks have multiple lab-to-market applications, including those focused on:

  • Improving the understanding of how farmers’ practices impact N2O emissions, supporting investment decisions by farmers, industry and governments in nutrient stewardship

  • Building a suite of indicators that allow for more accurate tracking against GHG emission targets at the farm, regional and national scale

  • Refining the measuring, monitoring, reporting and verification (MMRV) protocols for carbon offsets and sustainability programs, improving the accounting of farmers’ climate actions to better connect them to market-based incentives and provide greater assurance to carbon credit buyers

Canada: A driving force in innovation of measurement and monitoring practices

Canada’s response to fertilizer-related N2O emissions has increasingly focused on improving measurement, coordination, and on-farm nitrogen management. A central initiative is the Canadian Nitrous Oxide Network (CanN2ONet), a collaborative research network involving universities, government agencies, farmer groups, and industry partners. The network was established shortly after Canada’s national target for reducing fertilizer-related N2O emissions by 30% by 2030 was announced in 2020—a policy with notable industry push back that has since faded in sector discourse.

CanN2ONet operates a series of long-term monitoring sites across Alberta, Saskatchewan, Manitoba, and Ontario. These sites use micrometeorological techniques to continuously measure N₂O emissions from agricultural fields under different climates, soil conditions, and management systems. The network also addresses a long-standing challenge in agricultural climate policy: accurately measuring emissions at field scale. Traditional national GHG inventories often rely on generalized assumptions that do not fully capture local soil and weather conditions.

Denmark: An ambitious vision for meeting GHG targets

Denmark’s SmartField initiative represents one of Europe’s most advanced efforts to reduce agricultural N2O through data-driven and field-scale innovation. Led by the Danish Technological Institute and funded by the Novo Nordisk Foundation, SmartField aims to cut N2O emissions from Danish agriculture by as much as 30% by 2030 without reducing yields or increasing other forms of nitrogen pollution. 

Canada and Denmark-based researchers are advising one another as both CanN2ONet and SmartField focus on building a national testing and validation platform for emission-reduction technologies and farming practices. The SmartField project combines stationary “supersites,” mobile measurement systems, advanced sensors, and modelling tools to monitor how fertilizers behave in real farming conditions. These facilities generate detailed datasets on nitrogen cycling, soil biology, crop performance, and greenhouse gas emissions. 

One of the initiative’s features is the integration of science, policy, and implementation. SmartField brings together universities, government agencies, agricultural organizations, and private-sector stakeholders to accelerate the adoption of low-emission farming practices.

New Zealand: Balancing rural economic growth and GHG trajectories

Agriculture accounts for roughly half of the country’s GHG emissions. Cattle manure from livestock and fertilization of grasslands for animal feed are the main culprits of N2O emissions. The agricultural sector is also the largest contributor to export revenue, accounting for 70% of merchandise exports, with agricultural production alone contributing 5% to the country’s GDP.

New Zealand’s approach to managing its large agriculture environmental and economic footprint has evolved over the past five years with an initially strong prioritization on GHG reductions aligned with legislated net-zero targets. Through industry engagement, the focus has shifted towards innovation and scaling practices and technologies that present win-wins in productivity and emissions reduction. A government-led, centralized approach to advancing N2O emissions accounting has been driven by the country’s Ag Emissions Centre and rolls into New Zealand’s broader ambitions to mitigate GHG emissions from agriculture.