

 EN
EN 


For the week of July 27th
Another month of recovery is in the cards for Canada’s economy next Friday where we expect to see a 0.2% increase in GDP data for May (more details below), but the outlook is once again clouded by the latest bout of U.S. tariff threats that suggest the path ahead could be bumpier.
Just how bumpy is challenging to clearly assess. For one, we’re keenly aware that tariffs threatened in the past have often been significantly modified or halted ahead of the implementation date. New U.S. Section 301 (broader global) tariffs imposed on July 24 maintain a duty free exemption for imports from Canada under CUSMA, and the more severe 50% Section 338 product- and Canada-specific tariffs don’t take effect until 30 days after signing.
Secondly, as we emphasized back in February 2025, the economic impact will depend on a wide range of factors from how firms creatively navigate tariffs, the path of the Canadian dollar to government responses and the Bank of Canada’s decisions.
That said, there are six early thoughts from the developments of this week.
1. Big picture: Canada should be able to manage through new wave of potential tariffs
Ultimately, we don’t expect the recently announced 50% U.S. tariffs to significantly change broader Canadian growth trends if imposed as threatened. We still expect aggregate growth to improve in the second half of the year, and the unemployment rate to trend downwards.
In large part, that’s because the new tariffs, while significant, will still impact a small segment of total trade. They affect about 5% of Canada’s exports to the U.S, which would still leave more than 80% of exports crossing the border duty free. The average effective tariff rate on U.S. imports from Canada would rise from around 3% to 5.5%, still below but closer to other major U.S. trade partners like Europe and the U.K. (6%-7%).
2. Targeted sectors would struggle
The overall economy should hold, but targeted sectors related to plastics, electrical machinery, furniture and home appliance manufacturing are likely to experience slowdowns, just like after the Section 232 tariffs on products including autos and steel that have created sectoral downturns.
However, this time around, it will be easier for American importers to substitute away from many of these newly tariffed Canadian goods as they make up a small source of U.S. imports. About 3.7% of total U.S. imports of those products from the world in 2025 came from Canada, according to our estimates.
That’s different than tariffs on, say, aluminum where Canada made up the majority of U.S. imports, and American importers don’t have alternative suppliers or the capacity/infrastructure to domestically produce the good. Importantly, the pain on a sector from a tariff depends on how easy it is for the American importer to substitute from Canada, and that varies significantly by product.
Finally, substitution won’t be nearly as easy for Canadian exporters looking for alternative foreign markets. In 2025, we counted 81% of Canada’s exports of tariffed products went to the U.S. with certain sectors showing even tighter dependence (e.g. plastics and articles at 92%). Trade diversification remains a more elusive goal for Canada that will take considerable time to achieve.
3. New tariffs would further exacerbate provincial divergences
Previous tariffs on auto, steel, and lumber products disproportionally impacted Ontario, Quebec, and British Columbia. Energy producing provinces have been less impacted by the trade war as they continue to be excluded from tariff shocks, and have seen economy-wide revenues rise in 2026 with global oil prices moving higher.
The average effective tariff rate estimates are based on calculated duties and total imports reported by the U.S. Census Bureau for Canadian goods based on the May 2026 trade profile. Effective tariff rates are calculated at the HS6 product level and applied to provincial domestic exports to the U.S. at the same level, giving an estimate of the average effective rate provincial exporters could face. Products affected by the new Section 338 tariffs were set at a 50% tariff rate, while the tariff rates for products duplicated under Section 232 were not adjusted.
These estimates come with important caveats. First, actual tariffs paid may be lower than announced rates due to processing delays and exclusions. Second, applying uniform HS6-level rates across all products at lower classification levels may overestimate effective tariff rates, since some products within each HS6 category may not be directly targeted by U.S. tariffs. Lastly, some tariffed products may not have been traded in May 2026, potentially understating the actual effective tariff rates. Overall, these estimates sum to an average increase of 2.88% in Canada’s tariff rate from Section 338 measures, slightly above but very close to the 2.5% increase estimated for the whole economy using 8-digit HTS.
The new set of tariffs will further exacerbate the energy versus non-energy growth divergence in Canada. Exporting businesses in B.C., Ontario, and Quebec would likely bear the brunt with each possibly facing a significant rise in average effective tariffs on exports to the U.S.
4. Domestic demand for tariffed goods could provide partial offset
Targeted sectors would likely see a drop in U.S. demand as American importers opt for lower-cost countries, but domestic demand in Canada for these products can provide meaningful offset.
Importantly, manufacturing subsectors facing Section 338 tariffs generally derive larger shares of production and employment from domestic demand compared to auto and metal manufacturing targeted in previous rounds of U.S. Section 232 tariffs that rely more on U.S. demand.
Plastics product manufacturing, which accounts for the largest nominal dollar value of at-risk exports in the latest measures, derived roughly half their value added and employment from U.S. demand in 2024. It’s still significant, but well below the nearly 80% dependence in auto manufacturing and aluminum production.
For soft drink manufacturers, breweries, wineries and distilleries, the share of value added, and jobs tied to U.S. demand is lower at about 15%. A higher domestic market share should provide better insulation for production and jobs in these industries from volatile U.S. trade policy and demand.
5. BoC even more likely to hold interest rates this year
The BoC has repeatedly emphasized it’s facing a dilemma—caught potentially between the need to lower interest rates to support a tariff laden economy, and the need to raise interest rates to keep inflation at bay with conflict in the Middle East again pushing up oil prices. Both risks are meaningfully coming back in play as July winds up.
As a base case forecast, we continue to expect the BoC will hold the overnight rate at current levels through the end of the year, while closely monitoring incoming data on inflation expectations and business sentiment.
6. Business sentiment needs to be monitored
The threat of tariffs even if they are walked back before the Aug. 20 deadline will once again add to uncertainty for businesses, and that can slow business investment across all trade-exposed businesses, not just those directly impacted.
Business sentiment has already been weakening in Q2, according to the BoC’s Business Outlook Survey and CFIB Business Barometer. As we’ve covered before, there won’t be a persistent re-acceleration in Canadian productivity growth without business investment coming online.
Canada’s economy likely grew for a second month in May
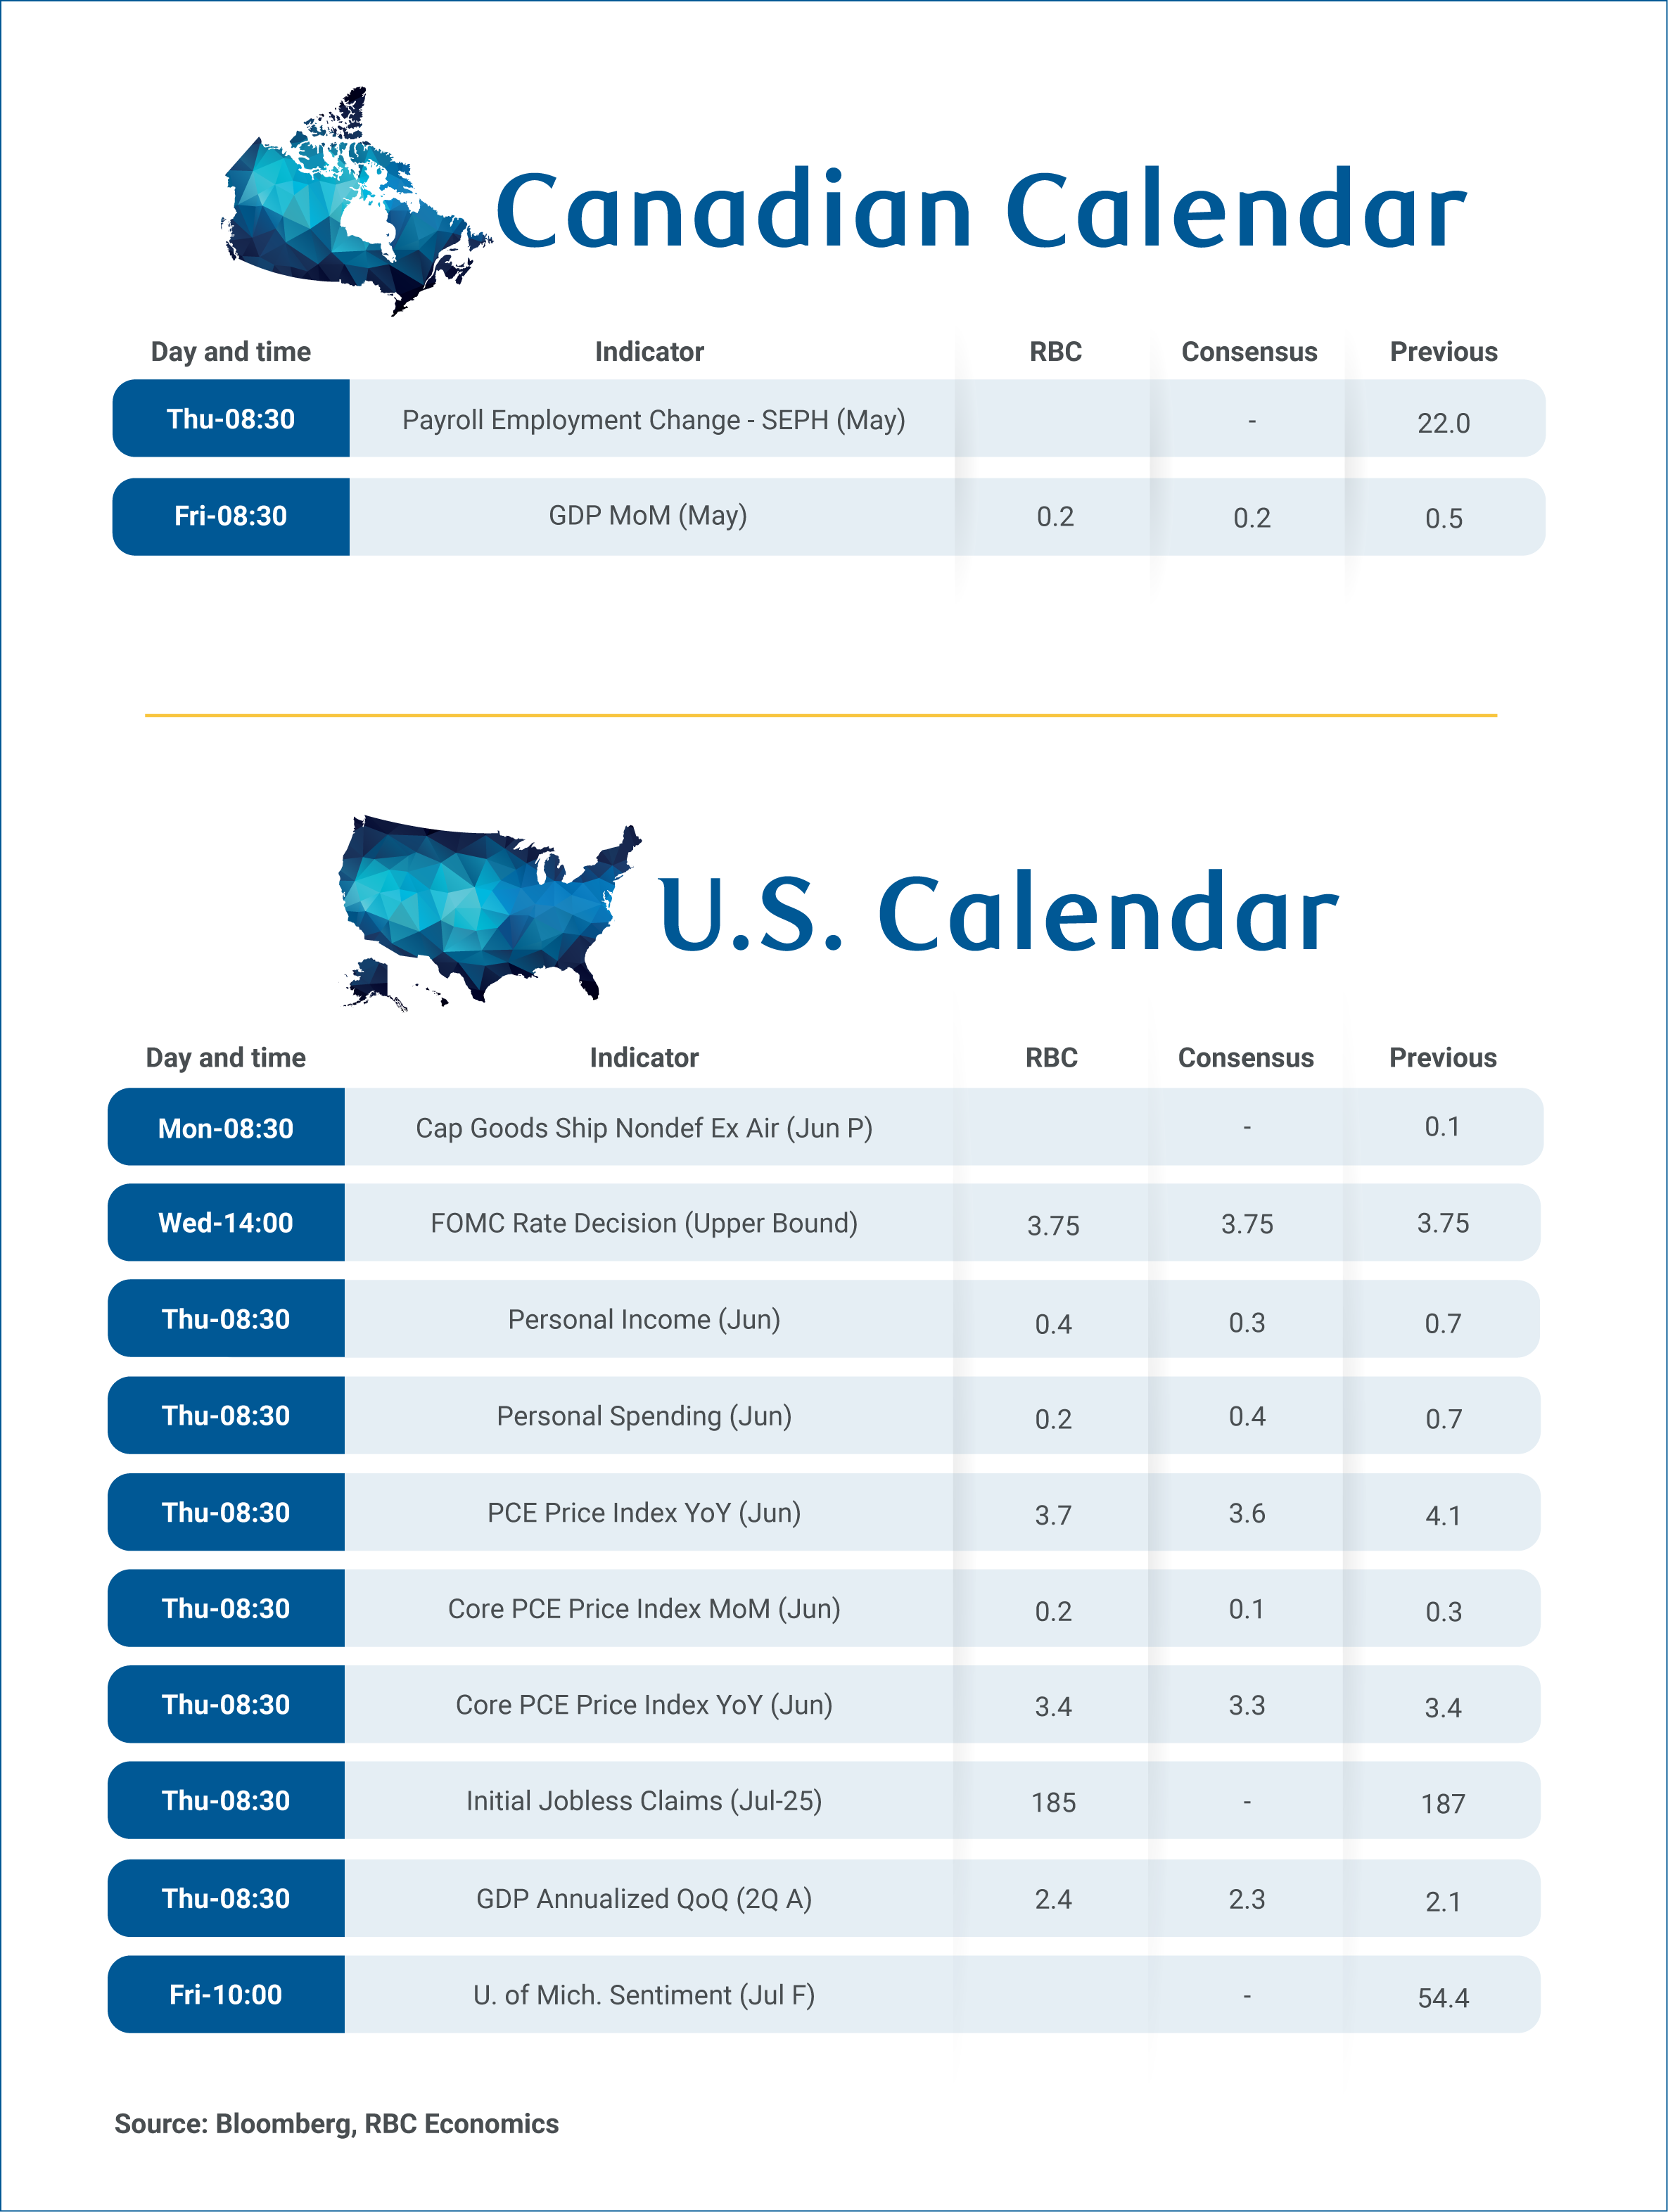
Next Friday, we expect Canada’s real gross domestic product expanded by 0.2% in May, building on a robust 0.5% gain in April driven by a rebound in mining, oil and gas extraction.
This exceeds Statistics Canada’s preliminary estimate of 0.1% and has upside risk, given the broad-based strength we observed across industries. Oil and gas extraction and support activities along with manufacturing and retail are all likely to have contributed to growth in May, based on early industry data.
Real estate, rental and leasing likely recorded a fourth consecutive month of gains as housing activities continue to heat up over the summer.
The annualized quarterly GDP growth aligns with the BoC’s July forecast of 2.5% and tracks slightly above our Q2 estimate of 2.2%.
-
We expect the Federal Reserve will stay on hold in Wednesday’s meeting. June’ Consumer Price Index report showed broad-based deceleration in inflation pressures—a turn from the run of hotter core CPI prints to take an immediate rate hike off the table. Still, the path forward remains highly uncertain, and entirely contingent on future inflation data while labour market resilience persists.
-
On Thursday, we’ll receive the advance Q2 U.S. GDP report, where headline growth is expected to come at an annualized 2.4% quarter-over-quarter. Much of this growth has been supported by resilient consumer spending, which is expected to accelerate to 2%. Business fixed investment likely expanded, offset by net trade that is projected to have subtracted from growth.
Download report
About the authors:
Frances Donald is the Chief Economist at RBC and oversees a team of leading professionals, who deliver economic analyses and insights to inform RBC clients around the globe. Frances is a key expert on economic issues and is highly sought after by clients, government leaders, policy makers, and media in the U.S. and Canada.
Nathan Janzen is an Assistant Chief Economist, leading the macroeconomic analysis group. His focus is on analysis and forecasting macroeconomic developments in Canada and the United States.
Claire Fan is a Senior Economist at RBC. She focuses on macroeconomic analysis and is responsible for projecting key indicators including GDP, employment and inflation for Canada and the US.
Salim Zanzana is an economist at RBC. He focuses on emerging macroeconomic issues, ranging from trends in the labour market to shifts in the longer-term structural growth of Canada and other global economies.
Explore the latest from RBC Economics:
-
September Executive Briefing: What to watch in the final quarter of 2026
-
Revised numbers point to positive population growth in Canada
-
How much housing demand in the US still lives at home?
-
How to monitor the persistent tightness in the US labor market
-
FOMC recap: Tightening into an inflationary supply shock
-
Road to recovery for Canada’s housing market hits a bump in August
-
Spending across the board drove Canadian purchases in August
-
Canada’s economy gains ground despite trade and energy headwinds
-
Canadian inflation holds at 3% in August as underlying pressures remain contained
-
BoC and Fed to hike from different starting points
Share these insights with your network:
This article is intended as general information only and is not to be relied upon as constituting legal, financial or other professional advice. The reader is solely liable for any use of the information contained in this document and Royal Bank of Canada (“RBC”) nor any of its affiliates nor any of their respective directors, officers, employees or agents shall be held responsible for any direct or indirect damages arising from the use of this document by the reader. A professional advisor should be consulted regarding your specific situation. Information presented is believed to be factual and up-to-date but we do not guarantee its accuracy and it should not be regarded as a complete analysis of the subjects discussed. All expressions of opinion reflect the judgment of the authors as of the date of publication and are subject to change. No endorsement of any third parties or their advice, opinions, information, products or services is expressly given or implied by Royal Bank of Canada or any of its affiliates.
This document may contain forward-looking statements within the meaning of certain securities laws, which are subject to RBC’s caution regarding forward-looking statements. ESG (including climate) metrics, data and other information contained on this website are or may be based on assumptions, estimates and judgements. For cautionary statements relating to the information on this website, refer to the “Caution regarding forward-looking statements” and the “Important notice regarding this document” sections in our latest climate report or sustainability report, available at: https://www.rbc.com/community-social-impact/reporting-performance/index.html. Except as required by law, none of RBC nor any of its affiliates undertake to update any information in this document.

