

 EN
EN 


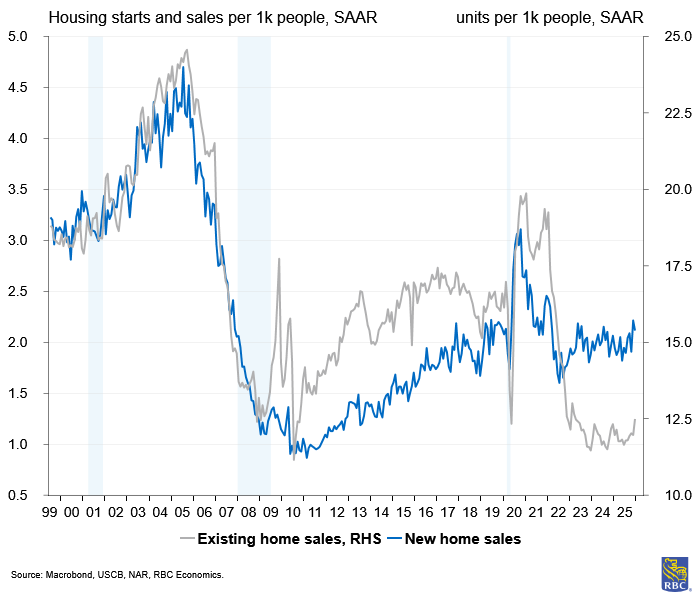
For decades, the housing market served as America’s economic bellwether—a leading indicator that signaled where the broader economy was headed and a powerful engine of growth. But since 2022, housing has undergone a quiet demotion.
It has consistently dragged on gross domestic product growth, and it no longer meaningfully moves the dial on an economic cycle now dominated by an AI buildout and high-end consumer.
The conventional explanation is straightforward: Stuck supply and interest rates have kept affordability weak and prices elevated, pricing out buyers and dampening demand.
But, there’s another factor at play—a demographic wildcard that deserves closer attention. Millions of priced out young adults, who have weathered a surprisingly tough entry-level job market, are stuck living at home with their parents. Could their eventual move into independent households unlock a hidden reserve of housing demand?
To assess this tailwind, we tapped the U.S. Census Bureau’s American Community Survey (ACS) to estimate how much additional housing demand could come from young adults living with their parents as they move out and form independent households. We identify three key points:
-
A normalization in the living-at-home rate could unlock roughly 675,000 units of incremental housing demand—meaningful—but not a silver bullet for this cycle.
-
Demand is positioned to flow into the rental market disproportionately, good news for a rental market sitting at 7.3% vacancy rate.
-
Affordability and labor conditions, not demographic shifts like delayed marriage, are limiting household formation.
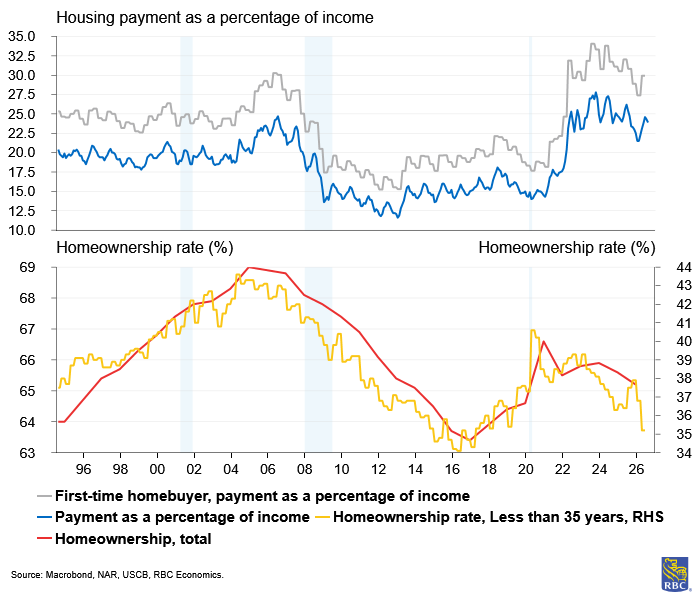
Housing remains in a deep freeze due to affordability constraints
Household formation can offer incremental demand for rentals
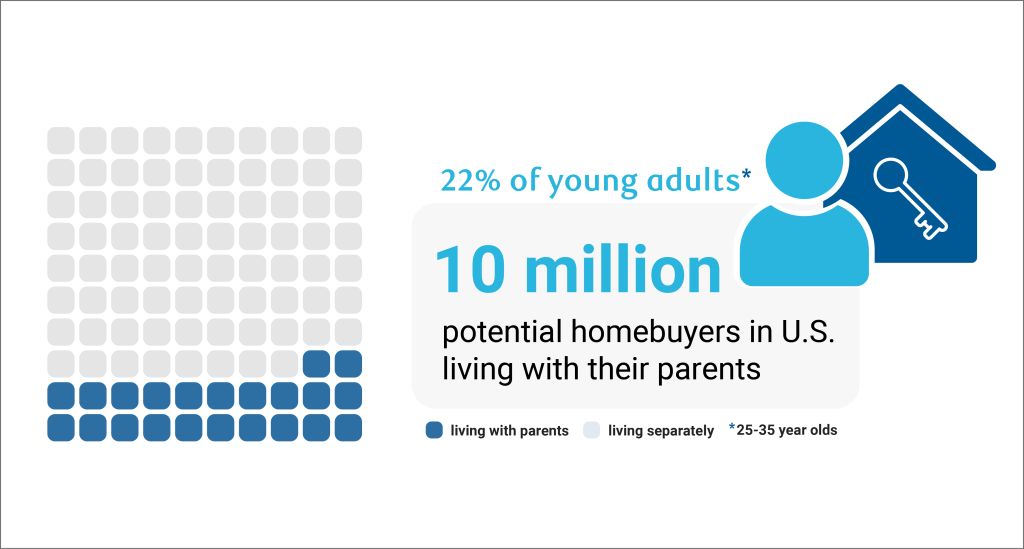
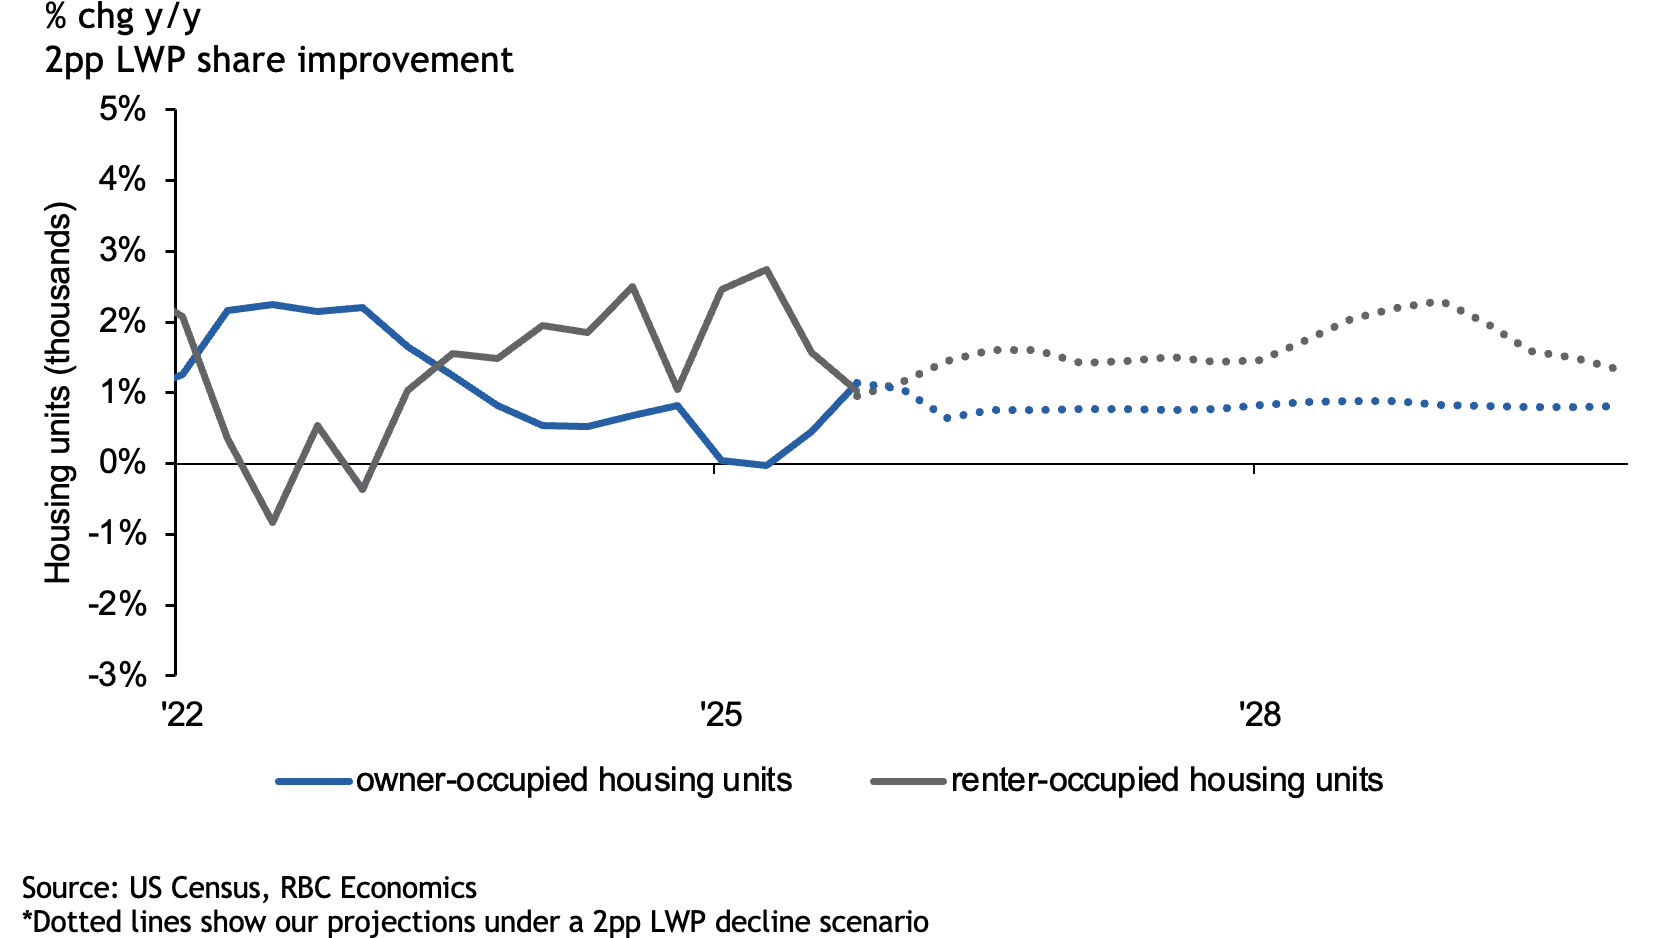
Emerging household formation is disproportionately likely to flow into rental housing unless financing conditions change, according to our analysis.
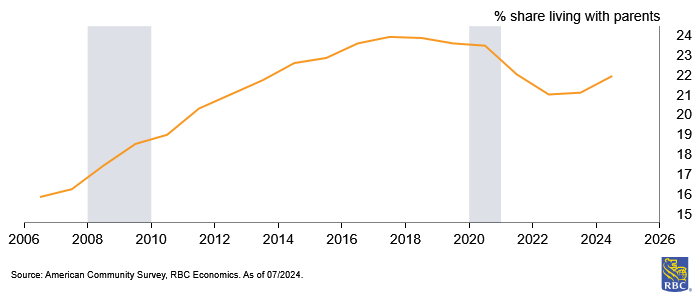
We estimate about 22% of young adults (aged 25-35) reported living with a parent, grandparent, or parent-in-law in 2025 (we refer to this group collectively as LWP). This share is below the pre-pandemic peak of nearly 24% but is still slightly above that of the past five years, and notably above the early 2000s.
Living-with-parents share has retreated from 2017 peak
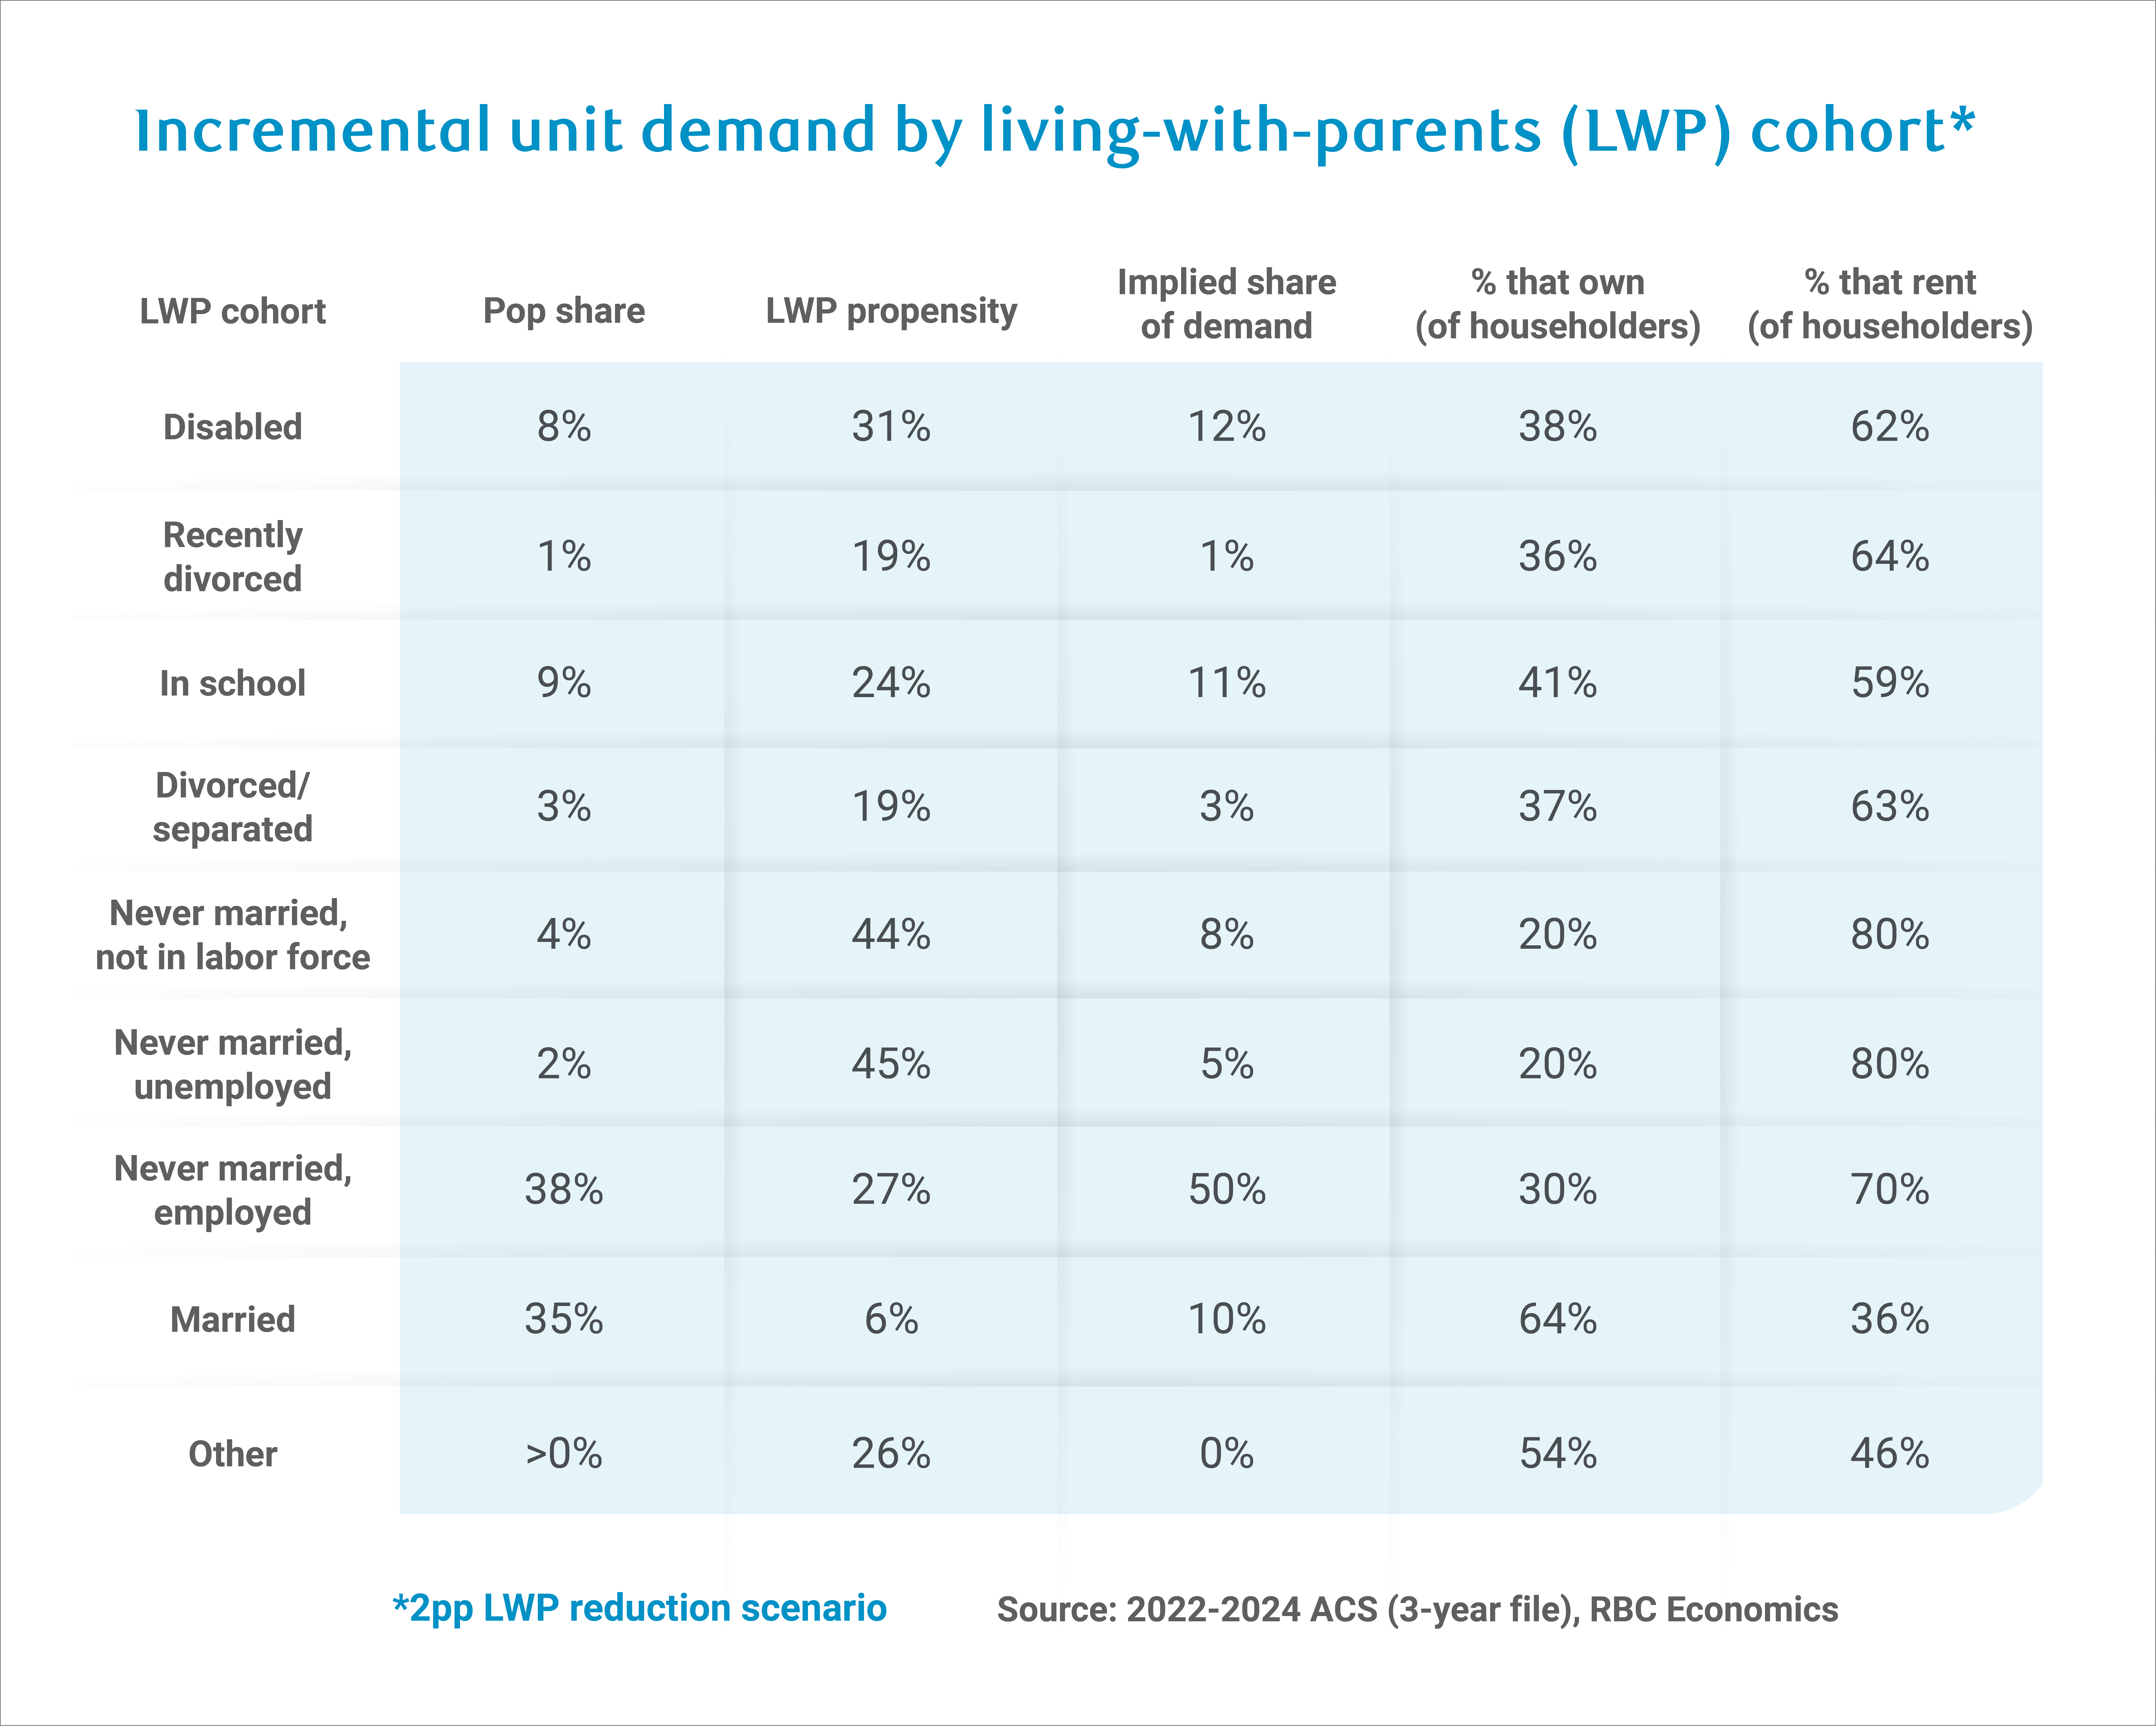
A 22% share of young adults living with parents represents roughly 10 million people who could buy or rent a new home. If the entry level labor market normalizes enough to pull that share down by just 2 percentage points, we estimate roughly 675,000 units of incremental housing demand.
Applying each group’s observed preferences from the ACS implies an overall 66/34 rent-to-own split in this additional demand—more renter heavy than recent aggregate household growth. Owner-occupied households accounted for roughly 63% of annual net new households (867,000 new owner households versus 497,000 new renter ones) on average in the past four quarters.
Critically, the rental market can absorb this demand. Elevated multifamily completions from the 2021-2022 construction boom pushed vacancy rates to 7.3%—the highest since 2019—and rent growth has decelerated from its peak in 2023.
Affordability and labor conditions are key constraints on forming households
We place more weight on the aggregate affordability and labor market story as an indicator for housing demand, and expect the homeownership rate for young adults will remain near current levels as renter-occupied households outpace owner-occupied formation in the near term, because of affordability hurdles. Here are three reasons why:
-
Mortgage rates have risen precipitously: From a record-low 2.96% average in 2021 to more than 7% briefly in late 2023—the highest reading since 2000—before settling into a mid-6% range for the past several years.
-
Rents have run well ahead of paychecks: Housing costs are up roughly 36% since 2019, while median usual weekly earnings among 25 to 34-year-olds rose 35%. While both owning and renting have only slightly outpaced young adult paychecks, the added expense of homeownership adds another layer of costs that continues to outpace earnings (e.g., home insurance (up 62%) and lawn service up 67% since 2019).
-
The entry-level job market has quietly become a sizable drag: Unemployment for recent college graduates (aged 22-27) has run well above 5% through 2026 compared to 4.1% currently for the overall workforce. This is a historically unusual flip since new graduates have typically outperformed the broader labor market.
Mortgage affordability remains stretched by historical standards
Fewer young adults living with parents more likely to boost rental demand
Shifting lifestyles explain far less than financial conditions
Our breakdown of the living-at-home rate reveals that affordability and labor conditions—not shifting demographics—are the dominant drivers of household formation among 25-35-year-olds.
We analyzed the data by subgroups: People with disabilities, recently divorced, enrolled in school, never married and not in the labor force, never married and unemployed, and never married and employed.
To understand what could motivate young adults to form households, we decomposed the movements of the living-at-home rate into composition versus propensity. Put simply, composition asks whether more young adults belong to groups that tend to live at home (i.e., population growth of the cohort), while propensity asks whether each group has become more likely to stay, regardless of how large it is.
Propensity increases across all subgroups contributed 71% of the total weakness between 2006-2019, amounting to roughly 3.5 times the compositional contributions, and more than the entire net improvement from 2019-2024 (since composition was still pulling upwards). Given that the increases in propensity are broad based and not selective, factors like affordability and financing can be seen as the dominant drivers.
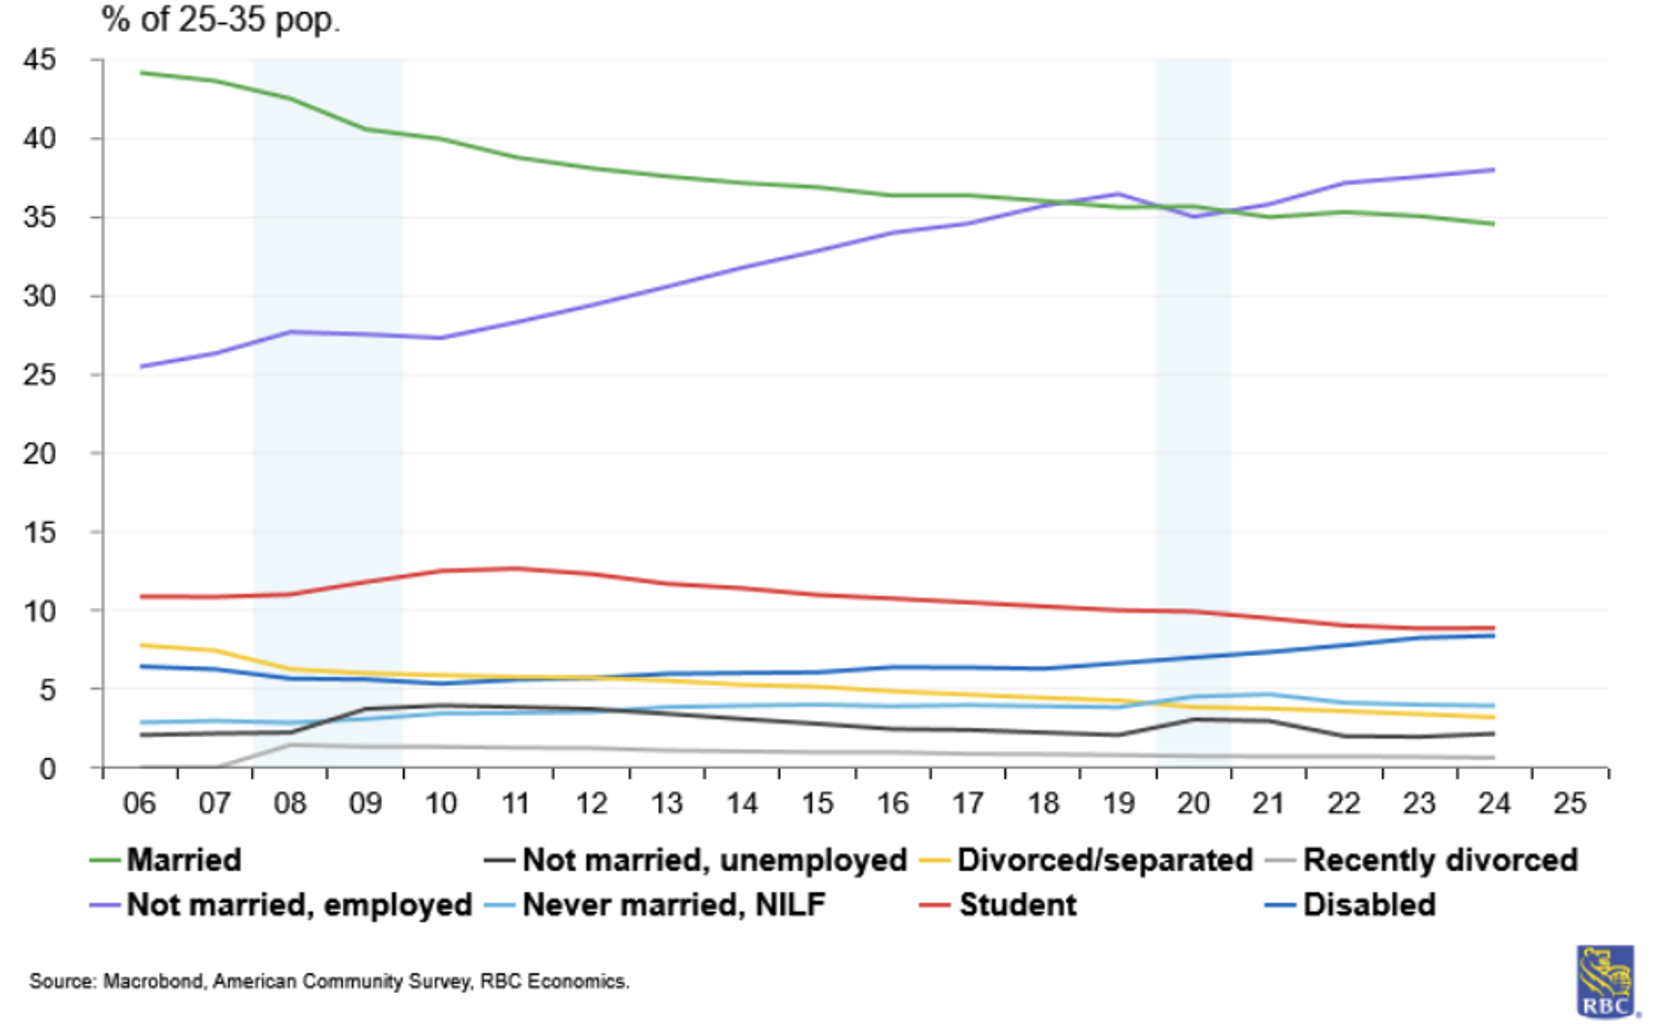
Shifting lifestyles also don’t appear to be strongly responsible for changing household formation trends. For example, unmarried employed adults are typically about five times as likely as married adults to live with their parents, and unmarried unemployed adults are typically around eight times as likely. That means a population shifting away from marriage will mechanically obtain a higher living-with-parents rate, bringing down demand for housing.
Recently, delayed marriage has been the most prominent compositional story in this group. Unmarried employed adults grew from about 25% to 38% of the 25-35-year-old population between 2006 and 2024, making them the largest single group. Meanwhile, the married share fell from 44% to less than 35%.
Shifts do amplify the influence of a group’s likelihood of living at home. But, while these compositional changes are notable and contribute to the direction, we find that the reshuffling of the population is a more modest contributor to household formation.
Never married employed adults are now the largest share of young adults
About the authors:
Mike Reid is Head of US Economics at RBC. He is responsible for generating RBC’s US economic outlook, providing commentary on macro indicators, and producing written analysis around the economic backdrop.
Carrie Freestone is a Senior US Economist at RBC. She is responsible for generating RBC’s US economic forecasts across GDP, employment, and inflation, and providing macro commentary through publications, presentations, and the media.
Imri Haggin is an US Economist at RBC, where he focuses on thematic research. His prior work has centered on consumer credit dynamics and treasury modeling, with an emphasis on leveraging data to understand behavior.
This article is intended as general information only and is not to be relied upon as constituting legal, financial or other professional advice. The reader is solely liable for any use of the information contained in this document and Royal Bank of Canada (“RBC”) nor any of its affiliates nor any of their respective directors, officers, employees or agents shall be held responsible for any direct or indirect damages arising from the use of this document by the reader. A professional advisor should be consulted regarding your specific situation. Information presented is believed to be factual and up-to-date but we do not guarantee its accuracy and it should not be regarded as a complete analysis of the subjects discussed. All expressions of opinion reflect the judgment of the authors as of the date of publication and are subject to change. No endorsement of any third parties or their advice, opinions, information, products or services is expressly given or implied by Royal Bank of Canada or any of its affiliates.
This document may contain forward-looking statements within the meaning of certain securities laws, which are subject to RBC’s caution regarding forward-looking statements. ESG (including climate) metrics, data and other information contained on this website are or may be based on assumptions, estimates and judgements. For cautionary statements relating to the information on this website, refer to the “Caution regarding forward-looking statements” and the “Important notice regarding this document” sections in our latest climate report or sustainability report, available at: https://www.rbc.com/community-social-impact/reporting-performance/index.html. Except as required by law, none of RBC nor any of its affiliates undertake to update any information in this document.

