Metal Wars: Five things to watch for as U.S. steel and aluminum tariffs roll out
Author: Shaz Merwat
Shaz Merwat brings over 13 years of capital markets research experience within the Canadian oil and gas sector and as an Equity Strategist covering a broad range of fundamental macroeconomic issues. He was also a top ranked sustainability/ESG analyst, with his work often cited in global media. Merwat holds Masters degrees from Western University, the London School of Economics and Erasmus University Rotterdam.
The U.S.-Canada trade war has kicked off, with Canadian steel and aluminum exports, valued at $24 billion annually1, set to be tariffed at 25% starting today. We highlight five themes to watch for as the two economies brace for the fallout from these levies:
1. The tariffs are unlikely to reinvigorate U.S. production
The first iteration of Section 232 tariffs in 2018, triggered by U.S. national security concerns, did not meaningfully expand American steel and aluminum production capacity (production increased 7% and 4%, respectively)2. This scenario will likely repeat itself. The U.S. steel industry is impeded by a far bigger challenge as China floods global steel markets with excess production capacity, ultimately hindering U.S. producers’ ability to boost domestic output. This global oversupply reached 560 million tonnes (6x U.S. consumption) in 2024, with a further 157 million tonnes of carbon-intensive capacity additions set to come online by 2026, mostly from Asian countries3.
Since Section 232 tariffs were introduced, overall U.S. imports (by weight) have fallen 15% for steel and 13% for aluminum compared to 2018. U.S. net steel imports remain at 13% of domestic consumption, while aluminum net imports are structurally higher at 47% of consumption. However, total U.S. consumption of both metals has fallen about 10% since 2018, which helps explain why import dependence hasn’t dropped as much as the raw numbers suggest4.
This is evident in Tables 1 and 2.
Table 1: U.S. steel consumption and net imports are stagnant
Source: U.S. Geological Survey, RBC Thought Leadership
Table 2: U.S. remains heavily reliant on imported aluminum
Source: U.S. Geological Survey, RBC Thought Leadership
2. The devil is in the details on China’s access to U.S.
Defining “steel” is no easy task, given the hundreds of tariff line items within both Harmonized System (HS) codes 72 that covers iron and steel, and 73 which accounts for articles of iron and steel. HS codes classify products for international trade, making customs and regulations easier. The U.S. has largely succeeded in shutting Chinese “steel” out of its market (as defined in HS Code 72), as they account for only US$490 million of steel imports in 2024, or about 1.6% of total imports5.
However, Chinese steel exports to Mexico and Canada are over three times higher, at an estimated $1.7 billion (aggregate) in 2024, or 8% of each countries’ total imports6. That figure is trending upwards, having more than doubled since 2017. Including Chinese proxies (Vietnam, Thailand, Indonesia, among others), total Chinese and “back door” exports from proxies to Mexico and Canada likely surpassed US$2.5 billion. Understandably, the U.S. has voiced its concerns to both countries.
Still, this ‘concern’ is dwarfed by the reality the U.S. directly imports U$14 billion worth of steel and steel products (HS Codes 72 and 73 combined) directly from China, or a quarter of its total imports of steel and steel products7. In comparison, Chinese steel and steel products account for only 10% of Canadian and Mexican imports, respectively8.
When viewed in aggregate, U.S. national security has materially improved with allies such as Canada, Japan, South Korea and Mexico having raised their steel and aluminum shipments to America over the past six years—at China’s expense. Specifically, total U.S. steel and aluminum imports from the exempted countries increased in dollar value from 51% in 2018 to 57% by 2024, with a corresponding decline from 44% to 36% for China and its ‘backyard’—a net swing of +14% (see Table 3)9.
Table 3: Allies boosted their market share in the U.S. at China’s expense
Source: U.S. International Trade Commission, RBC Thought Leadership
3. For all the China talk, Canada has become target number one
From a fundamental market standpoint, Canada’s exports of steel and aluminum to the U.S. have increased by 35% to US$17.7 billion since 2018. That pace of growth is greater than the global average, with the most recent years far surpassing historical Canadian growth rates. As a result, Canada’s steel and aluminum trade surplus with the U.S. has more than doubled from 2018 to more than US$9 billion last year10.
However, Mexico and Vietnam both added more to their exports during the same period both on an absolute basis (US$11.8 and US$4.9 billion, respectively) and relative basis (+62% and +410%)11. The surge in Vietnamese volumes would be of particular concern to the U.S. administration—perhaps warranting a higher tariff rate. But the tit-for-tat nature of trade wars has manifested with Canada often targeted – perhaps beyond the realities of fundamental market conditions.
Lastly, and specific to Canada, it is worth noting the U.S. also has concerns on Luxembourg-headquartered ArcelorMittal’ substantial Canadian presence, likely accounting for half of total Canadian steel production. The firm has also established a strategic partnership with China Oriental Group, and is a 37% shareholder in the firm.
4. Exemptions for Canada will be hard to come by
While there is always the likelihood Trump eventually gives Canada a tariff reprieve, it remains unlikely.
Firstly, Canada’s hardening stance and tit-for-tat tariffs is creating a challenging negotiating environment. Secondly, Corporate America is unlikely to go to bat for Canada given these tariffs are sector-specific and comparatively far less economically disruptive compared to blanket tariffs.
Lastly, we have been here before: It was not until the signing of USMCA in May 2019 when Section 232 tariffs on Canada were lifted, fourteen months after they took effect.
While Canadian products may still secure an exemption if they are deemed to be ‘un-substitutable,’ it is difficult to substantiate this from the data. For steel, the U.S. is only 13% net-import reliant. Also, the end-use of Canadian steel domestically is broad-based: general manufacturing (40%), autos (20%), oil and gas (15%) and general construction (10%)12. It is unlikely that Canadian steel is consumed in the U.S. for strategic purposes that are hard to substitute. Canadian aluminum may have better luck, given Canada represents 75% of U.S. primary aluminum imports13.
5. The best chance for success is to offer concessions
The clock is now ticking for Canada and the U.S.’s other trade partners. Over the next three weeks, the Trump administration will seek concessions in the run-up to April 2, the effective date for both reciprocal global tariffs and expiry of Canada and Mexico’s broad-based 25% tariff.
In the past, South Korea ‘voluntarily’ agreed to restrict exports under a quota system, which granted them Section 232 steel and aluminum exclusions. Japan entered into bilateral trade negotiations to avoid potential tariffs on autos. Canada and Mexico held out until USMCA was signed in mid-2019. Future success could only come with meaningful concessions to the U.S.
Perhaps one promising sign is that Canada is set for new political leadership, whether it be Liberal leader Mark Carney or Conservative leader Pierre Poilievre. Both present an opportunity to ‘reset’ a personal relationship with the U.S. President. This could also be a catalyst to engage in USMCA renegotiations, following a similar playbook, and appease an increasingly hawkish (and unpredictable) Trump administration.
U.S. International Trade Commission (DataWeb), U.S. Federal Register
U.S. Geological Survey Mineral Commodity Summaries 2025
European Steel Association (Eurofer), OECD, U.S. Geological Survey
U.S. Geological Survey Mineral Commodity Summaries 2025
U.S. International Trade Commission (DataWeb)
Innovation, Science and Economic Development Canada, UN Comtrade
U.S. International Trade Commission (DataWeb)
Innovation, Science and Economic Development Canada, UN Comtrade
U.S. International Trade Commission (DataWeb)
Ibid
Ibid
Statistics Canada, Symmetric input-output tables
Aluminum Association of Canada
Key takeaways
Canada and the U.S. are each other’s largest minerals trading partner, amounting to $146 billion in bilateral trade1.
The U.S. is 100% import reliant for 12 of its identified list of 50 critical minerals, and net import reliant (>50%) for 29 of those critical minerals2.
China is the primary foreign source for a quarter of the U.S.‘s critical minerals3.
Disruptions to the supply of critical minerals could cause material damage to the U.S. economy. One example: a 30% supply restriction of gallium could cause a $600 billion (U.S.) decline in U.S. GDP4.
Defense procurement is an underutilized source of financing for key defence critical minerals, particularly graphite, tungsten, scandium, and gallium.
Bedrocks of a Fourth Industrial Revolution
Minerals are the bedrock of any industrial economy. From steel to copper to aluminum, they lay the foundation of economic, civil, and defence infrastructure. And increasingly, a growing cohort of minerals underlie the critical components of the so-called Fourth Industrial Revolution — an era of disruptive technological forces driven by human-machine interaction across research, manufacturing and an ever-expanding data economy.
In this new age, the demand for that cohort of “critical minerals” will be driven by a growing use of semiconductors and data processing machines, increased adoption of battery technologies and new energy sources, and advancements in defence and aerospace technologies. For Canada, the race to develop and process these minerals is about much more than the mining sector; it underscores a new security paradigm to protect and enhance our economic and national interests in an evolving world order. Here’s some of what’s at stake:
Semiconductors
The early days of generative AI are showing how much more computing power we will need. Global semiconductor sales are on pace to reach $1 trillion (U.S.) by 2030, with high-powered artificial intelligence (AI) chips likely accounting for the majority of sales5. To date, silicon has been the material of choice but AI is testing silicon’s thermal limits. Gallium nitrade’s (GaN) superior conductivity results in over 30% improvements in wafer power efficiency6. Palladium, arsenic, copper, and cobalt are also used in chip fabrication (plating, wiring).
Batteries
Whether it’s for EVs on the road, energy efficiency at home or long-duration storage at power generation sites, we’ll need a lot more battery technology in the years ahead. An EV battery requires an average of 205 kilograms of critical minerals (or six times that of an internal combustion engine), comprised of lithium, cobalt, nickel, graphite and manganese7. Based on Bloomberg New Energy Finance’s Economic Transition Scenario, we estimate North American battery minerals demand (transport and utility storage) is likely to increase between four to five-fold by 2040, relative to today8.
Frontier energy
We’re likely to see more oil and gas consumption over the next decade in North America, but we also will see much more growth in newer energy sources, including small modular nuclear reactors, geothermal, wind and solar. The rapid growth in renewable power, which is now about 15% of global power9, is increasing the demand of a number of critical minerals. Silicon, silver and aluminum are needed for solar panels with cobalt, tellurium and rare earth elements for wind. Based on Bloomberg New Energy Finance’s Economic Transition Scenario, we estimate North American renewables (solar and wind) electricity generation to at least triple on the back of increased demand for electricity by 2040, compared to 2024 levels10.
Defence
The push for materially more defence and security spending across the West, including in Canada, will require a lot more heavy equipment and the materials and minerals that go into them. A typical artillery tank requires over 20 different critical minerals across navigation, communications, and combat systems11, while an F-35 jet relies on almost 1,000 pounds of rare earth elements12. Batteries and semiconductors are also increasingly important to military operations, along with more traditional needs to strengthen artillery, naval and aerospace (antimony, beryllium, titanium, among others). And then there’s border security; tungsten is used in automobile x-rays and germanium within thermal imaging and night vision goggles.
A New Great Game
The battle for global tech supremacy between China and the U.S. is manifesting a critical mineral resource war, and a geopolitical great game for the 21st century that may soon rival the race for oilfields that came out of the Second World War or the competition for trade routes that shaped the 19th century.
For the U.S. and its Western allies, this competition is at risk of being lost to China. In areas of EVs, renewable energy, and advanced civil and defence technologies, China is proving to be as innovative as America. Global autos rely on Chinese battery technology. Ford CEO Jim Farley views China a decade ahead on battery technology – and still innovating13. On defence, China can bring on new weapons systems five times as quickly as the U.S.14.
Even more concerning is that the U.S. has little to no presence across the critical minerals value chain. The country is 100% import reliant for almost a quarter of its identified 50 critical minerals, and over 50% import reliant on 29 minerals15. In many instances, that reliance is on China. The country is the primary import source for a quarter of U.S. critical minerals and is the leading global producer of 16 of the U.S.’s list of critical minerals16.
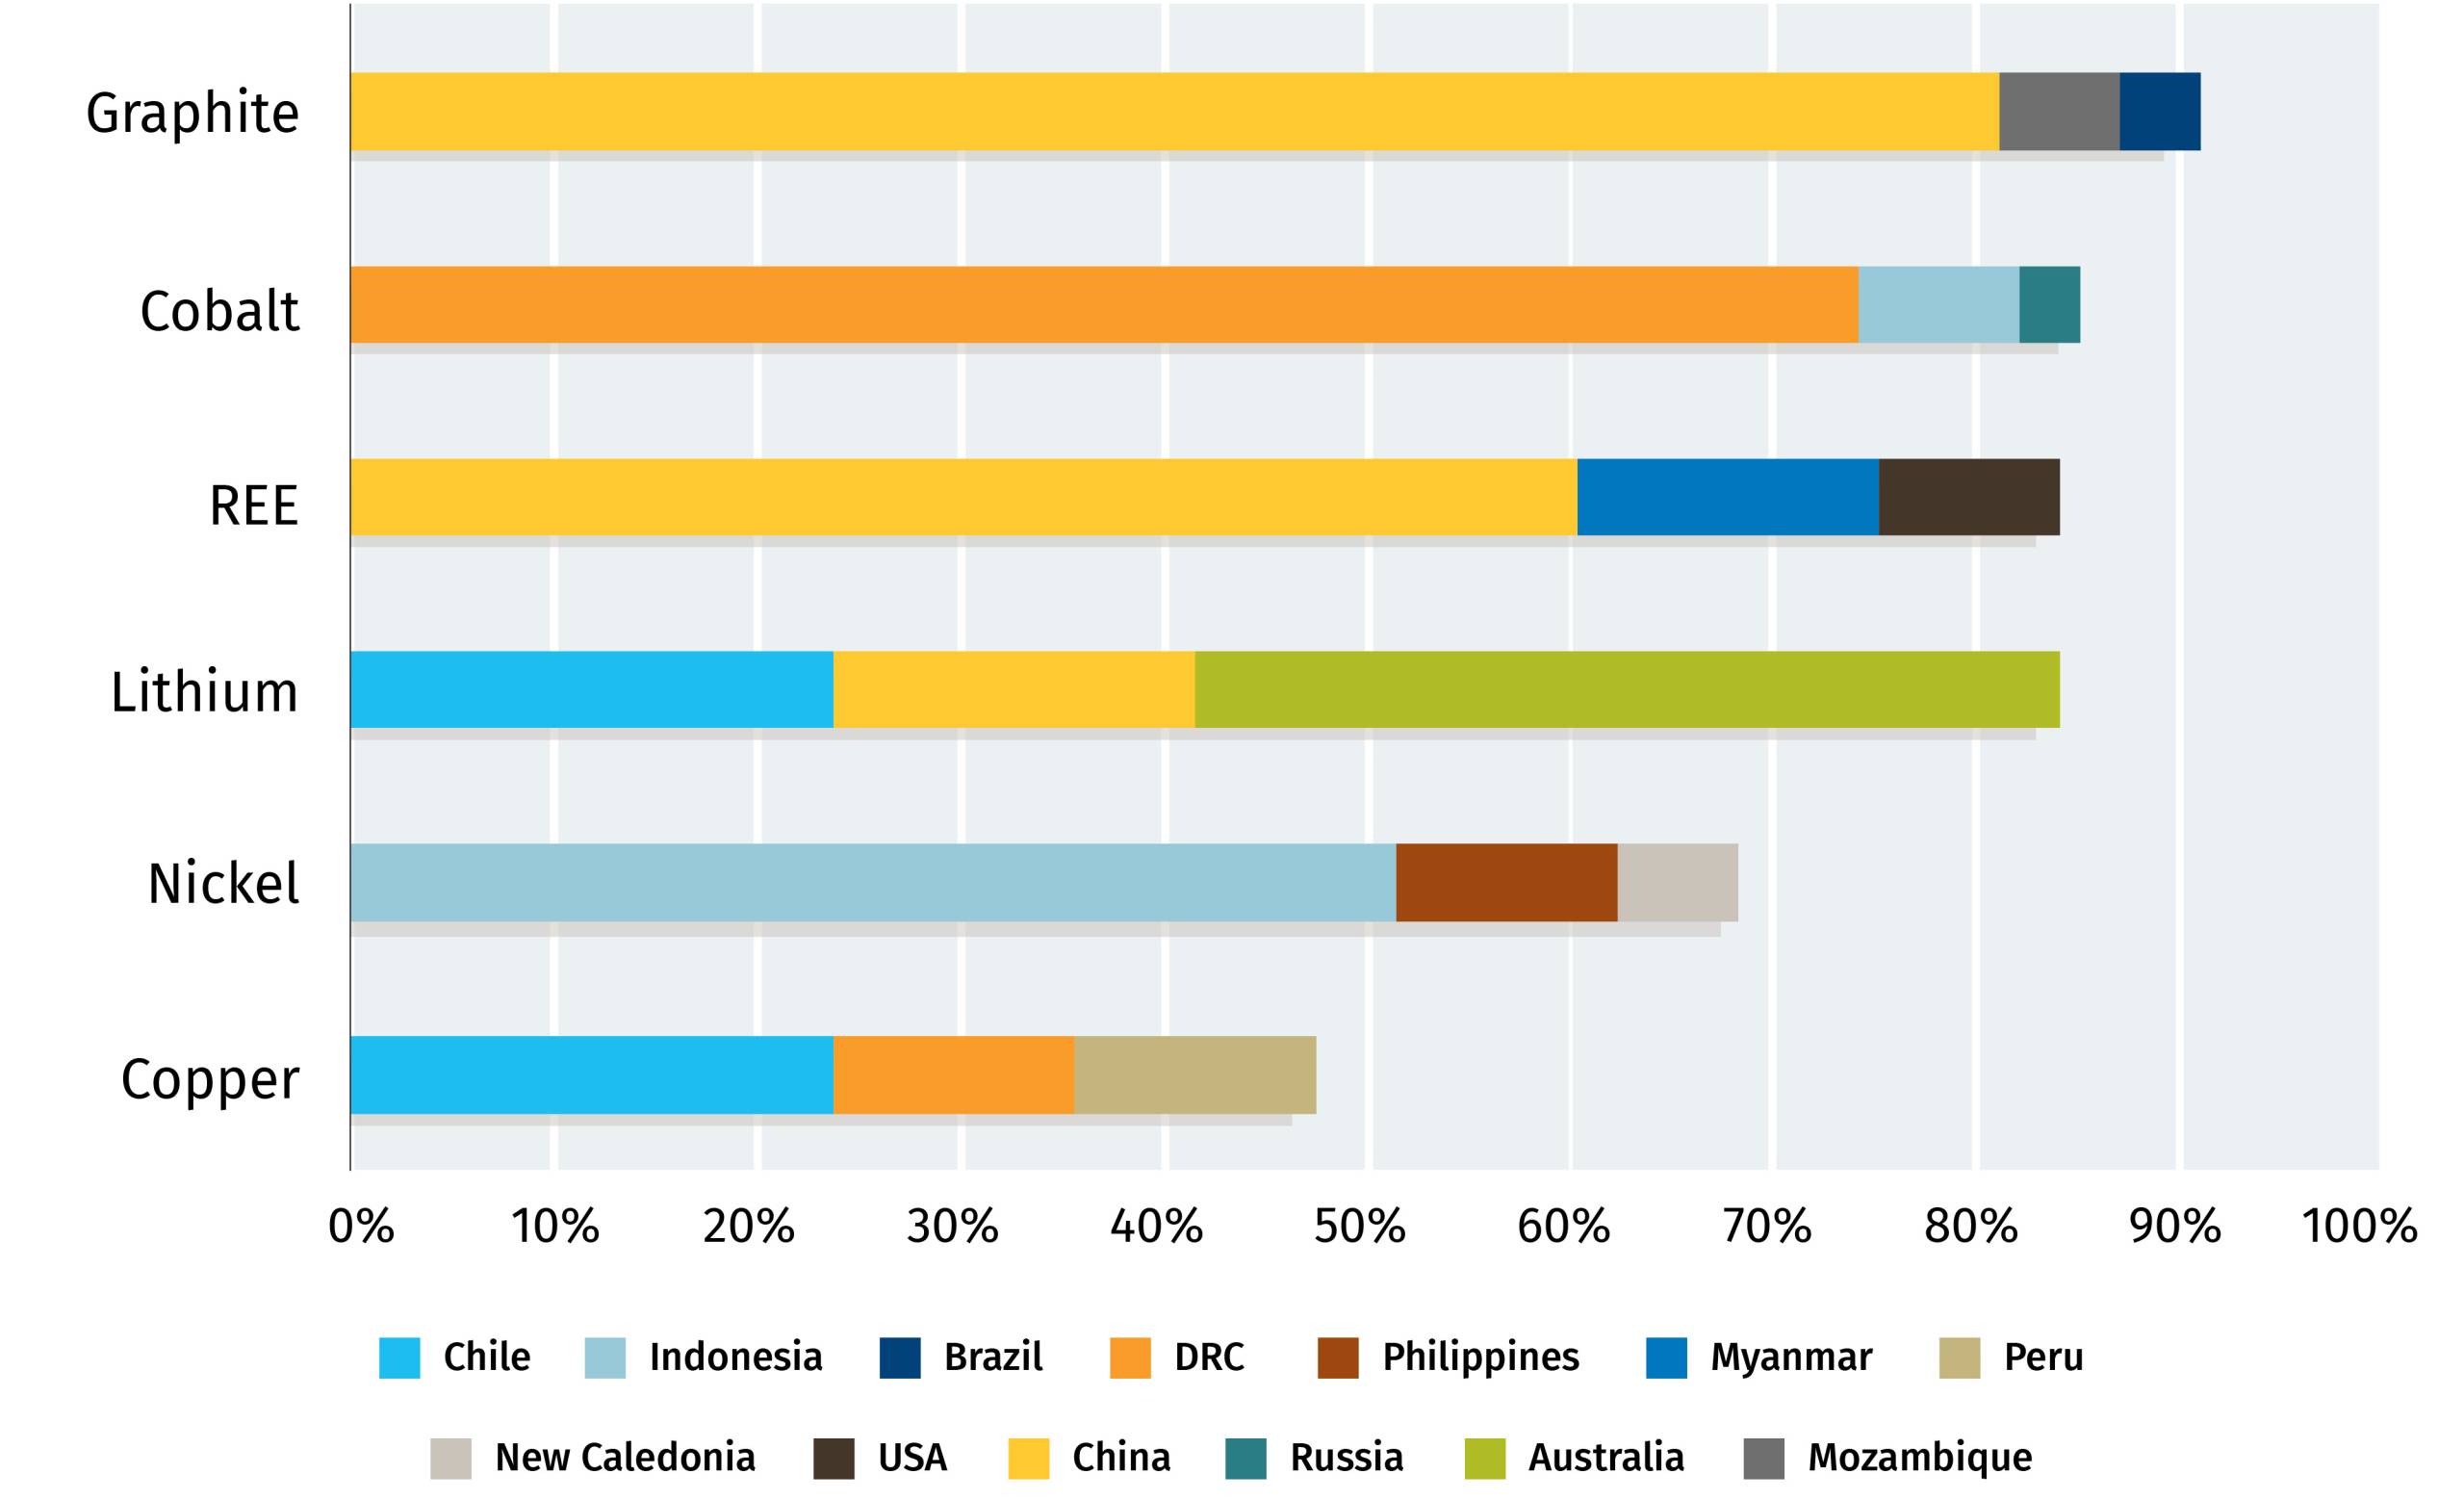
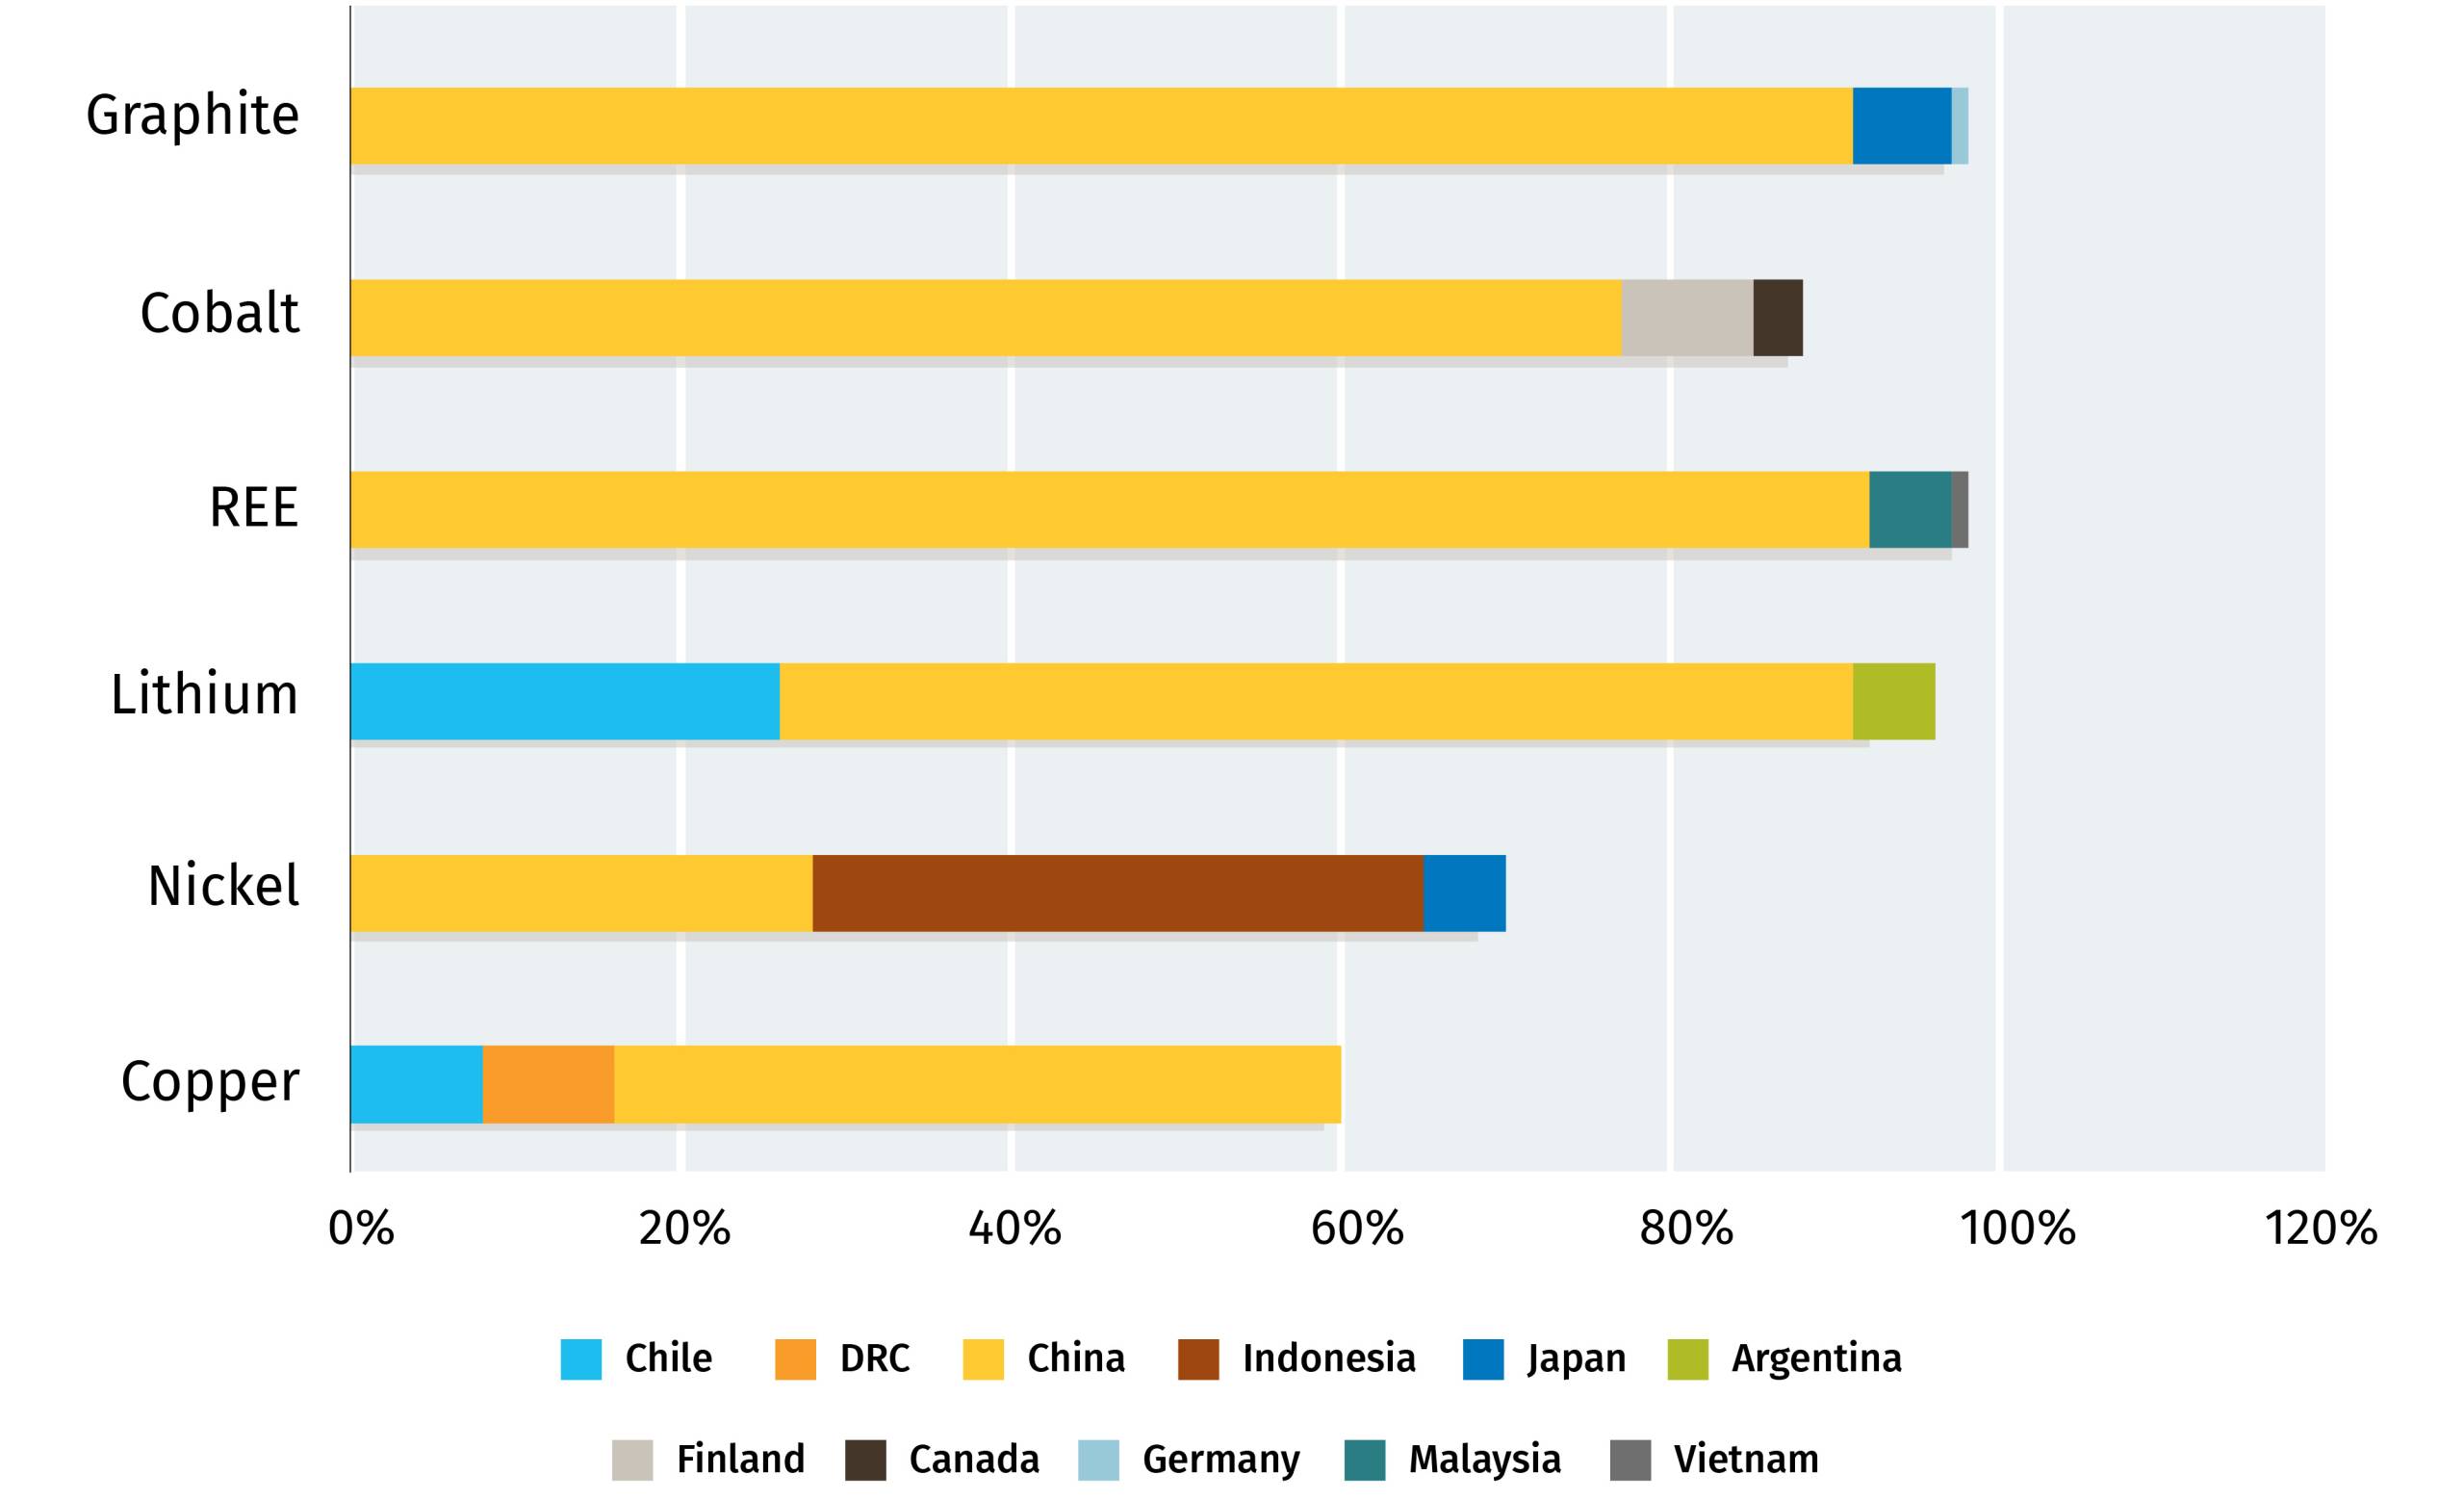
China has dominant positions in either the production and/or refining across the six ‘core’ critical minerals, i.e., lithium, graphite, cobalt, nickel, copper, and rare earth elements (REE). At the most extreme, China has 75% or more global market share of produced and refined graphite, refined rare earth elements, and refined cobalt17. Across the entire six minerals, China has control of, on average, two-thirds of global processing/refining output18.
Critical mineral production is characterized by meaningful concentration risk
Top 3 suppliers as a percent of global supply, 2023
Source: IEA and RBC Thought Leadership
And even more so for critical mineral refining, which is dominated by China
Top 3 suppliers as a percent of global supply, 2023
Source: IEA and RBC Thought Leadership
In foreign markets, Chinese state-owned miners have meaningful operations in Peru, the Democratic Republic of Congo and Indonesia (Chinese firms control almost 75% of Indonesia’s nickel capacity)19. The country also has established investment ties and is the largest trading partner for mineral producers/refiners across virtually every country in South America, Africa, Southeast Asia and Oceania (Australia).
Playing catch-up in this rush for critical minerals will be difficult, and far more challenging than the West experienced with oil, for several reasons:
1.
Exotic minerals. Critical minerals are a varied, diverse set of both traditional and exotic minerals, with their own unique processes to both produce and refine. The process is far more complex than crude refining or natural-gas processing, which situate within a narrower molecular band of hydrogen and carbon compounds.
2.
End use matters. In critical minerals, the end use predicates the type of production and level of refinement required. For instance, primary gallium is recovered as a byproduct of processing bauxite and even at refinement, high purity gallium is refined up to 99.99999% purity.
3.
Technology. Decades of experience have allowed China to innovate refining techniques, such as perfecting the solvent extraction process to refine rare earth elements.
4.
Limited domestic resources. The U.S. has limited domestic resources of critical minerals, with less than 1% of the world’s reserves of cobalt, nickel and graphite and less than 2% of manganese and rare earth elements20.
5.
No state champions. The Seven Sisters, ancestors of British-American siblings BP, Chevron and ExxonMobil, birthed the oil industry. The seven were provided immense political (and military) assurances to traverse foreign lands in pursuit of securing reserves. In contrast, most major North American miners have smaller global footprints relative to the U.S. oil majors, especially downstream (albeit less so for Barrick Gold, Teck Resources and First Quantum Minerals).
The U.S. will be challenged to catch up to Chinese dominance, at least on its own. As a result, it’s creating new strategic spheres to secure the minerals critical to its global technological leadership, targeting resource deals – and perhaps deeper relationships – in the Ukraine, Greenland and Canada. The U.S. may even re-integrate unrestricted Russian commodities back into global markets, if that furthers its own ambitions for resource security.
Canada must be at the centre of this sphere. The country can de-risk critical mineral supply chains – reducing the reliance on China but also providing additional capacity to markets dominated by a handful of suppliers. Canada is a geologically rich, responsible mining nation with significant mineral potential including nickel, cobalt, zinc, aluminum, potash and more niche minerals such as indium, graphite, germanium and gallium. We are also a trading nation, the only G7 nation with free trade agreements across all other G7 members, complemented by a historically strong security relationship with the U.S.
How China gained the lead
The Trump Administration has made critical minerals a strategic priority. A renewed focus on defence is widely seen as a positive investment. The new administration’s executive order immediately pausing the disbursement of funds through the Inflation Reduction Act, along with recent uncertainty around the Biden Administration’s CHIPS and Scient Act, may be more problematic, as it threatens to freeze some critical investment plans at a time when Beijing is not slowing its pace. Put simply, the U.S. may need to embrace all demand drivers because China is embracing all demand drivers: batteries, renewable power, EVs, defence and AI.
We have identified four key drivers that led to China’s dominance – some of which employ industrial and foreign policy approaches that the West may be forced to take to unbalance this great imbalance:
Policy
Industrial policy targeting steel, aluminum and copper (initial industrialization) was followed by policies to further adoption of EVs and renewables. On the supply side, state assistance was provided to create national champions to compete with global majors. This was complemented with foreign policy objectives, such as One Belt, One Road, which invested $1 trillion (U.S.) in foreign countries — often in resource rich nations21. The Inflation Reduction Act was America’s industrial policy response, and while successful in stimulating capital directed towards research, development and manufacturing, little has been put towards mineral mining and/or refining.
Market
Today, China accounts for 70% of the value of global clean technology22 manufacturing within an ecosystem that is often vertically integrated; minerals are mined, refined to the specificity of end components. Demand pulls supply, which is sourced by state-owned miners operating in lower cost jurisdictions, all while being provided state support. Western miners, in contrast, are beholden to higher standards by public investors, lacking in state subsidies, and are often subject to higher social license costs in foreign resource development, given the lack of political support (state-investor dispute, versus state-state dispute).
Technology
In China, targeted state-support for both supply and demand fostered breakthroughs in technology and riding down the cost curve – especially in renewables and batteries. On the supply side, technological innovation in Chinese production and refining has allowed China to perfect the solvent extraction process to refine REEs.
Mindset
China takes a war-time mindset to allocating capital and other resources to ensure security of supply and demand through an entire value chain approach. The U.S., in contrast, lacks such urgency. It’s even moved away from strategic mineral reserves, by either not replenishing reserves relative to historical levels or, in the case of helium, selling reserves altogether. This is vastly different than the approach taken to crude oil, which maintains a strategic reserve and until 2015 had a continental export ban.
The big five: Canada’s non-fuel critical minerals
U.S. imports of all non-fuel mineral and metals reached $167 billion (U.S.) in 202423. Canada remains the largest source of U.S. imports (US$40 billion, or 24%), and is the #1 provider of steel, aluminum, potash, nickel and zinc to the U.S. (#2 for copper)24. Across the U.S.’s 50 critical minerals, Canada is also the largest source of imports (US$4.5 billion, or 20%)25.
With that said, the U.S. remains reliant on China for many less commercial yet strategically important critical minerals. Even more, China has implemented export controls on a number of these minerals, such as gallium. The economic significance from this supply risk is material; the U.S. Geological Survey estimates a 30% supply reduction in gallium (China is 90% of global supply) alone could cause a $600 billion (U.S.) drop in U.S. GDP26.
In the near to mid-term, Canada has an opportunity to gradually displace Chinese supply, while also furthering a U.S.-Canadian strategy to secure production across a range of technologies and applications critical to both continental security and the Fourth Industrial Revolution. Below, we identify five key critical minerals best situated around this opportunity.
1. Gallium
Gallium has one of the highest thermal conductivities among metals. It is used in the production of highly specialized integrated circuits and semiconductors for AI and advanced computing. Gallium-based semiconductors are also vital to U.S. next-generation missile defence, radar systems and electronic communications.
The U.S. remains 100% import reliant for its supply of gallium27. In 2024, Canada was the #1 provider of gallium metal to the U.S., accounting for over 50% of imports (effectively displacing Chinese supply)28. Current supply is sourced from recycled gallium at Neo Performance Materials’ site in Peterborough, Ontario. Rio Tinto’s Saguenay demonstration project could add another 5-10% of total global primary gallium metal production if it can reach commercial viability29. A proposed expansion at Teck Resource’s Trail, B.C. operations could also increase production of germanium and add gallium and antimony.
2. Graphite
High electric conductivity, temperature resistance, chemical inertness, and lubricity characterize this battery metal increasingly relevant in defence applications. Graphite’s unique properties make it difficult – even impossible – to substitute in many applications, such as where thermal resistance is essential to equipment performance and durability.
Global demand for graphite is forecast to nearly double by 203530. Canada has a unique opportunity to develop a full graphite value chain, a highly valuable proposition given China is 82% and 91% of global graphite production and refining, respectively31. Quebec is furthest along with Northern Graphite’s operating mine in Lac des Iles, northwest of Mt. Tremblant, and Nouveau Monde Graphite’s development projects underway for mining in Matawinie, north of Montreal, and refining in Bécancour, outside Trois-Rivieres. Ontario offers another potential graphite mine, Northern Graphite’s Bissett Creek, near the Ottawa River north of Algonquin Park, which is undergoing permitting.
3. Nickel
Nickel has high ductility (flexible), toughness and strength. The mineral is used in lithium-ion batteries and in the production of stainless steel. Global demand is forecast to grow 70% by 2035, largely on the back of demand for batteries, both within transport and stationary (utility)32.
The Dumont Nickel project (Nion Nickel) in Quebec’s Abitibi region is vertically integrated and under construction. Canada Nickel’s Crawford mine (world’s second largest nickel reserve) north of Timmins, Ontario, is undergoing permitting. Canadian nickel provides much needed diversification of supply, with Indonesia and the Philippines together alone accounting for two-thirds of global production33. Canadian nickel could exceed 100% of U.S. import needs if all projects come online34.
4. Tungsten
With the highest tensile strength (the maximum stress a material can bear without breaking) and melting point of all naturally occurring metals, tungsten-based alloys are key inputs for defence aircraft, naval vessels, and armour-piercing ammunition. Tungsten is also used within automobile x-ray machines, used in enhancing U.S. border security.
China produces 83% of the world’s tungsten and accounts for 52% of global reserves35. Canada is a past producer, with substantial reserves that include some of the world’s largest tungsten deposits. Northcliff Resources’ Sisson project, northwest of Fredericton, and Fireweed Metals’ Mactung mine, in eastern Yukon, are notable Canadian tungsten projects. In December 2024, the Canadian government and U.S. Department of Defense announced a joint investment of $35 million USD in the Mactung project, the world’s largest high-grade tungsten deposit36.
5. Germanium
The mineral has semiconducting characteristics comparable to those of silicon, but with superior optical and thermal properties. Its use is critical in night vision, space exploration, fiber optic cables, and semiconductors. The growing need for datacenters (fibre) has spurred demand in recent years.
Canada supplied 20% of U.S. germanium (oxide) imports in 202337. Canada’s Teck Resources holds an integrated germanium supply chain with zinc ores mined in Alaska and refined in Trail, B.C. The Trail facility has a proposed expansion to increase germanium production largely in response to China’s germanium export ban late last year.
Ensuring Canadian Competitiveness
Canada’s natural resource wealth has attracted natural resource investors and operators for over a century, backed by quality infrastructure, rule of law, robust environmental and labour standards, and deep trading relationships. Canada can build on those strengths, taking the following steps:
Leverage government capital. Critical mineral projects face capital shortages. Governments can help bridge this gap with either direct equity positions or by providing long-term offtake agreements. Defence procurement is a focal point, where Canadian, U.S. and allied nations defence departments can source future supply of critical minerals and stockpile reserve through “virtual inventories” or long-term purchase commitments. If Canada meets a commitment to spend 2% of GDP on defence, this could unlock as much as $17 billion of new capital, annually, for mine development.
Limit price distortions from China. The mining industry now requires a “China premium” to counteract market distortions – primarily to offset the risk of China oversupplying markets to suppress global pricing. A minimum price floor, supported by government purchase agreements and other intervenions, adds price transparency and establishes revenue certainty to buffer price fluctuations. Alternatively, restrictions on Chinese products could support domestic pricing. This includes restricting Chinese supply outright, or enacting price adjustments such as anti-dumping, countervailing duties, or border adjustments (environmental and human rights standards).
Expand tax credits. Canada’s Critical Mineral Investment Tax Credit (ITC) excludes key defence critical minerals such as tungsten, indium, and beryllium. Eligibility could be further expanded beyond the current list of 15 minerals. Other options: allow for the stacking of tax credits, introduce Production Tax Credits (PTC) to support operating expenses (buffering against Chinese dumping) and enhance various government programs to more explicitly support critical minerals, including the Strategic Innovation Fund and Canada Growth Fund.
Secure market access. Tariff threats and Buy America programs hinder capital flows into non-U.S. jurisdictions. Minimizing tariff barriers abroad and investing in domestic refining and processing capacity ultimately secures demand for our products. On the supply side, securing our own supply chain is also critically important. Gallium is a Canadian success story, but relies on imported electronics from Taiwan (via the U.S.).
Invest in human capital. The Toronto Stock Exchange and TSX Venture Exchange are home to more miners than any other major developed world index, and with them comes a deep bench of mining talent. This talent is at risk, however, as engineers and a tech-minded generation increasingly looks to software and AI for careers. One startling fact: China has 39 university degree programs to train engineers in critical minerals; Canada has none.
Reduce approval times. Canada needs to consolidate processes, where possible. Critical minerals are as strategic as transportation, and related projects can be declared to be in the national interest to accelerate their development. The same sort of pragmatism can be applied at the provincial level, where collaboration across departments, with local communities and with Ottawa can be improved. Lastly, and perhaps most importantly, we will need to find new ways to accelerate project approval processes while not undermining the duty to consult Indigenous communities. More Indigenous equity in these projects, including through the national and various provincial loan guarantee programs, can unlock greater Indigenous wealth and capital for re-investment in societal infrastructure and future resource projects.
Enabling infrastructure. Given the remote nature of many critical mineral deposits, the lack of existing infrastructure is problematic including rail, road, ports, power transmission, and cell towers. Increased collaboration by Federal and provincial governments to provide anticipatory, enabling infrastructure can support project economics and limit mine development times.
Shaz Merwat, Energy Policy Lead, RBC Climate Action Institute
John Stackhouse, Senior Vice-President, Office of the CEO, RBC
Vivan Sorab, Senior Manager, Clean Technology, RBC Climate Action Institute
Caprice Biasoni, Graphic Design Specialist
Shiplu Talukder, Digital Publishing Specialist
Natural Resources Canada
Center for Strategic and International Studies, Critical Minerals and the Future of the U.S. Economy, February 2025; Natural Resources Canada
Natural Resources Canada
U.S. Geological Survey
Deloitte, 2025 Global Semiconductor Industry Outlook
Arrow Electronics, Silicon vs. gallium nitride (GaN) semiconductors: Comparing properties & applications, March 21, 2024
IEA, Minerals used in electric cars compared to conventional cars, May 5, 2021
Bloomberg New Energy Finance, RBC Thought Leadership
IEA, Renewables 2024, October 2024
Bloomberg New Energy Finance, RBC Thought Leadership
Natural Resources Canada
Science History Institute, Manufacturers Case Study, Using the Rare Earth Elements
Wall Street Journal, What Scared Ford’s CEO in China, September 14, 2024
Center for Strategic and International Studies, Critical Minerals and the Future of the U.S. Economy, February 2025
Ibid
Natural Resources Canada
IEA, Global Critical Minerals Outlook 2024, May 2024
Ibid
Reuters, Chinese firms control around 75% of Indonesian nickel capacity, report finds, February 5, 2025
Center for Strategic and International Studies, Critical Minerals and the Future of the U.S. Economy, February 2025
AidData, Power Playbook: Beijing’s Bid to Secure Overseas Transition Minerals, January 28, 2025
IEA, Energy Technology Perspectives 2024, October 30, 2024
U.S. International Trade Commission, data accessed via DataWeb
Ibid
U.S. Geological Survey Mineral Commodities Survey; U.S. International Trade Commission, data accessed via DataWeb; USA Trade Online, U.S. Census Bureau
U.S. Geological Survey
Ibid
U.S. International Trade Commission, data accessed via DataWeb; USA Trade Online, U.S. Census Bureau
Company website
Natural Resource Canada
IEA, Global Critical Minerals Outlook 2024, May 2024
Natural Resources Canada
IEA, Global Critical Minerals Outlook 2024, May 2024
Company website
IEA, Global Critical Minerals Outlook 2024, May 2024
Natural Resources Canada
U.S. International Trade Commission, data accessed via DataWeb; USA Trade Online, U.S. Census Bureau
As the world races to secure the critical minerals essential to a modern economy, Canada has a crucial decision to make: what role can it play in de-risking a critical mineral supply chain that is overwhelmingly dominated by China?
At PDAC 2025, this question is top of mind for industry leaders, policymakers, and global investors. Building on our Getting Critical on Critical Minerals briefing, we’re diving deeper into five minerals increasingly vital to the economy of the future.
Each of these minerals are vital inputs across five key focus areas: artificial intelligence, border security, healthcare, energy and defense. But supply chains are vulnerable, international competition is fierce, and Canada must navigate complex policy, investment, and processing challenges to establish itself as a global leader.
Explore the briefings:
1. Gallium: the most critical of critical minerals. Key Focus: Artificial Intelligence
Every year, Toronto plays host to the world’s biggest mining conference, as the Prospectors and Developers Association of Canada brings together more than 27,000 global mining executives, investors and policy makers. And this year’s conference, running from March 2-5, is more critical than ever. Critical minerals will be centre stage, given their importance to the growing geopolitical race between the United States and China. They may not be the mainstay of mining but minerals like gallium and lithium are essential inputs in advanced technologies that span energy, defense, manufacturing and increasingly, artificial intelligence. Nations with secure access to these critical minerals will secure global economic competitiveness and national security. Here are three big questions we’ll be tracking at PDAC ‘25:
1. What’s with all the critical mineral hype?
From advanced semiconductors used in AI to the manufacturing of electric vehicles and batteries to technological advancements in defense and aerospace, critical minerals underlie the critical components of the Fourth Industrial Revolution – an era of disruptive technological forces driven by increased human-machine interaction. Today, China dominates the entire critical mineral value chain, from mining to refining/processing to end-use demand. The International Energy Agency has identified six core critical minerals (copper, lithium ,nickel, cobalt, graphite and rare earth elements) — and on average, China accounts for two-thirds of global refining capacity for the group. In contrast, the U.S. has limited domestic reserves of critical minerals and is entirely import-reliant on supply – often times from China itself. This battle for global tech supremacy between China and the U.S. is manifesting a critical mineral resource war, a new great game for the 21st century rivaling the geopolitical significance of oil post Second World War.
2. What role can Canada play in securing critical mineral supply chains?
Canada and the U.S. have an established minerals and metals trading relationship, as each other’s largest trading partner. In 2024, Canadian non-fuel mineral imports amounted to US$40 billion, or 24% of total U.S. imports. The country is also the largest source of U.S. critical mineral imports by dollar value, but largely skewed by ‘commercial’ critical minerals imports such as aluminum, nickel and zinc. Increasingly, there is a growing cohort of less commercial yet strategically important niche critical minerals with vital importance in defense applications, border security and advanced chip making. The supply of these minerals, such as gallium, germanium, antimony and tungsten, are dominated by China and are subject to Chinese export controls. It is across this subset of minerals particularly where we believe Canada can play a vital role in in de-risking U.S. and G7 critical mineral supply chains.
3. What can we expect to hear at the conference?
This year’s PDAC conference will have a greater-than-usual policy bent, given the increased tensions around U.S. critical mineral supply – already witnessed in Ukraine peace talks but also seen in President Trump’s commentary around Greenland and Canada. Continued rhetoric from policy makers and mining executives on Canada’s potential may expand the belief that Canada has allies and economic partners. We anticipate hearing more on how Canada can enhance its competitiveness in attracting critical mineral capital. This could include a greater role for governments in providing offtake agreements, enhanced fiscal incentives such as expanded investment tax credits, securing market access and streamlining permitting. RBC Thought Leadership will publish a more detailed report on critical minerals later this coming week, along with commentary throughout PDAC. You can follow our research and insights on RBC’s Trade Hub.
Artificial intelligence (AI) is rapidly reshaping the global economy, driven by Big Tech’s breakthrough apps such as OpenAI’s ChatGPT. Businesses are eyeing ways to transform their operations through AI, which has serious implications—transformative and disruptive—for the wider economy. At the heart of this AI-driven transformation are data centres, the crucial infrastructure powering applications, from simple queries to complex generative tasks.
Every AI prompt requires significant computing power. A single ChatGPT query consumes 10 times more energy than a standard Google search. More advanced AI operations such as generating text or images, exponentially spike power consumption. Canadian data centres’ rising energy demands make them a major driver of electricity demand growth. If all the data centre projects currently being reviewed by regulators proceed, they would account for 14% of Canada’s total power needs by 20301, similar to 12-15% by 2030 in the U.S.2
The development of these data centres, likely between 20 to 30, would result in $100 billion in capital expenditures related to the construction and build of accompanying IT infrastructure3. However, AI’s energy-intensive nature raises concerns about power availability, grid reliability and its implication on emissions.
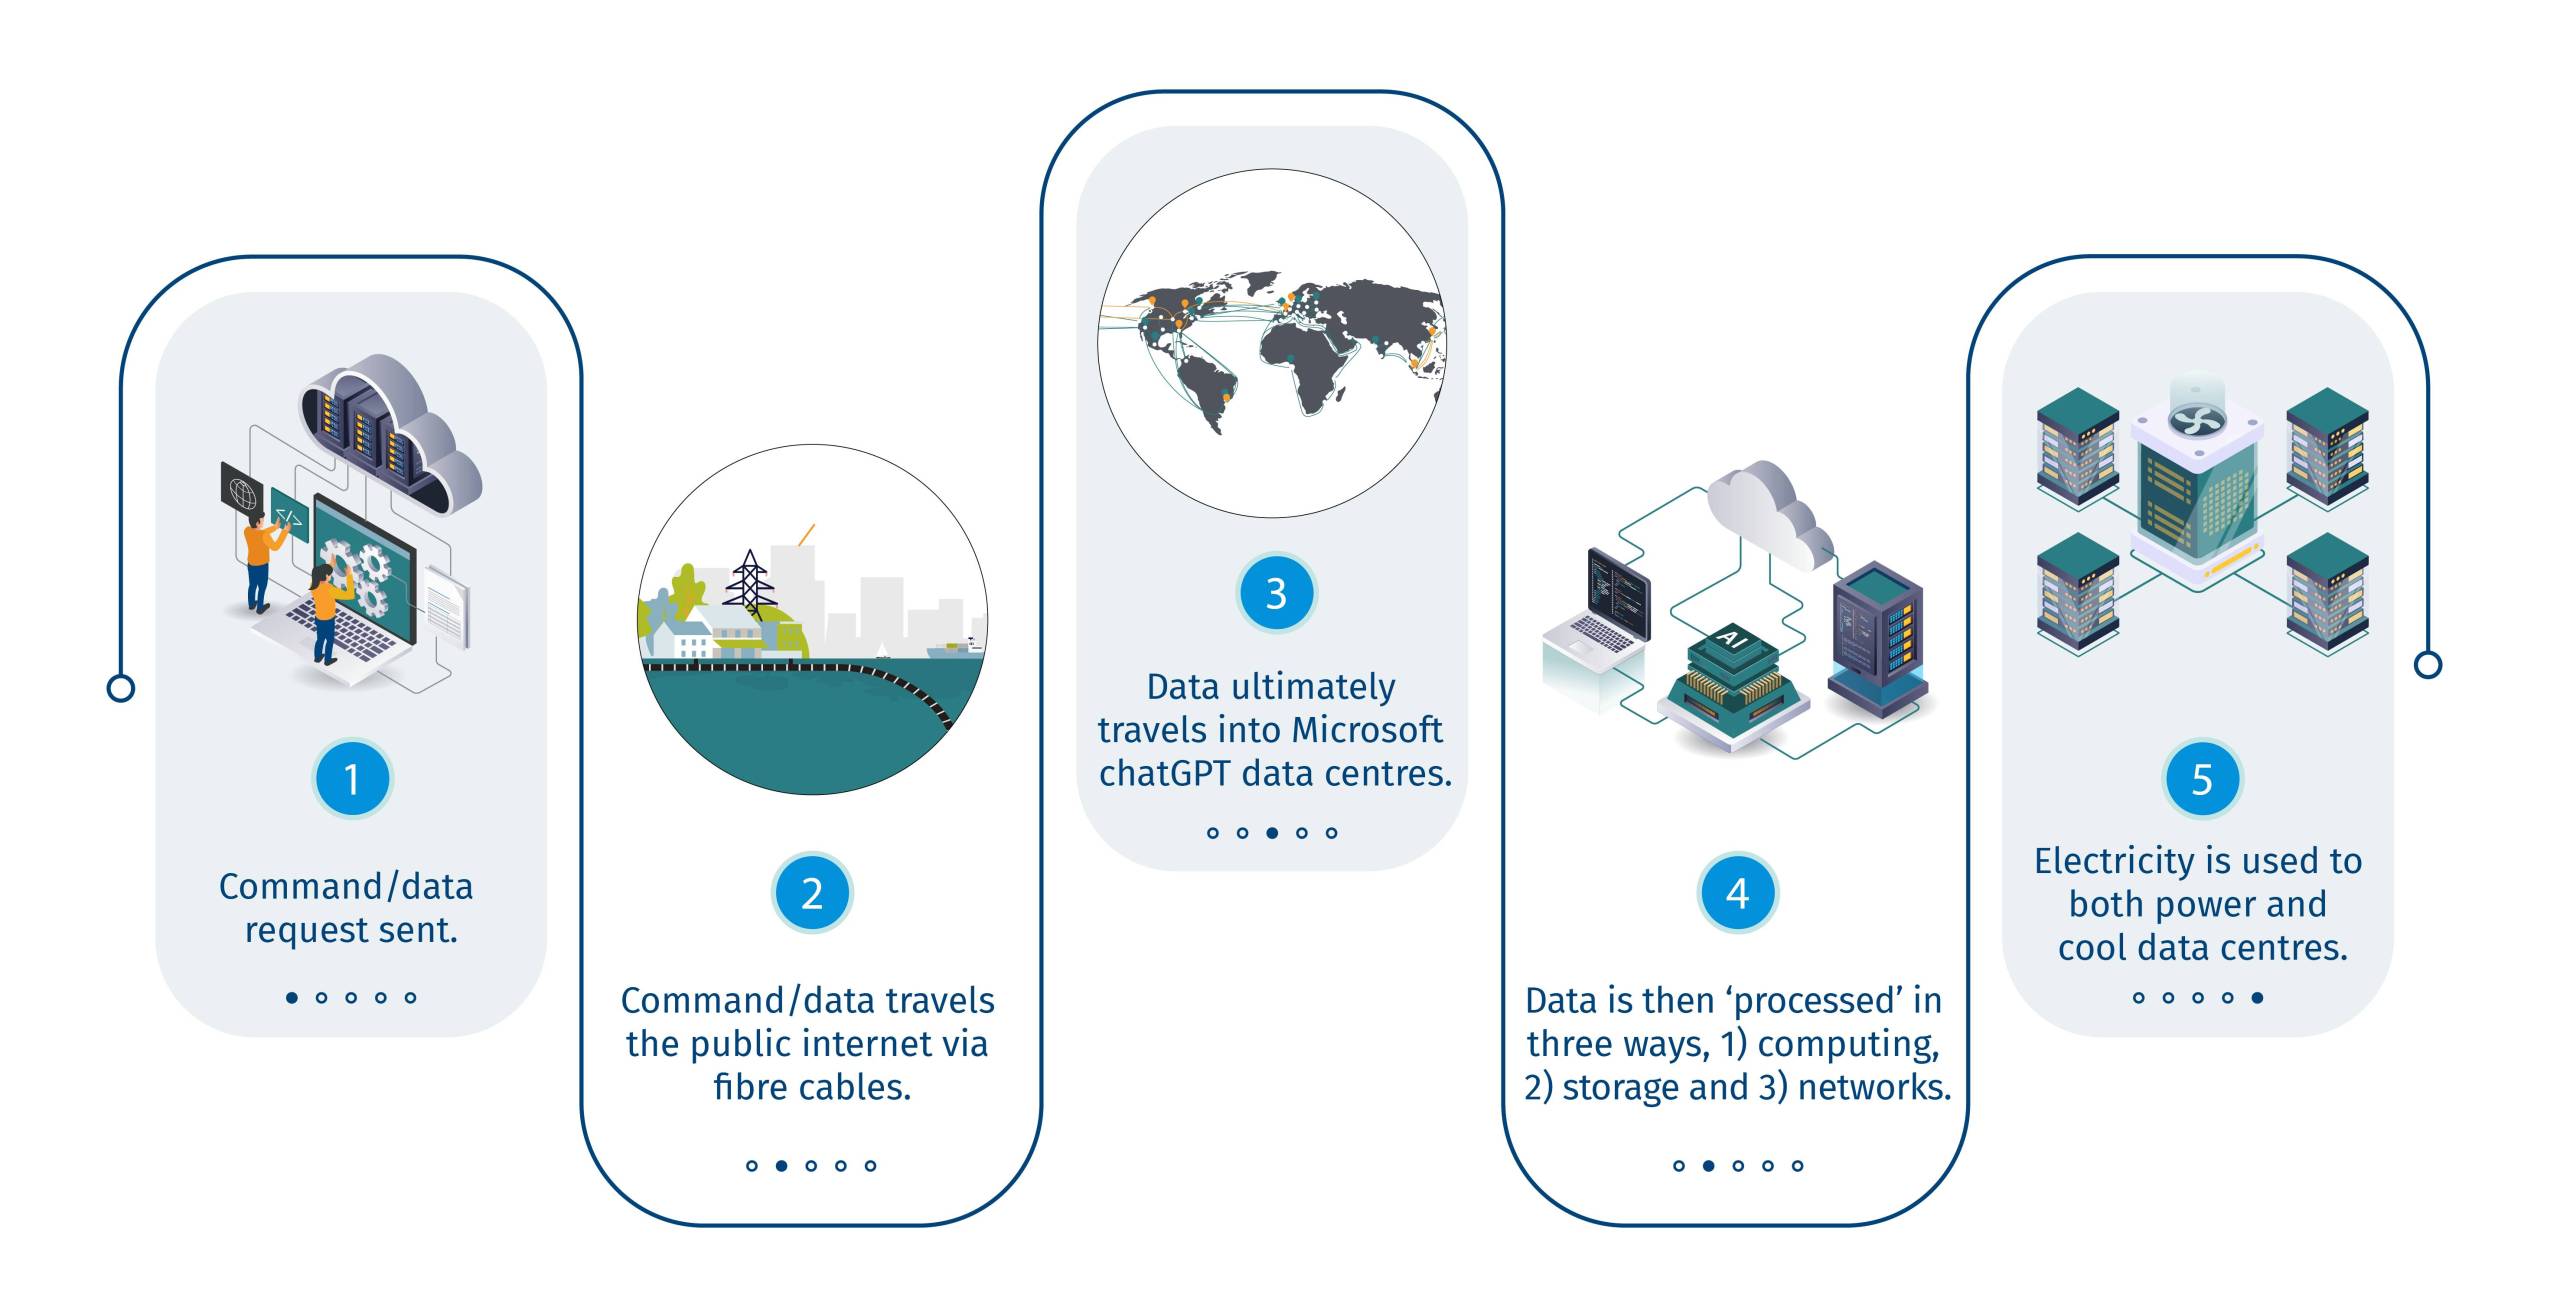
The power behind ChatGPT: How data centres process search queries
Key Findings
Canadian regulators are reviewing data centre applications with an estimated combined capacity of 15 gigawatts—enough to power seven out of 10 homes nationwide.
AI is the primary driver of this surge, with data centres offering a $100 billion economic opportunity for the construction and build out of data centres and accompanying data infrastructure.
Canada’s clean energy resources offer a strategic advantage for AI-driven growth. However, natural gas remains a critical part of the mix due to its reliability. Nuclear power is also an option but with a considerably longer lead time.
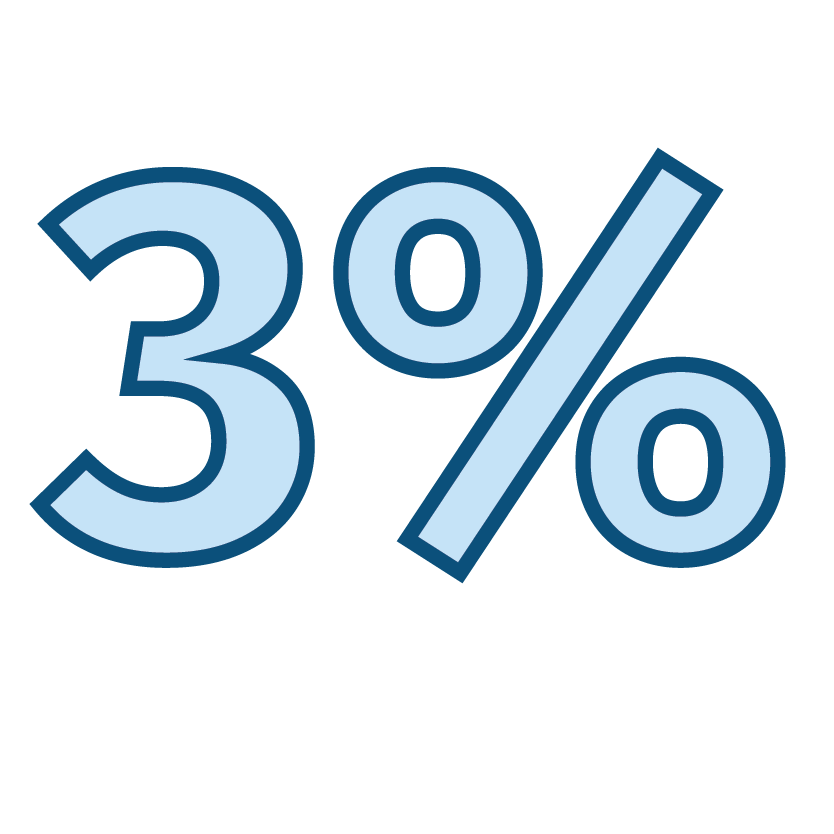
Canada’s annual emissions could rise 3%, if natural gas powers six additional gigawatts of data centres. However, carbon capture and storage (CCS) could throttle the rise of emissions.
Local data centres strengthen Canada’s position in AI by securing data sovereignty and enhancing cybersecurity.
Streamlining AI governance across Canada and the U.S. is a key next step in securing North American leadership. A review of CUSMA in 2026 would likely see refinements to the digital trade chapter.
Targeted efforts to increase AI adoption among Canadian SMEs—which account for half of Canadian GDP—could help reverse Canada’s lagging productivity.
A new trading chip
Canada faces a strategic moment as it captures the AI opportunity. Beyond the economic incentives, local data centres are essential for ensuring data privacy, national security, and resilience against cyber threats.
We can leverage our prodigious hydro, natural gas and nuclear power to emerge as a low-cost data centre hub. We can also build on this advantage further by harnessing AI’s power to boost Canadian productivity, enhance our competitiveness, and deepen our digital talent pool.
The AI opportunity also has trade and geopolitical implications, especially as Canada needs ever more chips to bargain with a transactional U.S. administration-in-waiting. With Washington increasingly focused on China, data sovereignty could become a key focus over the next few years. This provides Canada plenty of opportunities—but also some risks.
We could be a valuable partner for the U.S. and create a digital North American fortress, securely warehousing critical data at low cost. But that would require a realignment on data sovereignty between the two countries, which would most likely occur at the next round of Canada-United States-Mexico Agreement (CUSMA) in 2026.
A modernized digital trade chapter—Chapter 19—was a factor that drove Washington to seek a revised trade agreement during U.S. President Donald Trump’s first term. The next iteration of Chapter 19 could increase the focus on compatibility of North American data, both in terms of cross-border transfers and AI governance.
Powering up data centres
Substantial demand from “hyperscalers”—data centres with large compute capabilities—could strain Canada’s grid and drive up power bills, putting governments and regulators in a bind, as recently evidenced with the U.S. federal energy regulator’s refusal to allow Amazon Inc. to purchase more power from a Pennsylvania nuclear facility on the grounds it would raise customer rates and threaten grid reliability.
It also comes at a time many Canadian provinces are already facing sizeable power demands from population growth and electrified transport, as well as ambitions to decarbonize heavy industries. All told, Canada’s power demand was already set to double by 2050, potentially even triple4. And that was before AI became a compelling need for the global economy.
Canada has several energy sources it can draw on to power data centres, but each comes with its own challenges and considerations:
Wind and solar: growing sources of power but in the absence of storage, their intermittency makes them unsuitable for data centres that demand consistent baseload power.
Nuclear: The emerging energy of choice for Big Tech in the U.S. It’s an option in Ontario, too, but would require long lead times stretching out to a decade, if not more. Nuclear remains a viable long-term solution.
Hydro: Several provinces such as Quebec and British Columbia already rely heavily on the power source, and, like nuclear, would require a long time to boost capacity.
Natural gas: Alberta’s preferred option, and a key part of Ontario’s transition until 2040. But powering AI through natural gas comes with an emissions cost that provinces will need to weigh.
Provincial Imperatives: Honing regional approaches to AI
Provinces will ultimately drive Canada’s AI ambition.
Alberta, with ample natural gas and lower grid pressures, prefers data centres operate off-grid, minimizing the strain on public grids. The “bring your own power” (BYOP) model allows for faster deployment and supports local natural gas prices, driving economic benefits for the province. It is also aligned with the proposed Canadian Electricity Regulations, given the facilities would not be net exporters to the grid. However, BYOP is not necessarily a viable model for all Canadian jurisdictions.
Quebec, with its rigorous environmental standards and cap-and-trade system, prioritizes low-emission solutions. The province’s hydro power provides clean energy but its capacity to meaningfully expand hydro in the short term is limited. British Columbia faces similar constraints, with a preference for hydroelectric power and tight regulations on carbon-intensive energy sources.
Ontario’s more flexible energy policy allows for a mix of solutions. Its population density and industrial base create competing demands for grid capacity—from electric vehicle and battery supply chain to greenhouses. The province’s primary challenge will be to strike a balance between these competing needs.
Decisions about where and how to build data centres will involve a complex matrix of economic, environmental, and social factors. Our research shows that data centres rank higher in GDP impact compared to, say, manufacturing and transport, but contribute fewer jobs compared to those industries.
That’s where federal and provincial alignment will be critical to Canada’s AI strategy. Policymakers will need to create frameworks that allow provinces to develop bespoke policies that balance growth, sustainability and the demands of the new economy. This includes targeted support for AI adoption among SMEs and ensuring that data centres contribute to productivity gains across sectors. For example, as part of a greater commitment to invest $25 billion in Canadian data centres, Amazon Web Services (AWS) apportioned dedicated compute capacity to the University of Alberta in 2023, sourced from a recently completed $4-billion cloud computing data centre in Calgary.
Power Supply: Capturing the ‘hyperscaler’ opportunity
Data centres require vast amounts of electricity, ranging from 200 megawatts to 500 megawatts. Canada’s low-cost, clean energy gives it a significant advantage. Hydroelectric and nuclear power in cities like Montreal, Vancouver, and Toronto offers some of the cheapest and cleanest electricity in North America. Comparatively, U.S. industrial power prices in key data centre states such as Arizona, Illinois, and Texas are on average 30-40% more expensive, and that excludes their warm climates adding an extra 20-40% power for cooling purposes.
Global hyperscalers are seizing on the Canadian opportunity. We estimate various provinces are reviewing applications for 15 GW of new data centre capacity—a 20-fold increase from current levels5 and enough to power 70% of Canadian households today. In addition, the “expressed interest” in data centres is likely far greater. Alberta alone is being pitched proposals for 50 projects with a combined capacity of 20 GW6.
The mass electrification of the economy is already expected to place unprecedented demand on Canada’s grids. Canada’s power generation is expected to reach 750 GWh7 over the next ten years, compared to an estimated demand of 875 GWh8, implying a shortfall of about 15%. It underscores the need for careful resource management.
Emissions: Leveraging carbon capture
AI’s energy footprint raises concerns about Canada’s climate goals. With provinces being asked to provide power for important industries such as heavy industry, liquefied natural gas electrification and greenhouses, most provinces will have to determine where data centres fit with their economic priority and emissions-cutting ambitions.
Data centres depend on consistent baseload power, which wind and solar cannot reliably provide due to their intermittent nature. New renewable projects are also facing opposition in certain jurisdictions. Natural gas, with its reliability as baseload power and quick scalability, can fill the gap.
However, using gas for data centres raises emissions concerns. If natural gas powers six additional gigawatts of data centres, annual emissions could rise by 16 million tonnes of CO2e—a 3% increase9 in Canada’s total emissions.
Carbon capture and storage (CCS) could throttle the rise of emissions. In Alberta, companies are already in discussions to incorporate carbon capture into gas-fired power plants for data centres. That would alleviate environmental concerns, leverage existing energy infrastructure and drive further investments in natural gas production and the development of CCS.
Big Tech companies, that are investing heavily in nuclear power in the U.S. to feed their AI operations, could replicate that playbook with abated natural gas in Canada.
However, the high costs and technical complexities of CCS mean it’s not an all-of-Canada solution. While the CCS technology is readily transferable, only Alberta and Saskatchewan have the required geology and infrastructure in Canada to store carbon.
Economy: Unlocking a $100-billion opportunity
The digital economy is expanding rapidly, from cloud computing to AI applications, and transforming every aspect of the economy.
Current estimates suggest the digital economy accounts for 6.3% of Canada’s GDP, but broader estimates place it at 15%—and it’s growing 2.5 times faster than conventional economic sectors10. Data centres are critical to this digital ecosystem, hosting and processing the vast volumes of data generated by AI and other advanced technologies. Development of the proposed data centres alone could spark a $100-billion construction and IT infrastructure boom, in addition to its positive impact on the wider economy.
But there’s an even greater prize for Canadian businesses: an AI ecosystem that helps them gain a competitive edge in areas as diverse as healthcare, autos, manufacturing and clean-tech. That could be in the form of AI revolutionizing biotech research, accurately detecting weather patterns, or improving navigation in autonomous vehicles.
Canada’s AI adoption, however, lags its peers. Only 35% of Canadian firms use AI, compared to 72% in the U.S.11 The discrepancy is partially due to the high percentage of small and medium-sized enterprises (SMEs) in Canada, which employ 65% of the private workforce12. SMEs often lack the capital and talent to invest in cutting-edge technology. Addressing this gap is essential to boosting Canadian productivity, which has been in decline for more than 30 years13. With its R&D spending at 1.7% of GDP14—less than half of U.S. levels—Canada faces an urgent need to increase investment in AI and technological innovation.
The federal government has taken steps to close the productivity gap, launching initiatives such as the $2-billion AI Compute Access Fund to boost Canadian businesses’ technological capabilities. The fund aims to deliver computational power needed to drive innovation in both large companies and SMEs.
Bridging the AI adoption gap is critical not only for immediate economic gains, but also for positioning Canada as a global leader in the technology. This includes deepening the country’s AI-ready workforce, with training programs and partnerships with academic institutions key to fostering a new generation of AI professionals.
Data Security: Safeguarding sovereignty and privacy
Data sovereignty is also crucial. Canada’s strict data privacy laws mandate that sensitive information remains within its borders, ensuring compliance and protecting citizens’ privacy. As digital data grows, so do cyber risks. IBM reports 27,000 data breaches in Canada annually, with potential economic losses in the billions.
But keeping data within borders has two inherent tradeoffs: on power and trade. Data centres’ impact on the grid, to date, has been marginal given that in Canada they are used largely for hosting purposes. The proliferation of AI and resulting power draw from hyperscalers, however, accentuates this tradeoff. Most likely, segments of demand will still likely require to be hosted locally, i.e., for economically sensitive areas such as government, healthcare, banking and insurance, and research and development where latency can impact effectiveness. For other pockets of demand, such as e-commerce, an integrated North American data corridor, as envisioned by OpenAI CEO Sam Altman, could result in comparative advantages for less constrained jurisdictions to power North America’s AI economy. But that would require greater collaboration between Canada and the United States.
Data centres can also help Canada build on its AI expertise. The country has been a leader in AI research since the 1980s, thanks to renowned academics including Geoffrey Hinton and Yoshua Bengio. Yet, the country’s lack of domestic AI infrastructure threatens its leadership. To remain competitive, Canada must likely prioritize dedicated data resources for public sectors such as healthcare, education, and defence. These resources are essential for fostering innovation and maintaining Canada’s technological edge.
Conclusion
There’s an opportunity for Canada to build on its AI leadership beyond economic considerations and productivity. An AI ecosystem can infuse the wider economy with tools that crunch big data and algorithms to boost domestic companies’ competitiveness in areas as diverse as healthcare, clean-tech, manufacturing and services and transportation and logistics.
A flexible approach, combined with federal collaboration, would ensure Canada’s AI infrastructure powers the digital economy in a way that aligns with the country’s broader sustainability, security, and economic goals.
Contributors:
Shaz Merwat, Energy Policy Lead, RBC Climate Action Institute
Yadullah Hussain, Managing Editor, RBC Climate Action Institute
Caprice Biasoni, Graphic Design Specialist
Shiplu Talukder, Digital Publishing Specialist
The data centre power estimate is based on the current set of data centre projects believed to be in application with provincial electricity regulators. Total estimated power consumption for Canada by 2030 is taken from the Canada Electricity Advisory Council.
As estimated by S&P Global, BCG and McKinsey.
Estimate is based on total data centre build costs, including land costs, construction costs, and accompanying data processing and networking, and power and cooling expenses.


 EN
EN