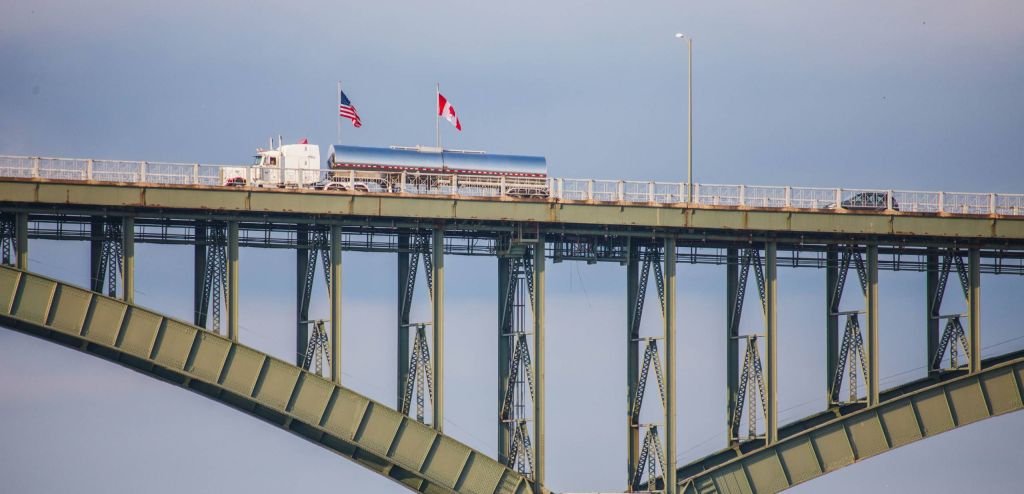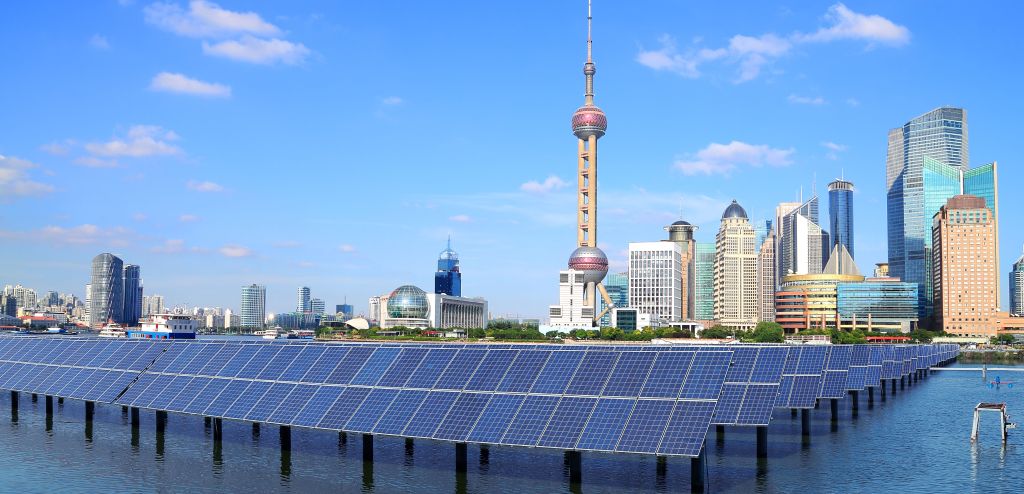
The Strait of Hormuz blockade has exposed two chokepoints amid the Middle East conflict: one for fossil fuels, and another for Western decarbonization policies. In many respects, it is China that’s leading the global energy transition. Emerging trade data highlights China’s often-underappreciated position in global clean energy supply chains, which has only accelerated with the Hormuz crisis.
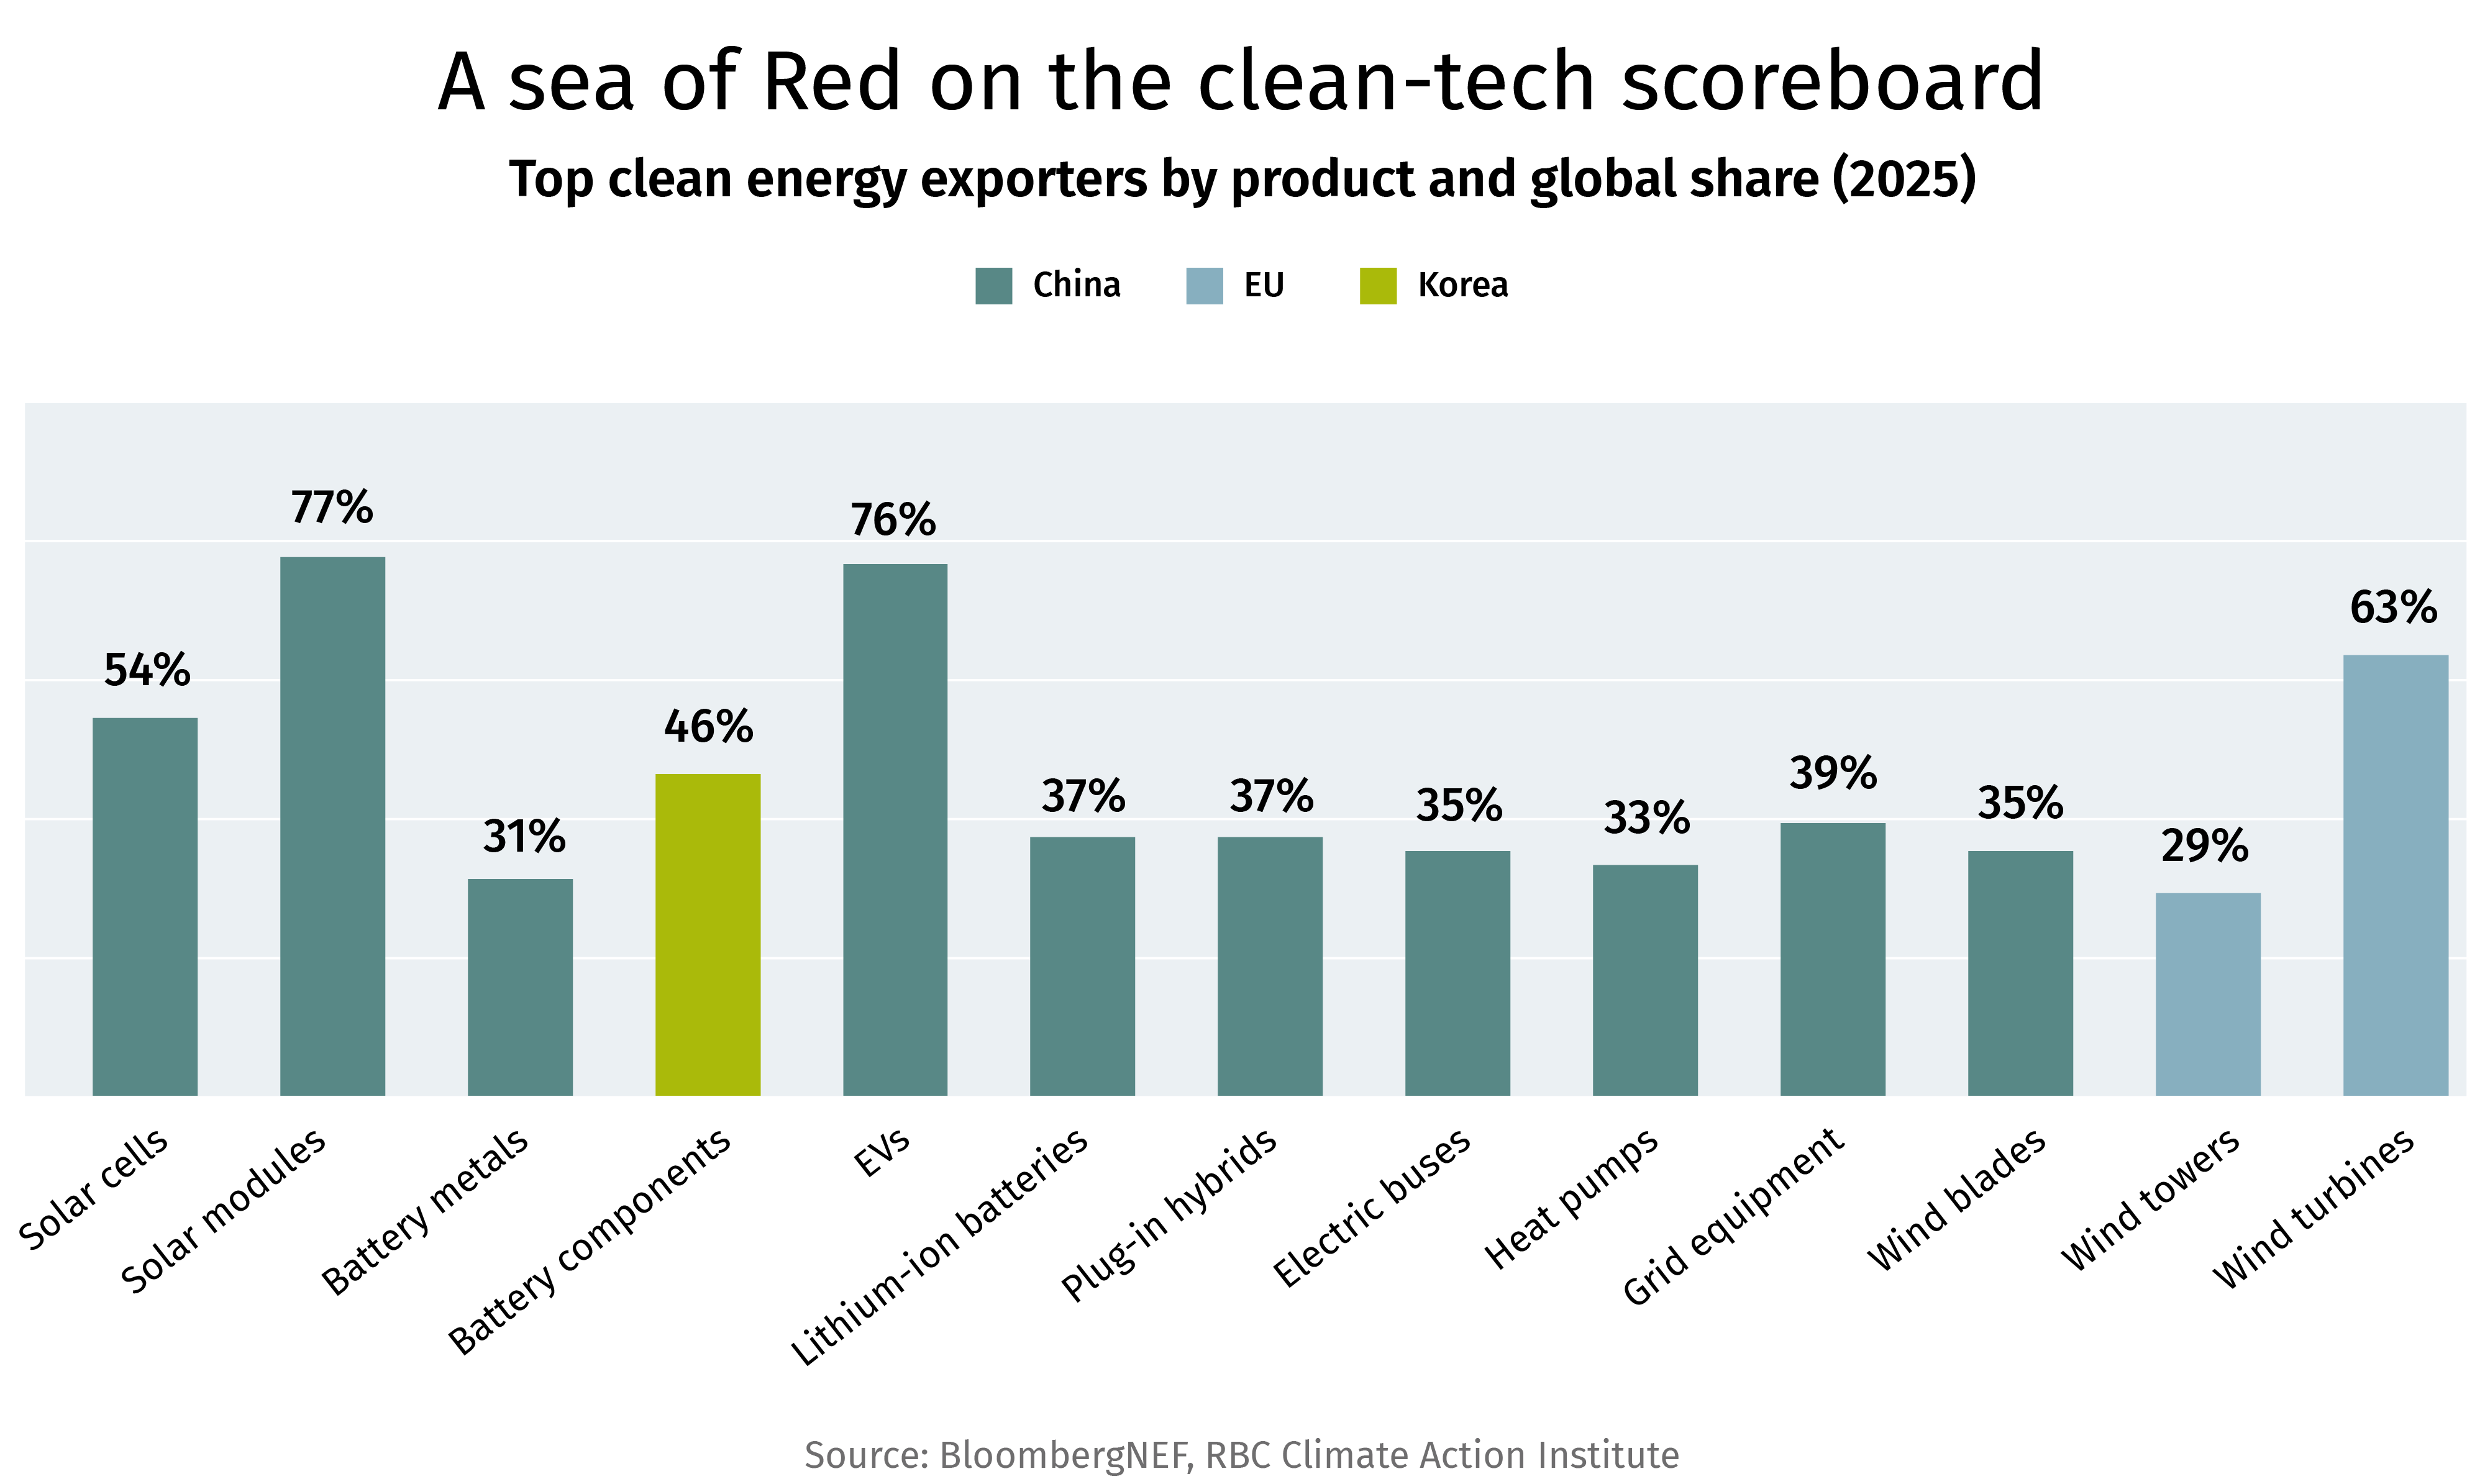
A sea of Red on the clean-tech scoreboard. Top clean energy exporters by product and global share (2025)

China is the largest exporter of almost every major clean technology, often by a significant margin. Non-Chinese leaders—the E.U. for wind towers and turbines, and South Korea for battery components—either source from, or invest alongside, China. In North America, geopolitical sensitivities (to date) have outweighed benefitting from China’s structural advantage.
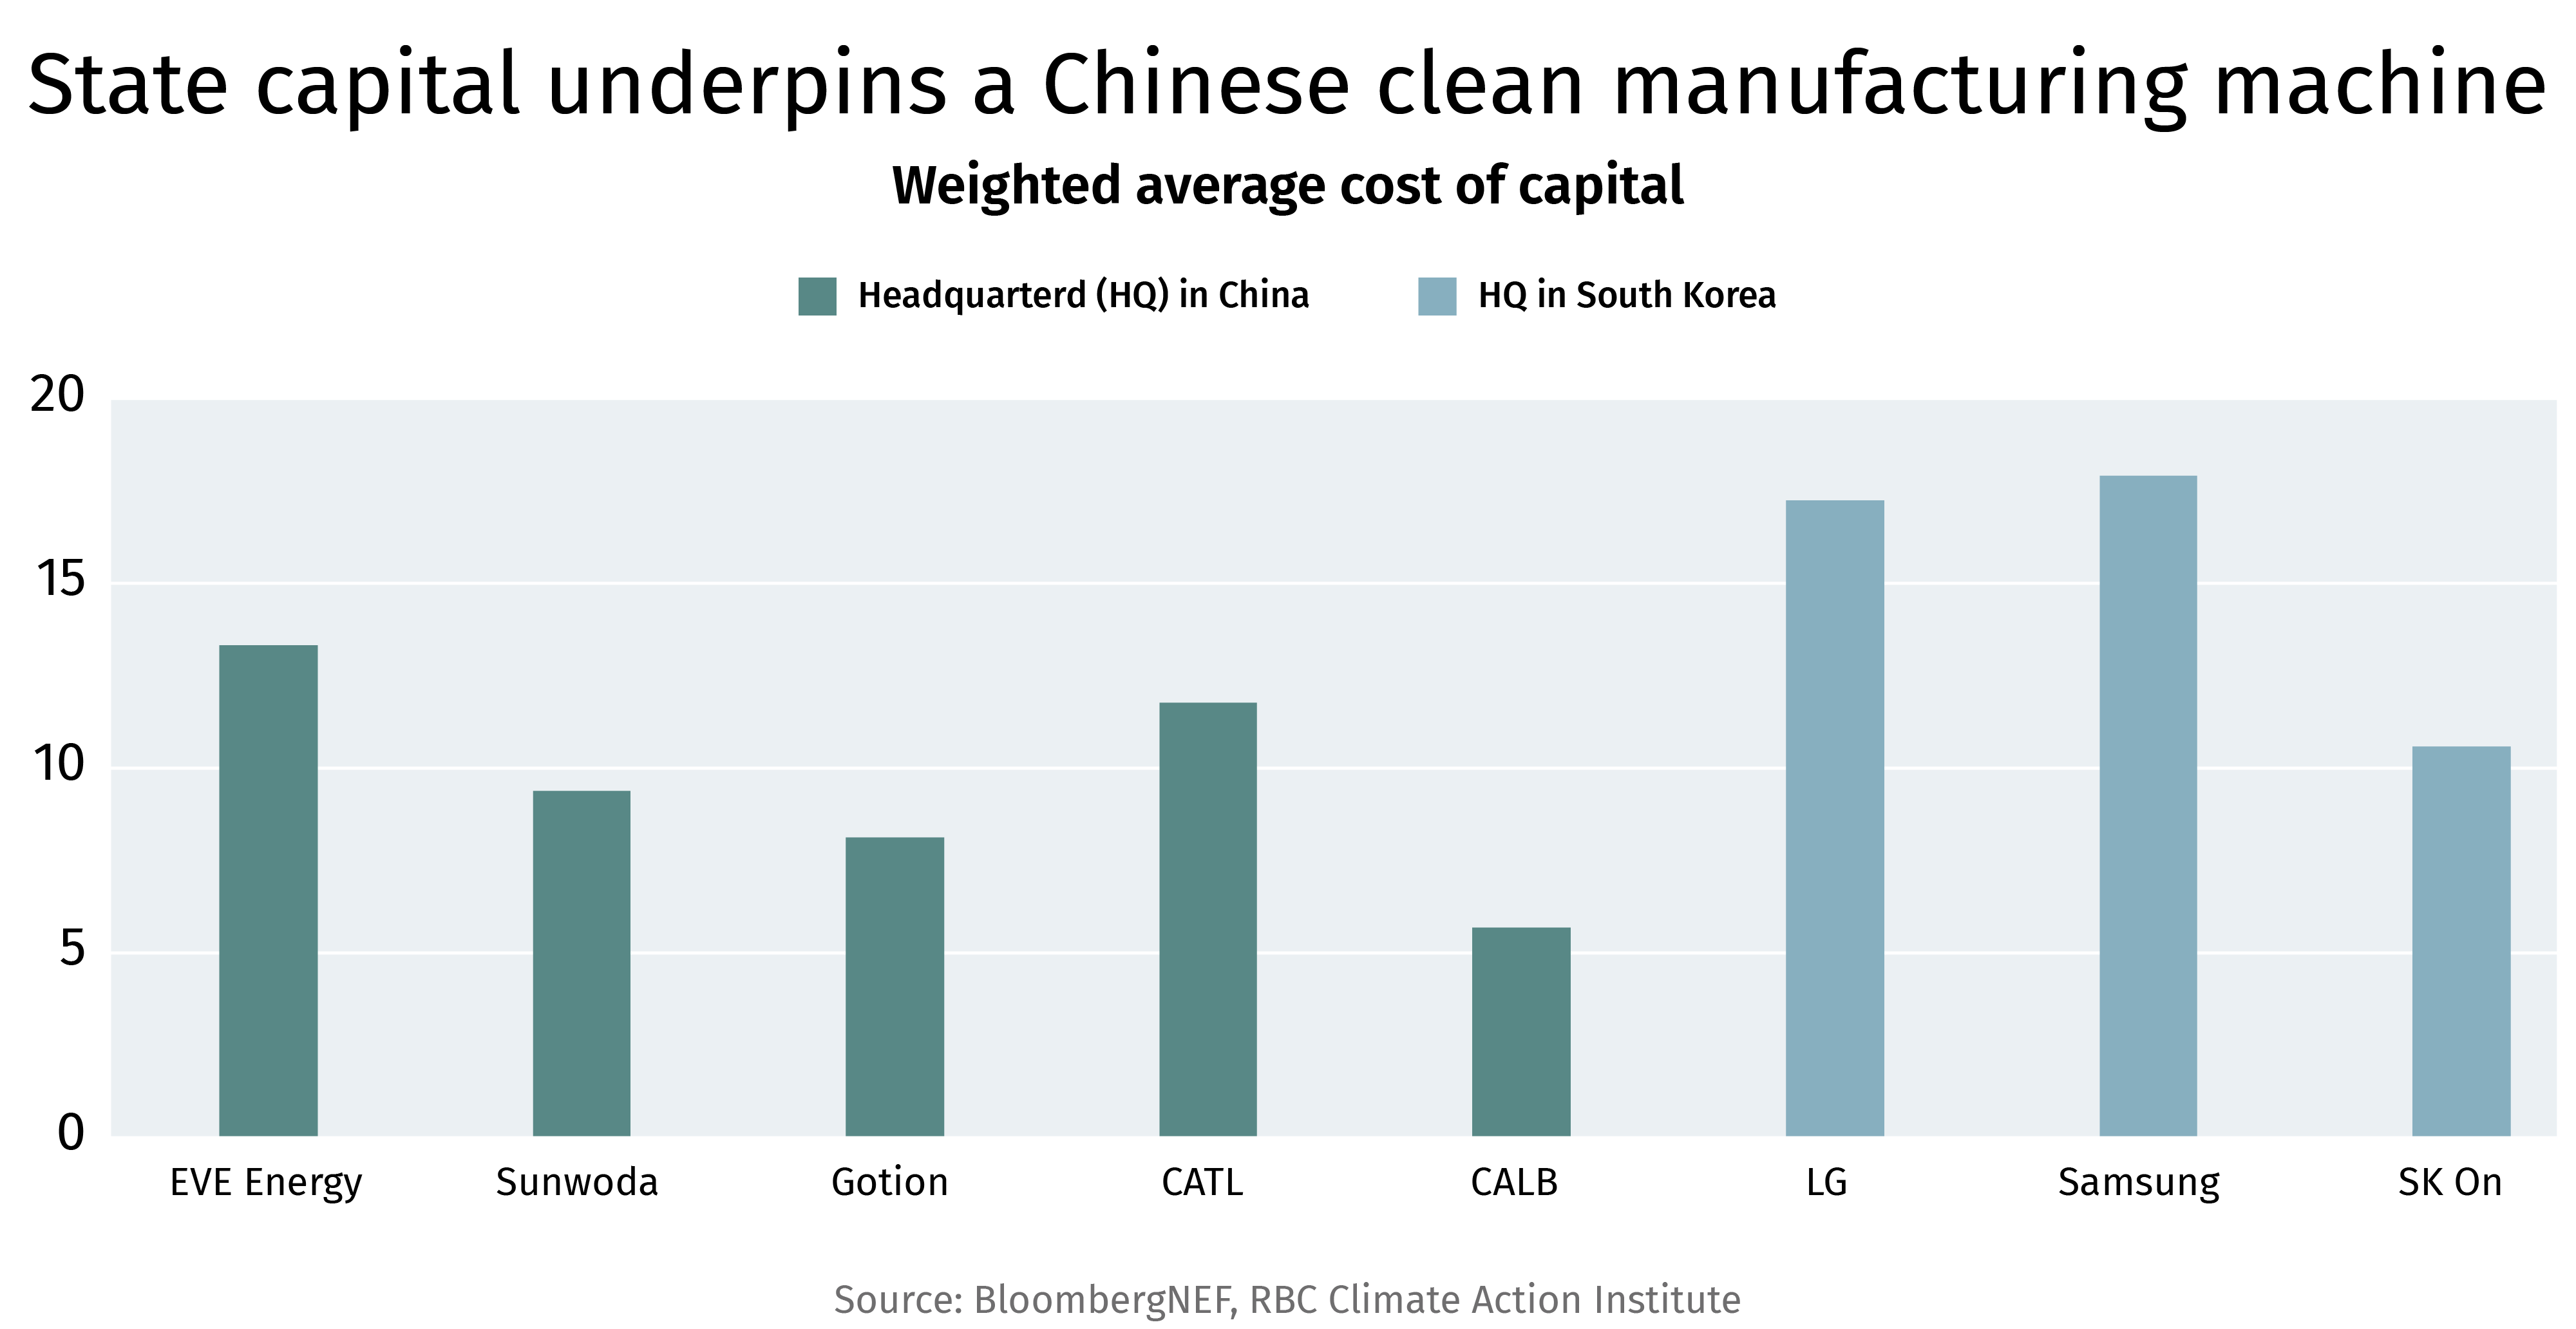
State capital underpins a Chinese clean manufacturing machine. Weighted average cost of capital
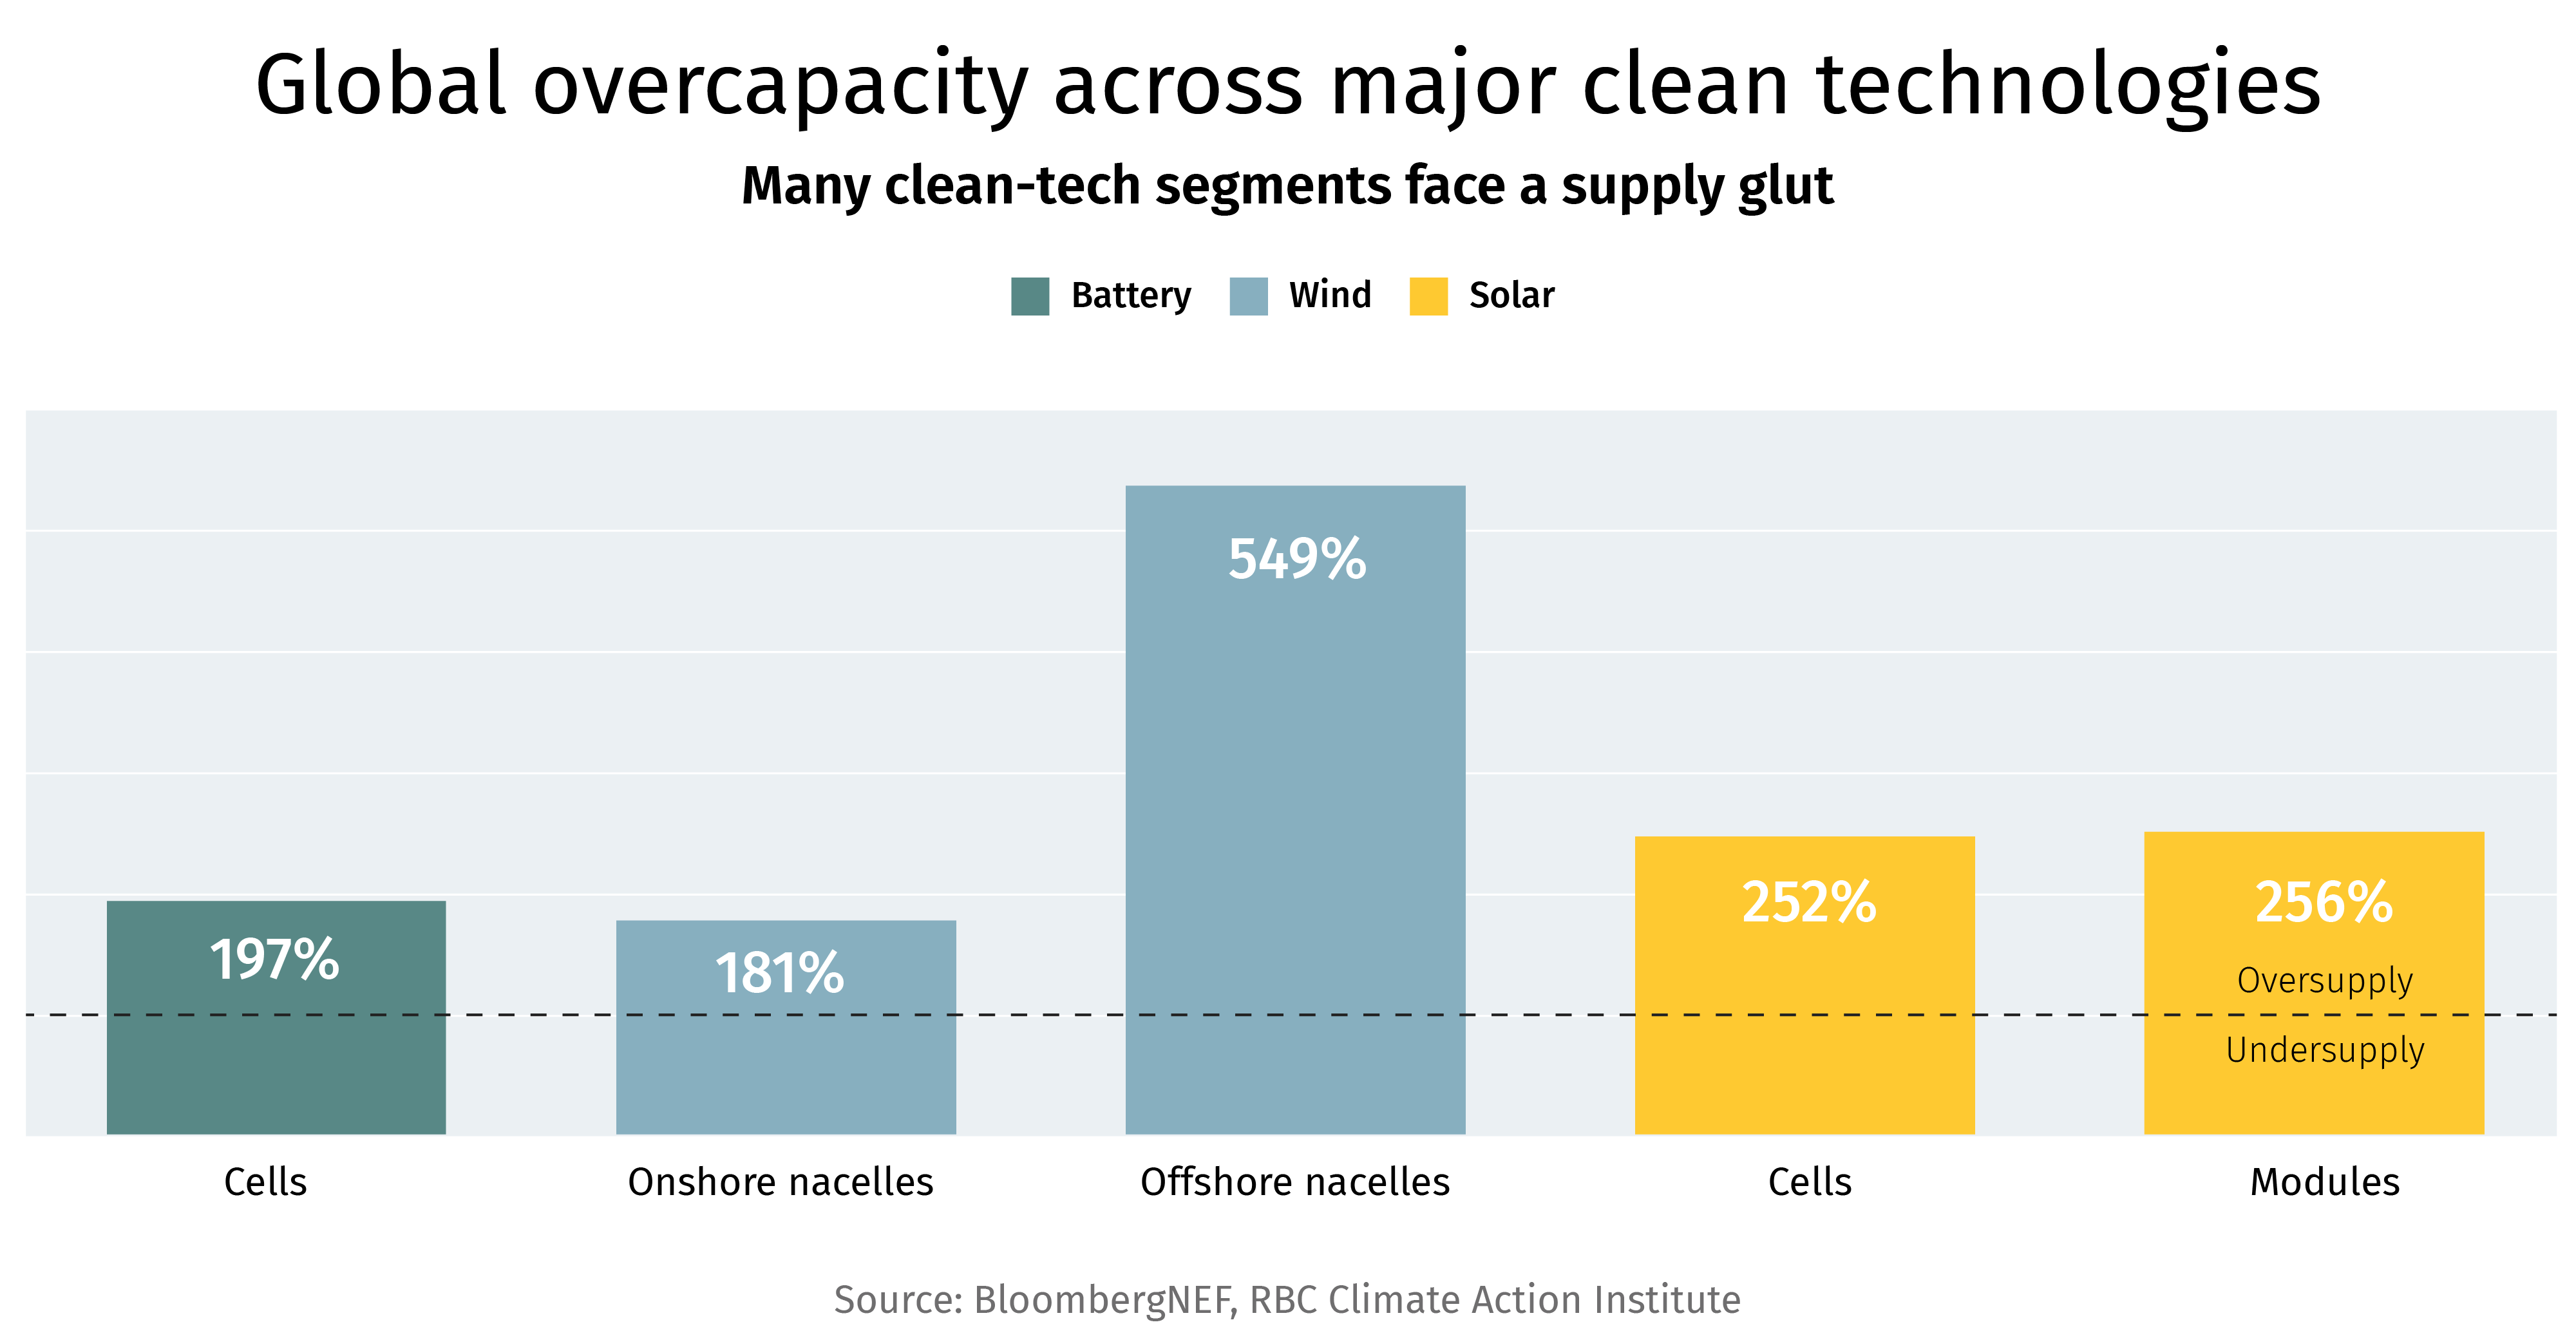
Global overcapacity across major clean technologies. Many clean-tech segments face a supply glut

Chinese producers carry a structurally lower cost of capital than peers—state backing and preferential financing, which in turn often generates and perpetuates overcapacity at a scale private markets cannot, and would not, sanction. This creates a self-reinforcing cycle of fierce domestic competition where only the fittest survive, resulting in a cost floor that continues to fall. If and when demand responds, China is best suited to gain incremental market share given the overcapacity. China has since tried to slow this competition through self-discipline agreements among manufacturers, but thus far has been unsuccessful.
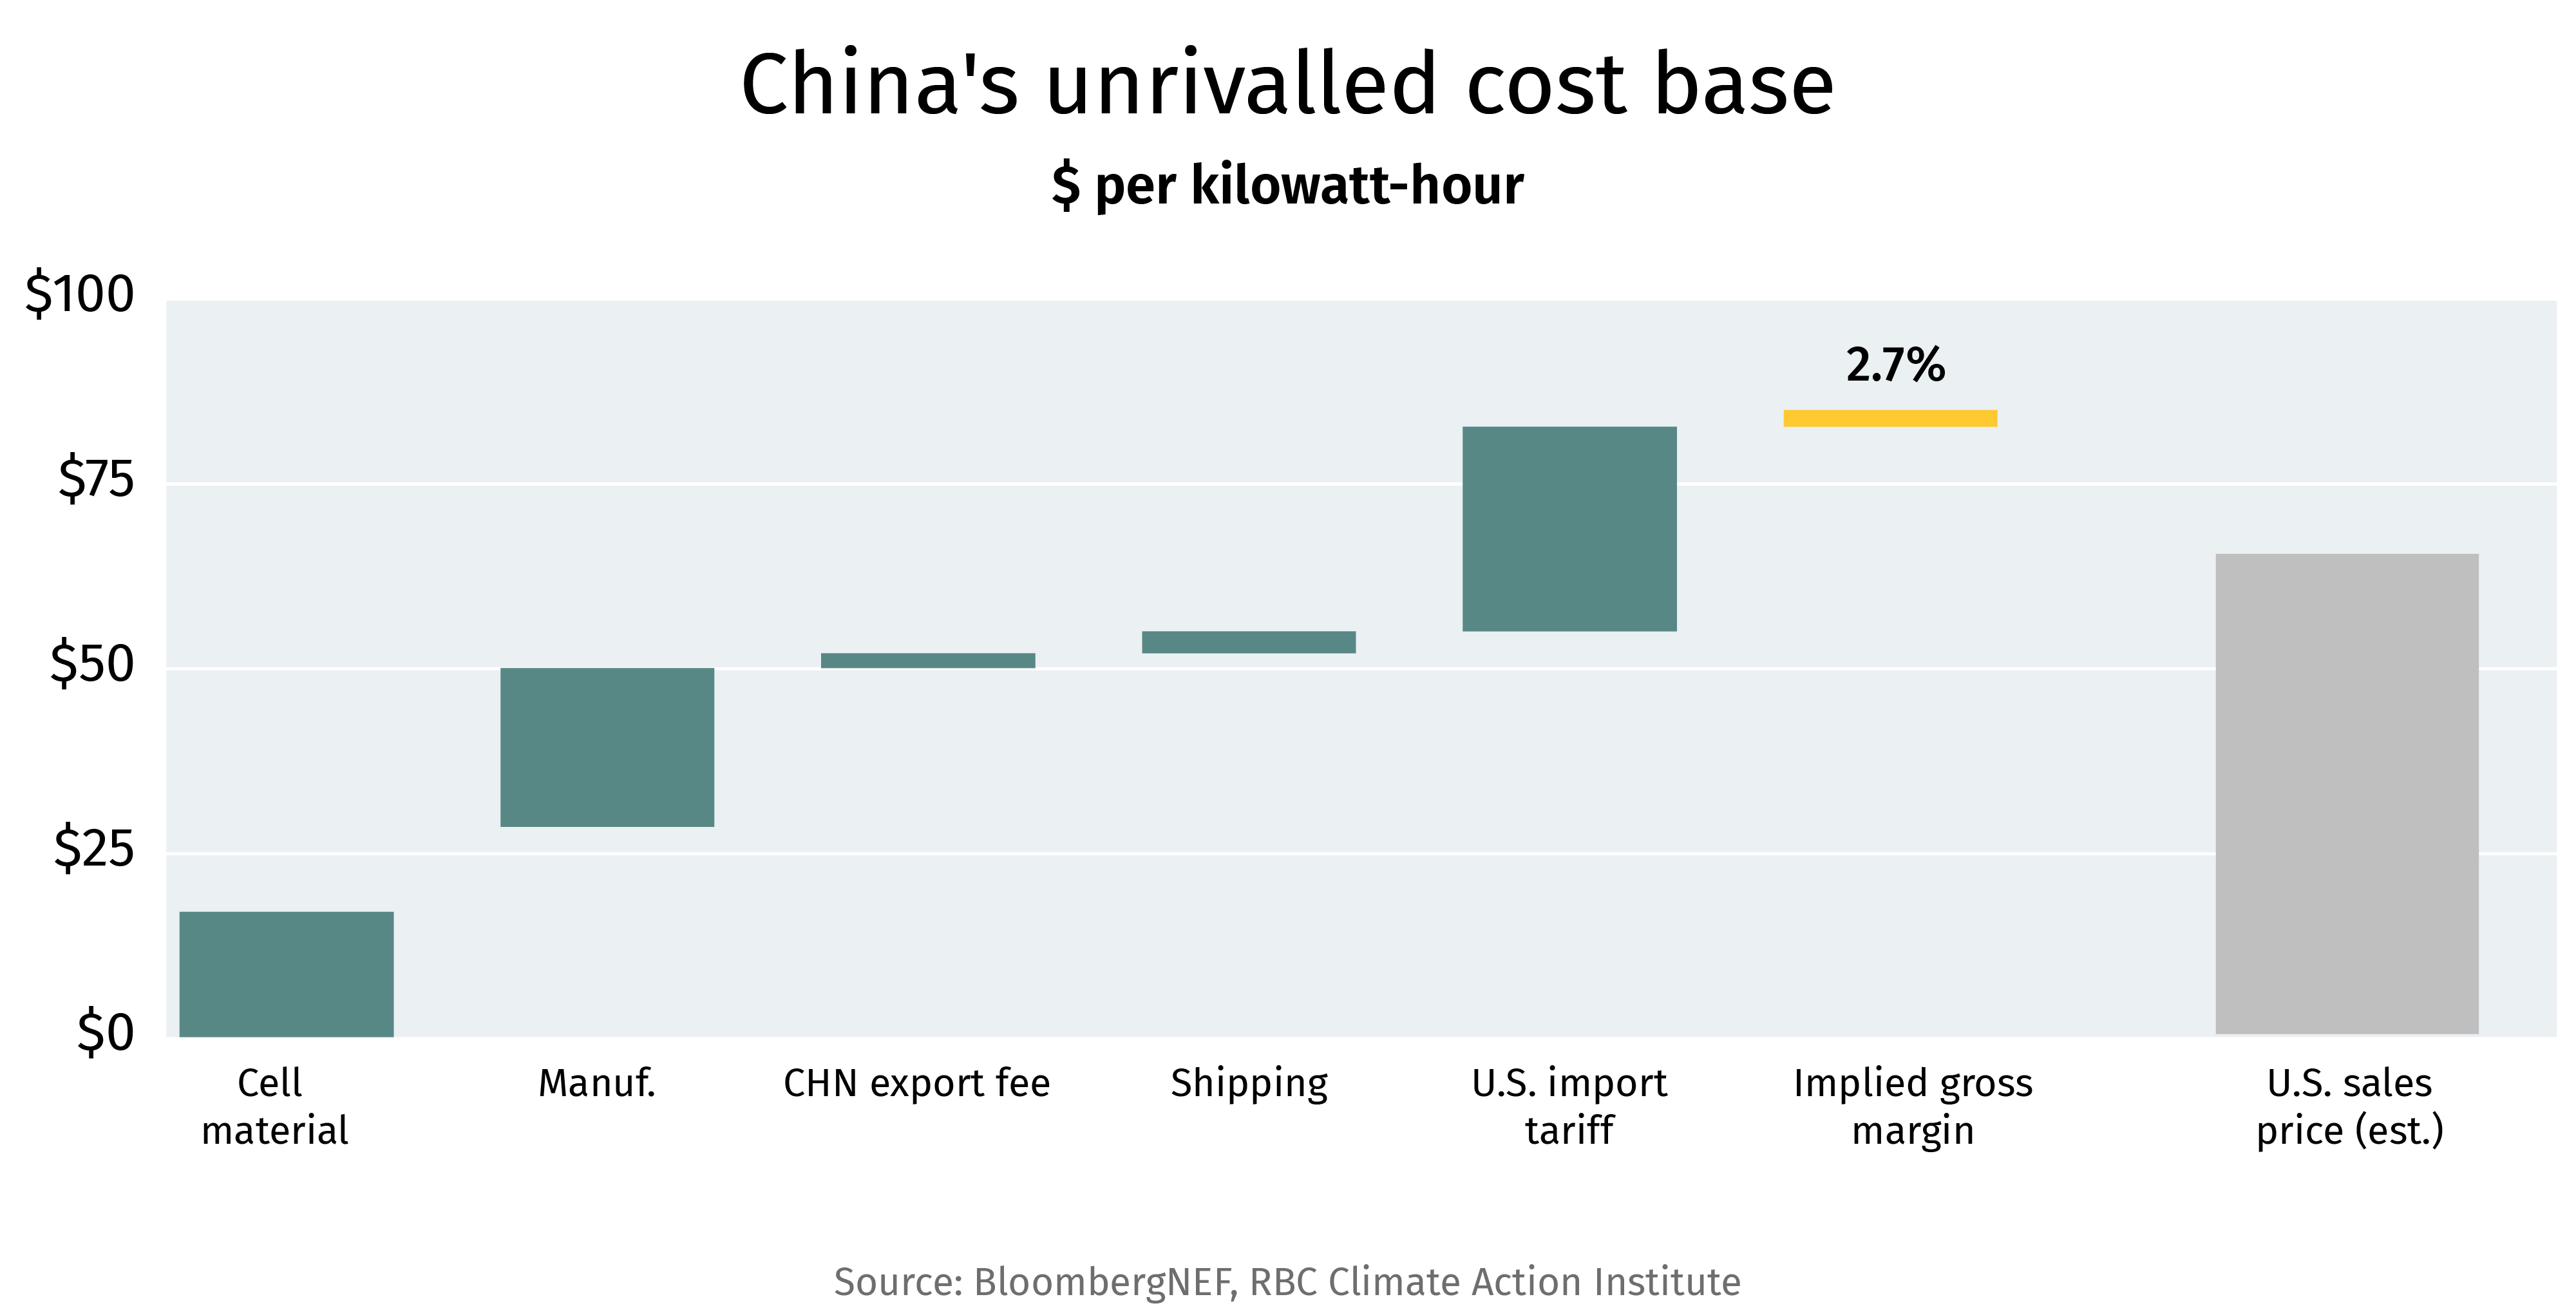
China's unrivalled cost base - $ per kilowatt-hour

Chinese cell materials and manufacturing account for less than US$50 of an US$84 per kilowatt-hour (kWh) delivered cost for battery cells sold into the U.S. The import tariff adds US$27/kWh—more than China’s entire manufacturing cost. Still, Chinese exporters earn a 2.7% margin.

By comparison, S&P Global estimates North American NCM811 (nickel-cobalt-manganese) battery cells cost roughly US$95/kWh, around 90% more expensive than Chinese battery cost. To put this into context, a Tesla Model Y Standard Range carries a 60 kWh LFP (Lithium Iron Phosphate) battery pack. At median Chinese LFP pack prices of US$81/kWh (as per Bloomberg NEF data), a similar sized battery would cost roughly US$4,900 ($6,500), or about 13% of the Model Y’s Canadian sticker price.
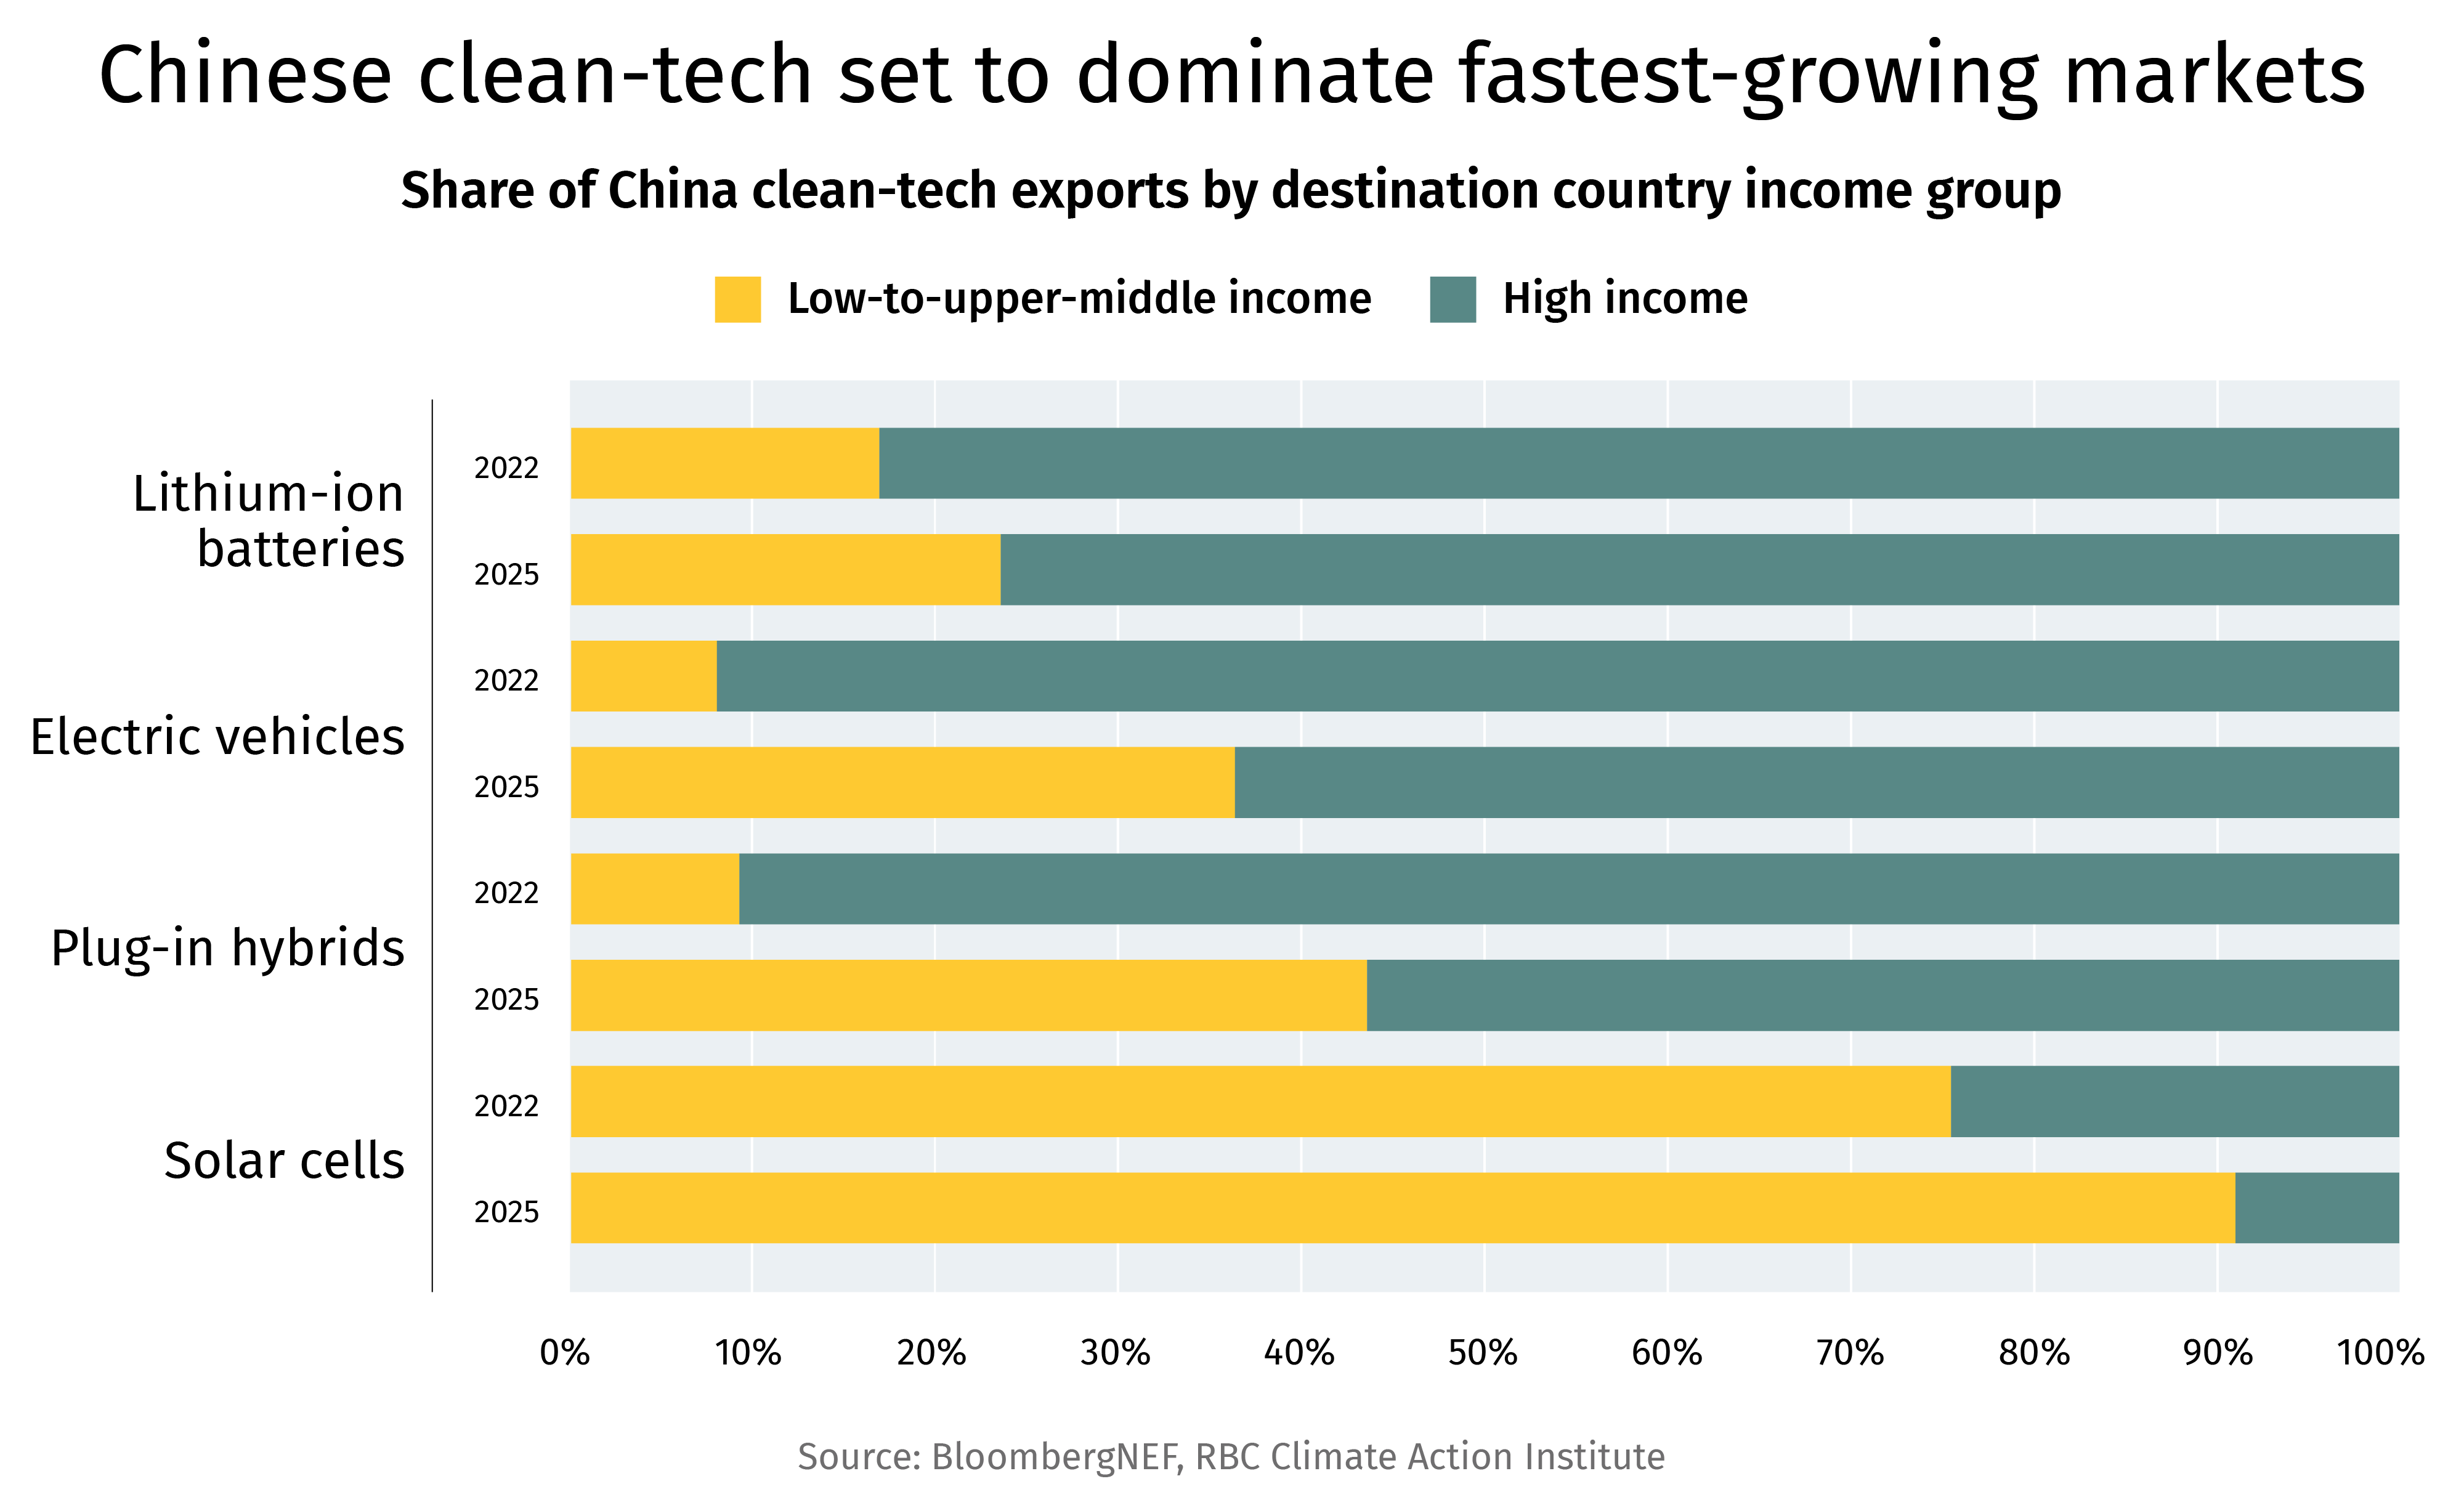
Chinese clean-tech set to dominate fastest-growing markets. Share of China clean-tech exports by destination country income group

While the West is often fixated with the higher cost of clean technologies, roughly 40% of China’s EV exports and over 90% of solar cell exports went to lower-income countries in 2025. China’s cost base has unlocked a category of clean buyer no Western producer will likely ever reach—fast-growing markets, concentrated in Asia, where clean energy adoption is accelerating rapidly.

Pakistan added 18.3 GW of solar in 2025 alone—75% of Canada’s entire installed solar and wind capacity to date—mostly imported from China. Adoption of EVs in Vietnam and Thailand—countries where nominal GDP per capita is less than $10,000—run north of 40% and 20%, respectively (Canada’s EV adoption in 2025 stands at 11%). Vietnam and Thailand do not provide fiscal incentives for the purchase of electric vehicles.
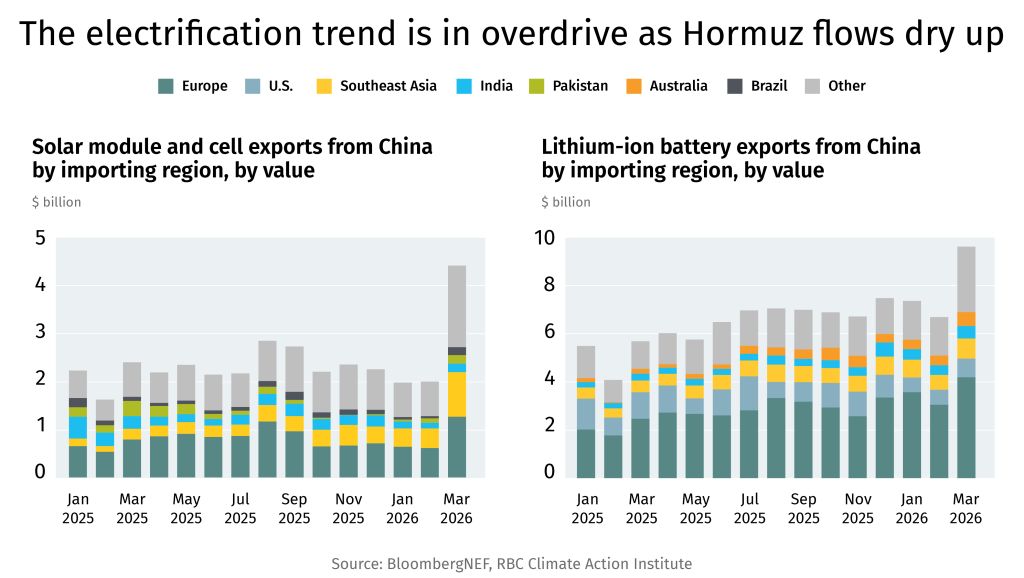
The electrification trend is in overdrive as Hormuz flows dry up. Solar module and cell exports from China by importing region, by value. Lithium-ion battery exports from China by importing region, by value

The Middle East conflict that choked the Strait of Hormuz brought the electrification trend into focus, with fossil-fuel importing countries accelerating their clean energy procurement.

As a result, Chinese battery exports reached nearly US$10 billion in March of 2026 alone, with Europe, Southeast Asia and the Middle East absorbing the volume. U.S. demand was just 8% of March exports.

The transition is happening on Chinese terms. South Korea and Europe have treated that as a sourcing and partnership question, rather than a binary one, and have advanced as a result. North America must also pursue strategies that find a balance between utilizing Chinese content but also building a domestic base that can compete and scale up to meet the opportunity offered by the global energy transition.

Canada’s Indigenous loan guarantee programs have totalled $1.8 billion across 26 deals1. While utilization remains low at 11%2, it is a meaningful start, reflecting deal complexity and a challenging macro environment.

A core gap exists as a first-mile problem, not a last-mile one. Guarantee programs activate at financial close. Many projects now central to Canada’s economic agenda require Indigenous participation well before that point— before commercial viability is established and long before a community could table a term sheet.

Current programs work best for contracted, rate-of-return assets. Over 80% of prior Indigenous equity transactions are in the power and utilities sector3, often smaller deals supported by dedicated procurement at the provincial level (e.g., power projects in Ontario).

Canada’s next project wave presents a risk profile these programs were never designed to manage on their own. This includes capital-intensive liquefied natural gas (LNG), higher-risk mining, and first-of-its-kind projects like carbon capture and small modular reactors.

Only experienced communities are realistically able to tap the programs. Middle-tier communities that are less transaction-ready remain structurally underrepresented; the programs’ current design risks only reinforces that gap.

Equity is not inherently equivalent to consent. Free, Prior and Informed Consent (FPIC) is a process of informed, voluntary decision-making; equity is a financial structure. Conflating the two creates pressure on communities that is counterproductive—and the regulatory environment reflects that distinction.

Canada is in the middle of a significant economic reorientation. A trade war with the United States, the emergence of new strategic partners, the demands of energy transition, and a renewed focus on sovereignty and security have produced a political consensus that the country needs to build, and build quickly. The federal government has set a target of $300 billion in additional non-U.S. trade over the next decade4. The Major Projects Office has referred 17 projects worth $126 billion for accelerated approval5. Loan guarantee programs at the federal and provincial level now represent more than $17 billion in combined authority to support Indigenous equity participation6. And the capital markets have broadly accepted that meaningful Indigenous partnership is not a regulatory checkbox—it is a condition of project viability.

These are genuine advances. But they share a common assumption worth examining: the tools, timelines, and structures being assembled around Canada’s major project agenda are built for the communities being asked to participate in them. That assumption is not wrong, but it is not always right either.

Indigenous communities are not passive participants waiting to be mobilized into Canada’s economic agenda. They are sovereign entities with their own economic priorities, their own definitions of what is an attractive investment, and their own timelines for building the institutional capacity complex transactions require. Communities generally want an equity interest in projects that serve them directly—assets that provide tangible, direct benefits to their members, that they feel genuine ownership over.

There is appetite among communities to own a share of a pipeline or an LNG terminal. But the nature of that ownership matters—a financial stake in a large (and perhaps distant) infrastructure project is not necessarily the same as owning assets proximate and community-relevant. The fit between the asset, the community, and the nature of participation matters—and it is not a fit Canada’s national project list was necessarily designed around.

This is the tension at the centre of Indigenous economic participation. A tension between two legitimate forms of nation building—Canada’s imperative to diversify its economy and build at scale, and Indigenous communities’ imperative to participate in ways that best serve their people—that overlap but do not always coincide. Given the majority of identified projects exist on or adjacent to Indigenous lands7, getting that overlap right is a key determinant in whether Canada is able to build over the next decade.

When Canada’s loan guarantee programs were announced, they generated genuine excitement—and genuine ambition. The federal program alone carries a $10 billion mandate8. Provincial programs in Alberta, Ontario, Saskatchewan, Manitoba and B.C. add another $7 billion9. Together they represent something Canada had not previously offered at scale: a systematic mechanism for Indigenous communities to access capital for equity participation in major resource and energy projects.

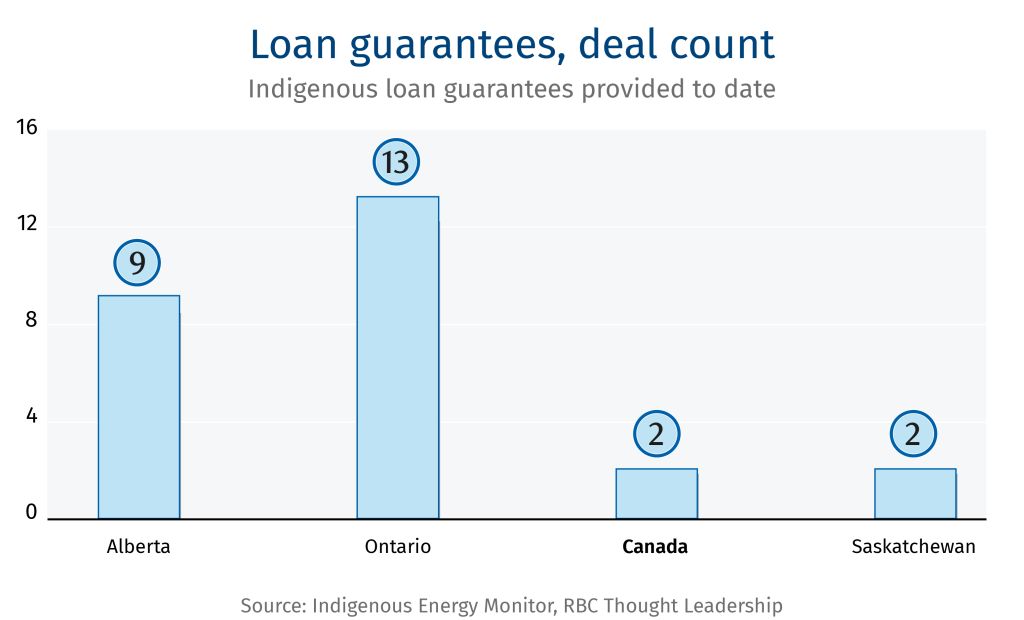
Number of Indigenous Loan Guarantees provided to date

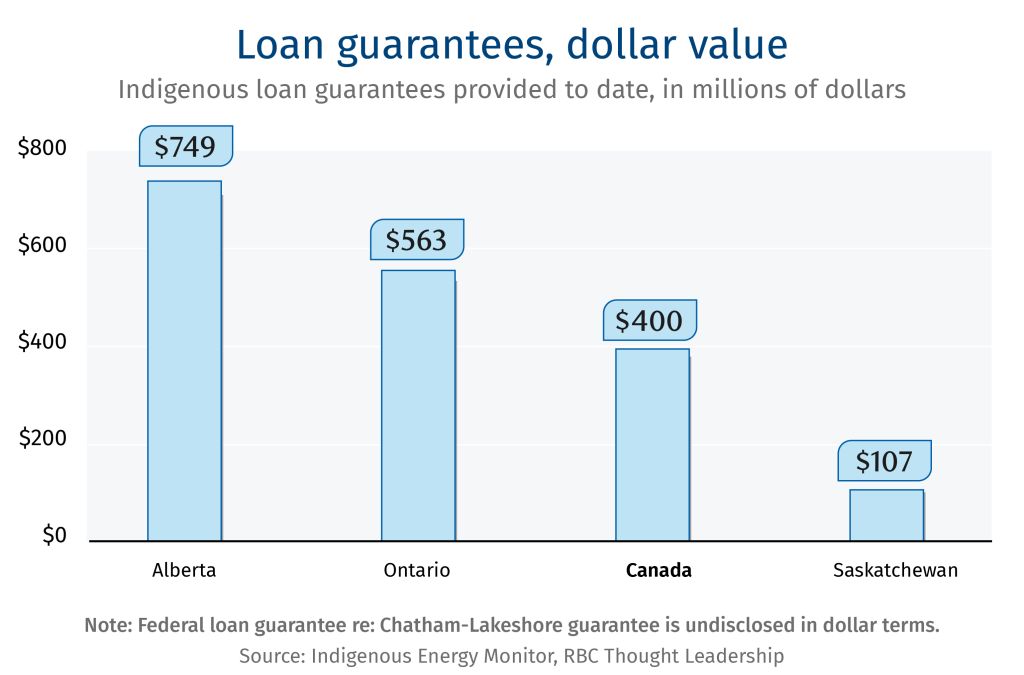
The utilization numbers, viewed in isolation, look modest. To date, 26 deals have been completed across four guarantee programs totalling approximately $1.8 billion deployed, or roughly 11% of combined program authority. Ontario leads by deal count: 13 deals valued at $563 million, running since 200910. Alberta leads by dollar value: 9 deals totaling $749 million since 201911. The federal program, the largest by mandate at $10 billion, has completed two transactions: a $400 million guarantee on a $740 million pipeline deal covering 12.5% of the Enbridge Westcoast system across 38 First Nations in B.C., and a second transaction involving a 20% interest in the Hydro One Chatham-Lakeshore line (dollar terms undisclosed)12. Saskatchewan has completed two deals worth $107 million13. Manitoba has also launched a program.

Indigenous loan guarantees provided to date in dollar value

But the utilization rate deserves context before it invites criticism. These are still young programs. Deals within the resources sector are complex, involving large consortia of communities, evolving project economics, leadership transitions, and trust-building that cannot be compressed by any government instrument. The current macro environment has added further drag: a trade war with the United States, tariff uncertainty, elevated interest rates, and commodity price volatility.

This context matters because it points to something important about what loan guarantees are, and what they are not. A guarantee is not a grant, not direct funding, and not free money. The guarantee is a mechanism that often makes loans possible in the first place, while also reducing the cost of capital by an estimated 50 to 150 basis points (anecdotal evidence suggests)—meaningful when Indigenous communities typically borrow 100% of the acquisition price to take an equity stake.

As such, projects are often rate-of-return assets such as power and utilities projects, transmission lines, and pipelines. Projects with contracted cash flows, predictable debt service, and limited commodity exposure are such that the risk of default is more manageable and protects taxpayer dollars. These assets also suit communities well; levelized, stable payments that can service 100% debt financing without exposing communities to unmanageable volatility.

But what happens when the risk profiles of projects change? LNG is vastly more capital-intensive. Critical minerals have greater commodity exposure and often no contracted offtake. Carbon capture, hydrogen and small modular reactors are still technologically emerging or first-of-its-kind. This risk profile is in stark contrast to the historical transactions seen to date.

According to data from the Indigenous Energy Monitor (IEM), the median Indigenous-owned project is valued at approximately $175 million, and only 15% of projects cross the $1 billion threshold. The Major Projects Office (MPO) portfolio sits in an entirely different weight class, and very likely moves the risk profile well beyond what a loan guarantee was designed to absorb.

Loan guarantees are, by design, a last-mile instrument—they activate when a transaction is commercially viable and a community is ready to close. However, many of Canada’s future resource projects could require Indigenous communities to participate much earlier in the development cycle, before commercial viability is established and long before a community could table a term sheet.

This can create a timing gap: programs activate too late when communities may need support upfront. This first-mile problem is arguably the most important gap in the current architecture.

Across the ecosystem—programs, financial institutions, proponents, and communities—five structural challenges persist that no single instrument, loan guarantee or otherwise, has resolved and yet is likely required for the next generation of Canadian projects.

1. The banking gap

According to the Bank of Canada’s Survey of Indigenous Firms, only 8% of Indigenous businesses use institutional loans as their primary financing source, compared to 31% of non-Indigenous small businesses. Similarly, loan approval rates run at 58% versus 90%, respectively. This remains a structural impediment.

Financial institutions are still learning how to operate in this space. Deals are still processed individually rather than through standardized templates. Syndication norms are still being established. Banks are not yet fully recognizing the strength of federal and provincial guarantees in the rates they offer Indigenous borrowers—in some transactions, spreads of up to 50 basis points (anecdotal evidence suggests) persists even under loan guarantees.

The friction is most acute in the $5 to $100 million range, where deals tend to be non-recourse, whereas mid-market commercial banking operates on a recourse basis. The rate structure often compounds this–prescribed fixed rate term loans could carry significant interest costs for communities that are 100% leveraged. More flexible structures including floating rates or shorter reset periods could meaningfully improve affordability.

2. The reach problem

The communities most actively using the guarantee programs tend to be those with prior deal experience—established investment arms, legal capacity, and existing lender relationships. These communities return to the programs repeatedly. The less experienced communities with limited institutional capacity are often left behind. Even when capital does flow, many communities lack the internal governance structures needed to manage it effectively. As such, program operators have made meaningful efforts to bring less experienced communities along through consortia structures, in an attempt to offset these structural challenges. Even here, proximity to attractive assets/opportunities remains a key factor.

Many Indigenous communities depend on federal and provincial transfers to fund basic services—housing, education, and healthcare. A persistent concern is that generating own-source revenue through an equity stake can, over time, trigger reductions in those transfers. This is most tangible during pre-revenue when distributions from an equity investment may not arrive for years (construction-stage). That gap is a real deterrent to participation.

Most importantly, Section 89(1) of the Indian Act shields the real and personal property of a First Nation or band situated on reserve from seizure or other enforcement by non-Indigenous creditors, making these assets largely unavailable as conventional collateral. No loan guarantee program, in its inherent design, can alter this core constraint; rather guarantees exist precisely because of it and shape every dimension of how communities engage with capital markets.

3. The scale mismatch

The programs face a structural problem at both ends of the size spectrum. At the small end, sub-$25 million deals are effectively uneconomic. Legal and structuring costs consume a disproportionate share of the benefit at smaller ticket sizes. Yet a meaningful share of Indigenous-owned projects sit in this range. The programs, as currently structured, cannot serve them ‘efficiently’.

With larger deals, capital commitments and risk tolerances are categorically beyond what current guarantee structures were designed to support. Coastal GasLink is a case in point: a 10% equity interest was offered to 16 Indigenous communities in March of 2022, the pipeline entered commercial in-service in November 2024, but the transaction has still not closed. It reflects the complexity involved in managing large consortia of communities across years of changing project economics, leadership transitions, and evolving deal terms.

4. The geographic and sector mismatch

Recently, guarantee programs have been most active in Western Canada, where established infrastructure, mature frameworks, and communities with prior transaction experience have created ideal deal conditions. In northern and northeastern Canada, however, where many critical minerals projects, such as lithium, nickel and graphite are situated, communities are often new to major project participation, are further from existing program infrastructure, and operate without the commercial relationships that western communities have had for decades.

Of 546 Indigenous-owned projects tracked by IEM, only 13 are in mining and minerals despite critical minerals being a stated national priority14. The historically preferred form of Indigenous participation in the mining sector has been royalties and revenue-sharing arrangements—structures that communities have negotiated effectively but are not captured in equity ownership data and are not supported by guarantee programs.

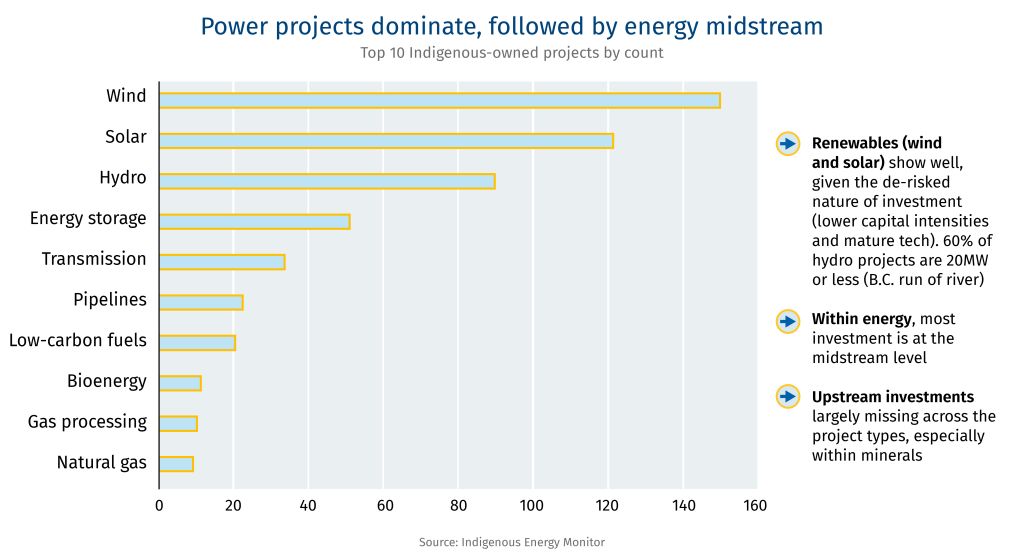
Top 10 Indigenous-owned power projects that dominate, followed by energy midstream

Renewables (wind and solar) show well, given the de-risked nature of investment (lower capital intensities and mature tech). 60% of hydro projects are 20MW or less (B.C. run of river)

Within energy, most investment is at the midstream level

Upstream investments largely missing across the project types, especially within minerals

The provincial map is also incomplete. Alberta, Ontario, Saskatchewan, Manitoba and British Columbia have large programs, but meaningful participation is lacking across other provinces. This compounds the geographic and sectoral gap. Generally, provincial support often moves quicker, better reflects regional resource priorities and can carry greater alignment between governments, proponents and local communities on the “acceptability” of desired projects—key benefits that are much harder for Ottawa to replicate.

Mainstream capital markets may have increasingly settled on Indigenous equity participation as a default measure of meaningful reconciliation and a proxy for project consent. Yet, Free, Prior, and Informed Consent (FPIC) is a process of informed, voluntary decision-making and equity is a financial structure. Conflating the two can create pressure on communities that is counterproductive: the sense that accepting equity means consenting to the project, or that declining equity means forfeiting a seat at the table.

Some communities genuinely prefer royalties, revenue sharing, or contracting as forms of economic participation without requiring communities to absorb project risk or service debt. These are legitimate structures that have worked effectively in the Canadian context and deserve to be treated as such. For higher-risk projects such as upstream mining or first-of-its-kind projects, equity is likely not the most appropriate form of project participation (excluding the possibility of investing in enabling infrastructure surrounding a project). Equity partnerships are better understood as a symptom of trust than a condition precedent to it—communities with trusted relationships with proponents move quickly.

No peer country has built a systematic framework for Indigenous equity participation in major resource and energy projects comparable to Canada.

The United States operates the Department of Energy’s Tribal Energy Financing Program with US$20 billion in authority for either direct loans or partial loan guarantees15. Only one transaction has closed to date16. Subsequent legislation rescinded most of the unobligated Inflation Reduction Act (IRA) funding, severely limiting available fiscal capacity.

Australia operates a statutory royalty-sharing system through the Aboriginals Benefit Account and Aboriginal Investment NT, which received a $680 million endowment at inception17. There is no government-backed loan guarantee for Indigenous equity participation in individual projects. Notably, over 57% of operating critical minerals mines sit on land where Indigenous Australians hold native title rights, but equity ownership in those projects remains limited18.

New Zealand’s Māori and Iwi have built diversified investment portfolios through Treaty of Waitangi settlements, with some Iwi now participating in large-scale infrastructure joint ventures with institutional partners. That institutional capacity has been built over thirty years of compounding settlement capital and governance development.

Canada’s combination of federal and provincial guarantee programs, complemented by targeted fiscal support from Canada Infrastructure Bank, Canada Growth Fund and First Nations Finance Authority, represents a more systematic approach than any of these jurisdictions have deployed.

The programs that exist are not necessarily failing–they are working within the parameters of what they were designed to do. The question is whether those parameters are sufficient to manage the scale, pace, and risk profile of development aligned with the federal government’s $300 billion aspirations—a next wave of projects representing a category of capital intensity and risk the current architecture was never designed to address alone.

A streamlined template for smaller transactions (sub $25 million) would bring the middle tier of communities into the system without requiring bespoke structuring processes that consume most of the economic benefit (a cited example is how agricultural loan programs operate with standardized terms, allowing banks to more easily process small ticket sizes). Smaller deals done at volume also build institutional knowledge on both the community and lender side that larger transactions can build upon.

Federal and provincial guarantees are not being fully recognized in the rates offered to Indigenous borrowers—at 100% leverage, that gap meaningfully reduces the distributions a community receives. Banks offering improved loan terms would reduce interest costs and improve cash flows.

The most successful multi-community transactions demonstrate that experienced Nations can carry less experienced ones through a process, absorbing negotiation overheads smaller communities cannot manage. Formalizing and resourcing that role would extend the programs’ reach without requiring every participating community to independently develop full transaction capacity.

Capacity investment ahead of the deal cycle is underutilized. Financial literacy training, governance preparation, and pre-transaction advisory support delivered as standing preparation (rather than triggered by a live deal) would move more communities to the threshold where program access becomes realistic.

Budget 2025 allows the Canadian Indigenous Loan Guarantee Program to use convertible debt (e.g. committed at construction, converted to equity once cash flows begin), and it could become the standard approach for greenfield participation. In other instances, creative structuring solutions where proponents can carry communities’ equity during construction (community investments are often 100% leveraged positions) are being explored.

On the incentive side, an Indigenous investment tax credit could directly improve the economics of Indigenous equity participation for proponents. Greater flexibility around stranded tax pools could similarly improve deal economics; Indigenous communities do not pay corporate tax and therefore do not benefit from traditional tax shields, but those benefits could be structured to flow to the corporate partner.

The most significant gap is at first-mile risk. Loan guarantees activate when a transaction is commercially viable but many of the projects needing Indigenous communities’ participation will require capital commitment well before that point. Difficulty in approving and permitting greenfield projects at times is partly a function of Indigenous participation arriving too late in the development cycle.

The use of convertible debt and conditional guarantees (guaranteed financing once key project milestones are reached) are meaningful progress on the timing problem. Still, closing that gap may require a dedicated instrument or facility willing to be first dollar in, absorbing early-stage risk that neither banks nor guarantee programs are designed to take on.

The Canada Growth Fund’s (CGF) role in critical minerals—providing patient sovereign capital to projects that markets alone would not finance—offers a potential model. A comparable mechanism oriented specifically around Indigenous participation in major projects does not yet exist. This would further complement the already existing layered capital stack from CIB financing, First Nations Finance Authority (FNFA) bonds and CGF equity.

Stonlasec8 and the Westcoast Pipeline | Federal | 2025

In July of 2025, Stonlasec8 Indigenous Alliance Limited Partnership—representing 38 First Nations in British Columbia—acquired a 12.5% ownership interest in Enbridge’s Westcoast natural gas pipeline system for approximately $736 million. The transaction marked the first loan guarantee issued by the federal Canada Indigenous Loan Guarantee Corporation. CILGC provided a $400 million federal guarantee, enabling the partnership to borrow at significantly reduced cost. The financing was structured in two tranches: the guaranteed senior secured bonds issued for $400 million notional, 30-year term, 4.517% coupon and a separate non-guaranteed senior unsecured bond issuance for $335 million notional, 30-year term, 5.168% coupon, demonstrating how the two instruments can sit alongside each other in the same capital stack. A fixed rate instrument protected communities from interest rate fluctuations over the life of the investment—a meaningful feature for communities that are 100% leveraged and depend on stable distributions.

Clearwater Infrastructure Partnership | Alberta | 2023

In December 2023, Wapiscanis Waseskwan Nipiy Limited Partnership—representing 12 First Nation and Métis communities in northern Alberta—acquired an 85% non-operating interest in Clearwater Infrastructure Limited Partnership for approximately $172 million, backed by a $150 million loan guarantee of the same size. Tamarack Valley Energy retained a 15% operated interest and committed to long-term take-or-pay volume agreements, providing the stable contracted cash flows that made financing viable. CEO-level commitment from Tamarack was central to the transaction. The deal performed well enough that a follow-on expansion closed in September 2024, adding approximately $51 million in additional midstream assets and bringing Bigstone Cree Nation into the partnership.

Wataynikaneyap Power | Ontario | 2024

In December 2024, Wataynikaneyap Power (51% owned by a partnership of 24 First Nations, 49% by Fortis Inc.) completed construction and successfully energized approximately 1,800 kilometres of transmission lines connecting 17 remote northwestern Ontario communities to the provincial grid. Total project cost was $1.9 billion, financed through $1.6 billion in federal support and $680 million in loans from a syndicate of five Canadian banks. Communities that had relied on diesel generation for decades gained access to reliable, lower-cost power. The project won multiple awards and is widely cited as having shifted industry norms, with Hydro One subsequently adopting a policy to offer First Nations up to 50% equity in new transmission projects over $100 million.

Cedar LNG | British Columbia | Under Construction

Cedar LNG is a floating liquefied natural gas facility under construction near Kitimat, British Columbia, within the traditional territory of the Haisla Nation. The Haisla Nation holds a 50.1% majority equity stake with Pembina Pipeline Corporation holding the residual 49.9% — making it the world’s first Indigenous majority-owned LNG export facility. Total project cost is approximately C$6 billion, financed through 60% asset-level debt and 40% equity, with the Haisla Nation funding its 20% equity contribution through the First Nations Finance Authority (FNFA) Agency in 2026—including the issuance of a sustainable bond ($350 million notional, 30-year term, 4.7% coupon) that won Environmental Finance’s Sustainability Bond of the Year. The facility will be powered entirely by renewable electricity from BC Hydro. Operations are expected in late 2028. Cedar LNG does not use a loan guarantee.

Nations Building: Assessing Indigenous loan guarantee programs in Canada’s new project wave - download the report

Download the report

What you need to know about the West’s struggle to break China’s dominant role in rare-earth elements refining—and the technologies that could break Beijing’s hold

The West has ceded critical minerals processing to China–and rebuilding that capacity in a way that is environmentally permittable, economically viable, and scalable within Western regulatory frameworks is a defining industrial challenge of the decade.

China controls 70% of the global refining market share for 19 of the world’s 20 most critical minerals; across minerals such as rare-earth elements that figure is north of 90%. This dominance is the compounding effect of three structural forces, each reinforcing the other over time.

Economics. China’s historically low labour costs, energy subsidies, and state-backed industrial policy built a cost structure that undercut Western processors at prevailing commodity prices.

Environment. Conventional rare earth processing relies on sulphuric acid baking, multi-stage leaching, and solvent extraction, generating toxic waste streams and radioactive tailings. According to a Harvard analysis, for every tonne of rare earth output, conventional processing produces roughly 2,000 tonnes of toxic waste. Western jurisdictions internalize those costs through permitting, environmental liability, and community opposition.

Industrial ecosystem. As China’s processing capacity scaled, it drew in engineering talent, downstream manufacturers, and end-use demand—each reinforcing the next. As Western processing retreated over the last 40 years, financial markets stopped funding, institutions stopped training, and downstream manufacturers defaulted to Chinese supply. China accumulated the opposite—four decades of process knowledge, engineering expertise, and refining IP that enforces a barrier to Western re-entry.

Rebuilding Western processing capacity by replicating China’s model runs into the same barriers that caused offshoring. Arguably it’s now compounded by China’s October 2025 export controls on processing equipment and technology. A more tractable path confronts the environmental liabilities of conventional methods directly—and in doing so, also improves the economics.

Grant and procurement decisions offer a reasonable proxy for which processing approaches have cleared basic viability thresholds. The U.S. Department of War, Department of Energy, and the Government of Canada have directed meaningful capital toward next-generation critical minerals processing since 2022.

Waste and tailings. New processing approaches—including flash heating and modular ion-exchange systems—substantially reduce or eliminate waste streams, making projects permittable where conventional processing would not be.

Canadian firm Ucore Rare Metals is a case in point. Its RapidSX platform is a column-based solvent extraction system for rare earth separation that runs approximately three times faster than conventional mixer-settler systems, with a smaller physical footprint and no Chinese equipment or technology. The U.S. Department of Defense (DoD) awarded US$4 million for Ucore’s Kingston, Ontario, demonstration facility, followed by US$18 million toward its Louisiana Strategic Metals Complex. The Government of Canada committed $36 million at the G7 resource ministers meeting in October 2025 to support refining of samarium and gadolinium.

Emissions. Decarbonizing processing is mainly a question of energy source: replacing fossil-fuel-fired kilns and furnaces with electrically powered alternatives—particularly hydro or other clean sources—solves the emissions problem and improves economics given falling clean electricity costs. Most global critical mineral refining runs on coal-heavy Chinese grids. Processing on hydroelectric power, as Quebec offers, materially changes the emissions profile of the same output.

Australia-based Metallium Resources Inc. is working on a solution to transform metal recovery and recycling waste through flash joule heating—millisecond electrical pulses to heat material above 3,000 degrees Celsius, extracting metals selectively without acid or water. The U.S. DoW provided an initial gallium-focused grant and selected the technology as a processing step in a DoW-funded red mud recovery project in Louisiana. Metallium’s Texas demonstration plant has been commissioned, with feedstock supply secured through a binding agreement with commodity firm Glencore plc.

Recycling. The IEA finds recycled energy transition minerals such as nickel, cobalt, and lithium produce on average 80% fewer greenhouse gas emissions than primary mined material. Recycling rates for rare-earth elements and lithium remain below 5% globally, yet feedstock is accumulating fast: spent EV batteries, end-of-life wind turbine magnets, and electronic waste from AI infrastructure all carry recoverable critical metal content.

The EU has institutionalized recycling demand through binding regulation. Under EU Battery Regulation 2023/1542, manufacturers face minimum recycled content requirements. These are enforceable compliance thresholds—not targets. They create a structural demand signal for recovered materials that current processing infrastructure cannot meet.

ReElement Technologies is aiming to turn scrap into mining stock. A subsidiary of American Resources Corp, ReElement runs a modular ion-exchange and solvent-based refining platform processing rare earth magnet scrap and lithium-ion battery black mass into high-purity separated products. The platform accepts multiple feedstock types without Chinese primary concentrates. ReElement has received DoD and Department of Energy funding as part of the U.S.’s effort to establish domestic rare earth and battery metal refining capacity.

Challenging China’s rare-earth refining dominance will take time, but the funding of experimental technologies, backed by policy focus and support, suggests that the transition is finally underway.

Critical Minerals Processing: The West’s Refining Challenge and the Technologies Closing the Gap - download the report

Download the report

Oil and gas markets are reeling as the Iran war chokes off production in the Middle East, with its impact reverberating across the world. As energy supply chains get fractured and prices become volatile, we examine the emerging trends defining this new era of global energy insecurity.

  • Alternative Middle East export routes have limited capacity of 3.5 to 5.5 million bpd.

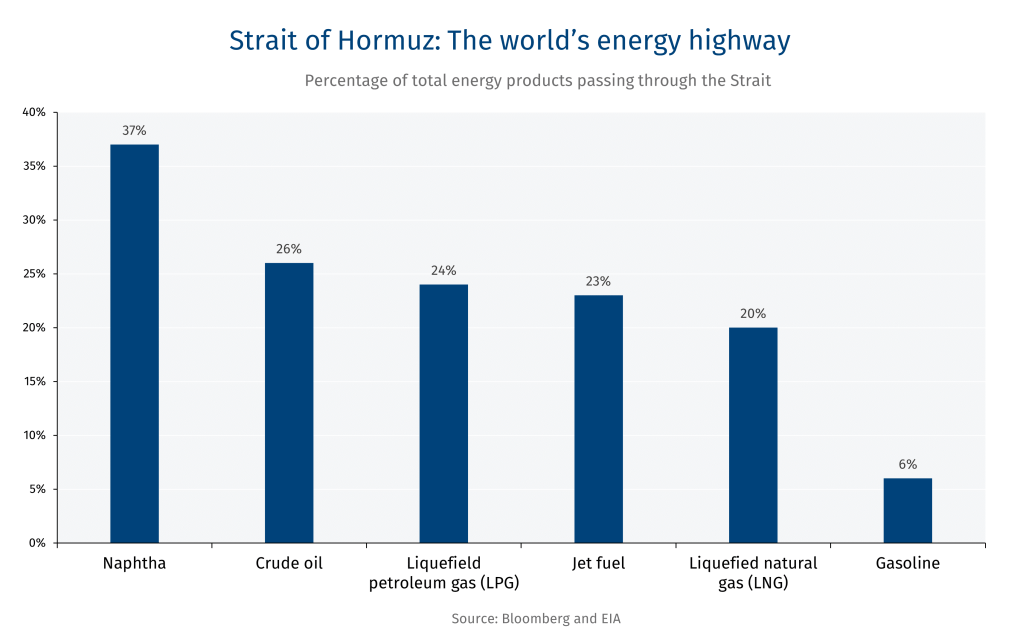
  • The 54-kilometre waterway handles 20 million barrels per day (bpd) or 20% of global oil supply. Only the Strait of Malacca, in Southeast Asia, handles more crude oil.

  • Close to 93% of Qatar’s LNG exports transit through the Strait—19% of global LNG trade.

Strait of Hormuz: The worlds' energy highway
  • Japan was the first country to announce the release of oil from its reserves as part of the International Energy Agency-coordinated action, injecting 80 million barrels in the market.

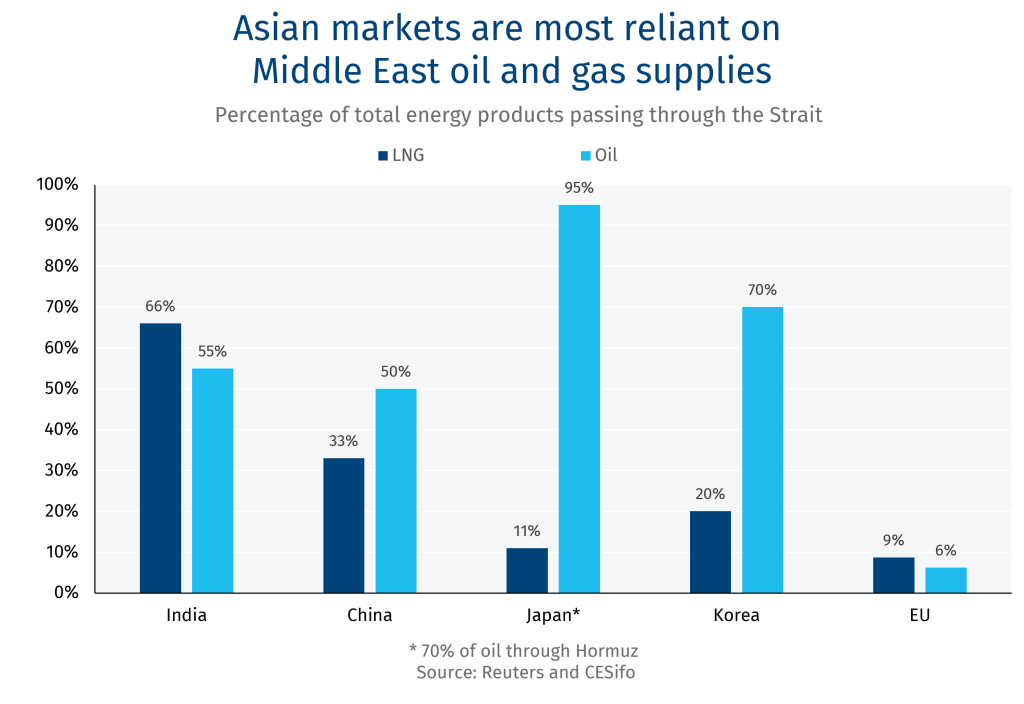
  • The U.S. is allowing India to buy Russian oil as a stop-gap measure—as New Delhi scrambles to find alternatives for some of the 2.5-2.7 million bpd it sources from Iraq, UAE, Saudi Arabia and Kuwait.

  • The U.S. has exempted Russian oil from sanctions for at least 30 days—weakening Western efforts to support Ukraine in its war against Russia.

Asian markets are most reliant on Middle East oil and gas supplies
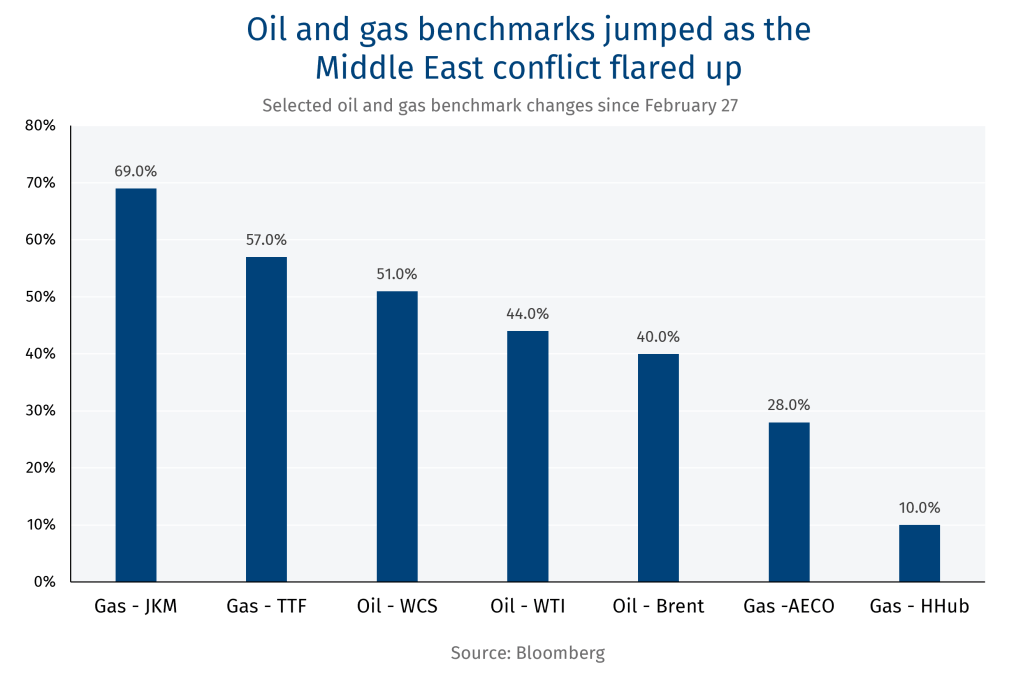
  • LNG Japan/Korea Marker (JKM) jumped the most, underscoring Asian dependence on the Strait.

  • The crisis has erased a looming LNG supply glut, with Europe Asia scrambling for supplies.

  • Oil prices remain volatile, vacillating between US$76-119 per barrel over the past week.

Oil and gas benchmarks jumped as the Middle East conflict flared up
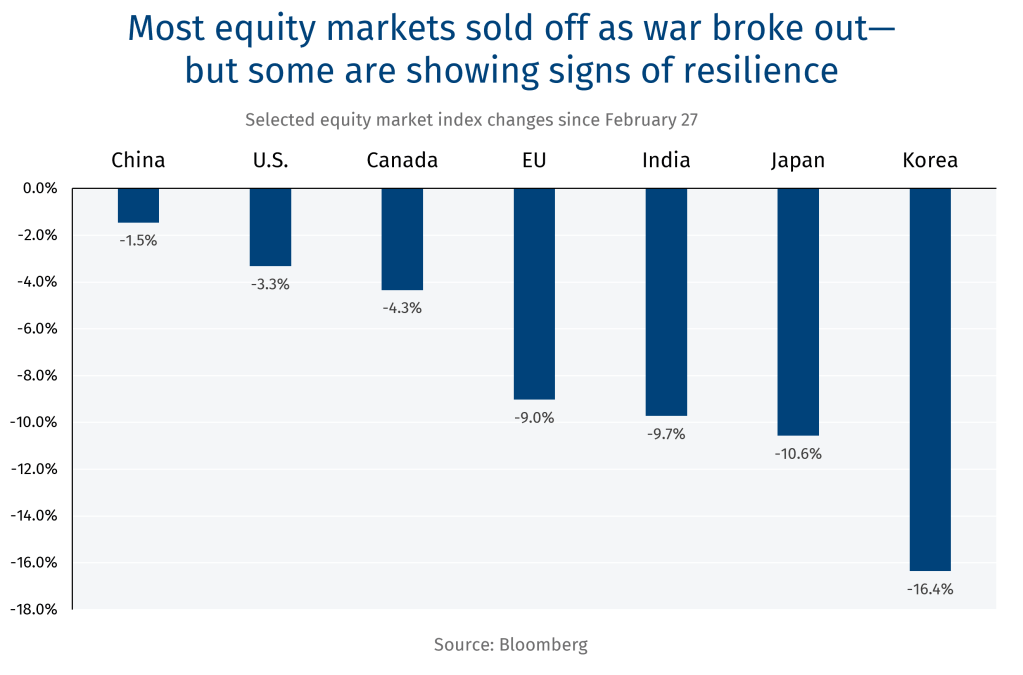
  • The Korean and Japanese stock market sell-off is reflective of energy exposure but also above-average year-to-date performance pre-crisis.

  • China’s estimated 100-day oil import cover has shielded its stock market from a severe downturn.

  • U.S. and Canada markets have been structural winners in the reallocation of global equities.

Most equity markets sold off as war broke out - but some are showing signs of resilience
  • While North America’s net exporter of crude oil, the global structure of oil markets has not spared the American economy

  • A recent Washington Post/CNN poll shows about 7 in 10 American voters are “very” or “somewhat” concerned that the Iran war will send oil and gasoline prices higher

  • Higher gasoline prices would be a key datapoint for the U.S. administration as it plots it next move.

The U.S.-Israel war on Iran immediately hit American wallets as prices at the pump spiked
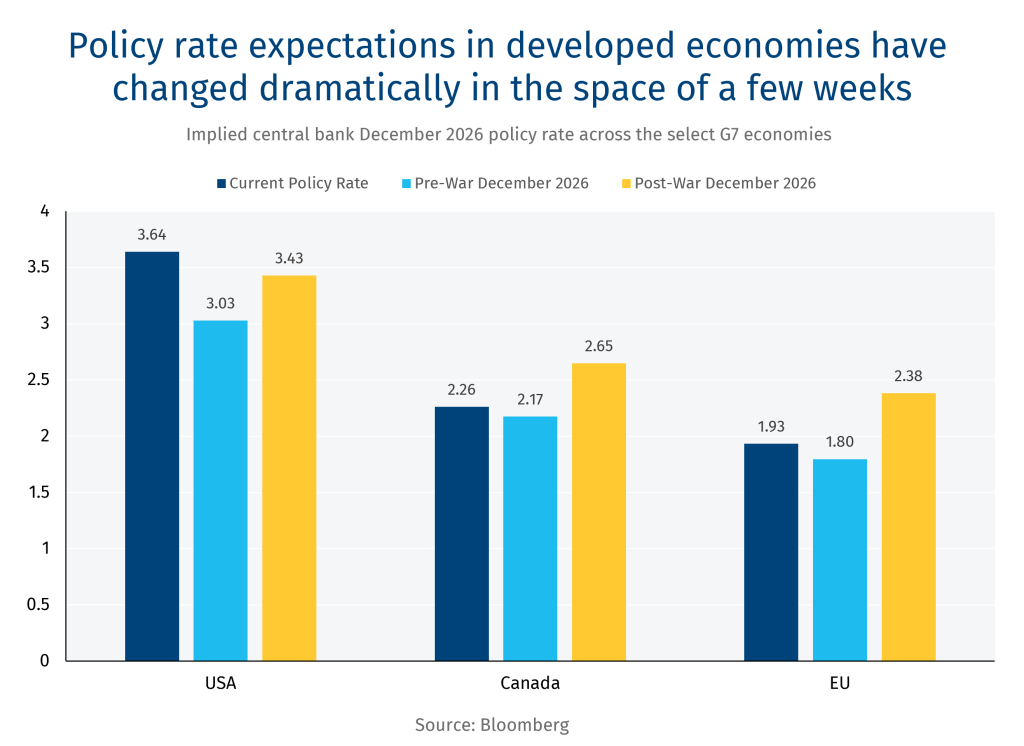
  • Across Canada, the U.S. and EU, the expectation was an easing of monetary policy as the year progressed—but it has reversed on fears of higher inflation.

  • A sustained US$80 oil could raise inflation from 2.2% to 2.5% in Canada, according to RBC Economics.

  • Similarly, the U.S. would see an increase from 2.7% to 3.1% at US$80 per barrel.

Policy rates expectations in developed economies have changed dramatically in the space of a few weeks
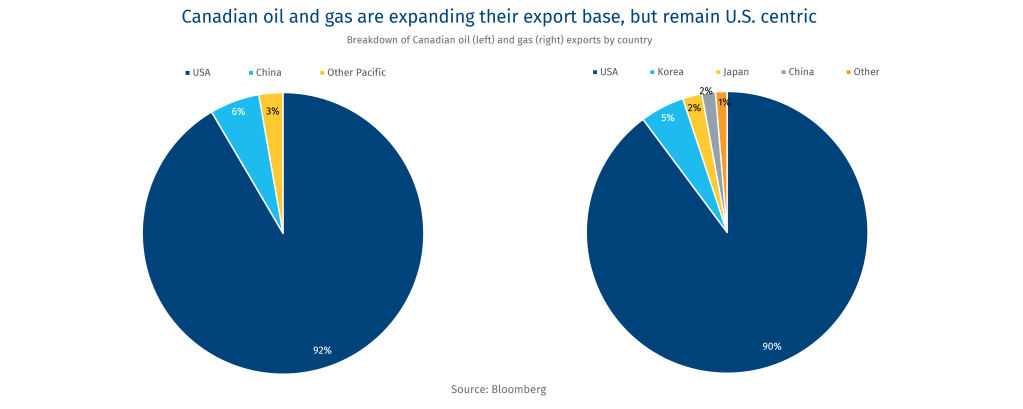
  • China has been Canada’s biggest non-U.S. oil export destination—which could grow further as relations with Beijing improve.

  • South Korea has been the primary destination for Canadian LNG to date.

  • Over the long term, Canada could likely serve a more meaningful role in de-risking Asian supply.

Canadian oil and gas are expanding their export base, but remain U.S. centric
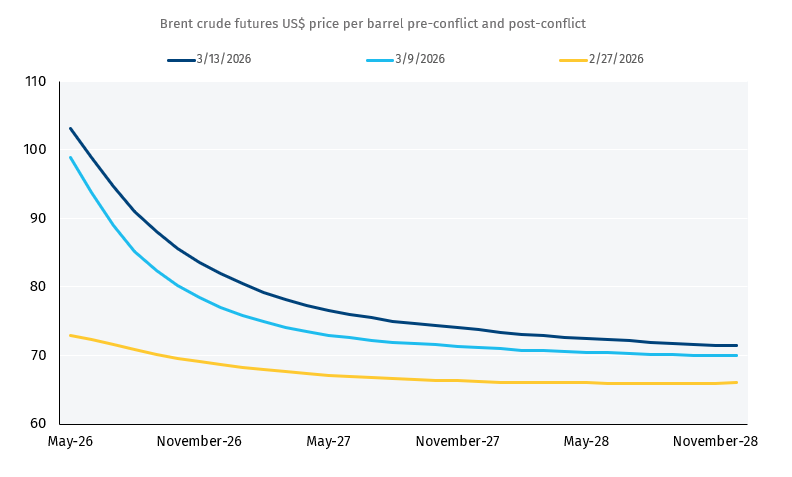
  • Around 8 million barrels per day of crude and 10 mbd of liquids production in the Middle East is reportedly shut in with the Strait of Hormuz at a virtual standstill, according to the International Energy Agency.

  • Despite International Energy Agency members planning 400-million-barrel injection into markets, the price trajectory would likely depend on the U.S.’s ability to ensure the security of the Strait of Hormuz.

Brent Future curve suggests oil prices will remain higher for longer

This year’s Prospectors & Developers Association of Canada (PDAC) event in Toronto was abuzz with talk of Canda’s critical mineral riches and the speed at which they can be brought to global markets—at commercial scale. The industry is enthusiastic, the government supportive, but there is a long way to go to realize Canada’s mining potential. Here are seven themes that we observed at the event.

The U.S. and Canada approach critical minerals from materially different strategic frameworks, and that divergence has consequences for bilateral cooperation.

The U.S. framing is one of industrial decay and national security emergencymanufacturing surge capacity, weapons systems dependency, and concerns of China outpacing American armament production capacity by a factor of five to six. Within that frame, critical minerals are not a supply chain optimization problem but rather a symptom of a broader hollowing out of American industrial capability that extends to smelters, chemical processing, and advanced manufacturing.

Canada’s framing has been more “narrowly” commercial—a supply chain opportunity, a geological advantage to be monetized, and a seat among allies to be secured.

That gap in threat perception creates friction with an expectation the U.S. is (or at least will be, over time) operating on a more binary logic—alignment or non-alignment—while Canada has positioned itself as a middle power seeking rules-based multilateral cooperation.

Whether Canada narrows that perception gap—or develops an independent strategic rationale grounded in its own economic security interests—will likely impact how “seriously” it is taken at the bilateral table as the Canada-United States-Mexico trade deal review evolves.

Canada’s geological endowment is enviable, but extraction without downstream processing is increasingly seen as less than ideal. Yet, the economics of building processing capacity in Canada are deeply unfavourable.

Anecdotally, conversion costs for lithium spodumene to cathode-grade material run roughly twice what they are in China and at times in Latin America. Global copper smelter margins are often 2–5%, if not simply breakeven. Canada has closed multiple smelters over the past fifteen years. Even in China, the rare earth refining industry has not earned its cost of capital in three decades—arguably the watermark against which any new entrant must be measured.

These margins do not support private sector investment at scale without intervention. We heard overwhelming agreement that state capital needs to function as first dollar in, last dollar out on processing infrastructure. The buyers’ club concept—pooling G7 demand and stabilizing prices when they are depressed—addresses part of this problem, but the governance and trust architecture to deploy that capital at scale remains unresolved.

The bilateral/plurilateral distinction that emerged from the sessions as it relates to the U.S. view of a buyers’ club—supply sourced bilaterally, but demand aggregated multilaterally—sounds like burden-sharing but warrants scrutiny. This architecture is in essence the U.S. acquiring mineral supply on its own terms, stored on U.S. soil and then asking allies to aggregate demand around what is effectively American strategic inventory. Put plainly: Buy American.

Nations’ tendencies to operate in self-interest in a scarcity scenario is precisely the reason for Project Vault’s domestic storage requirement. Still, for other nations like Canada, the risk is being a favoured supplier with no guarantee of preferred access when it matters most. Such asymmetry, hopefully, can be negotiated.

If there is one commodity where the investment thesis is most favourable, it is copper. The convergence of AI infrastructure buildouts, electrification, defence procurement, and grid expansion has created a demand profile that generalist investors can underwrite without relying on policy-dependent assumptions.

Yet even with this enviable demand profile, there is strong consensus of a growing shortage of copper supply, still. As it relates to Canada, copper may be the most realistic near-term entry point through which broader mining investment, including in associated polymetallic deposits, gets unlocked, solving many of the “more traditional” less niche, mining development challenges.

At its simplest, sustainable long-term demand secures supply chains. China built its critical minerals dominance through civilian demand—electric vehicles, wind turbines, batteries—at a scale that justified refining investment and created learning curve advantages that now make its processing margins tough to compete against.

The strategic paradox facing North America is attempting to construct supply chains for critical minerals while simultaneously pulling back on the civilian demand drivers to justify that investment. Without a credible domestic demand signal, processing facilities face uncertain offtake, and without offtake, project finance is unavailable. At present, alternative anchors such as defence and AI/data centres is expected to be the near-term catalyst, but the sheer size of the total addressable clean energy demand is one that better captures the attention of longer-term, more generalist investors.

Treating 30-plus minerals as a single policy strategy ignores the complexities of each metal’s supply chain. The genuine policy problem is in niche commodities where Canada punches above its weight—rare earths, scandium, tungsten, graphite, nickel and possibly lithium—where markets are either small, opaque, and/or structurally dominated by a single producer (often China).

A strategy focused on five to eight minerals with a clear demand anchor is viewed as more executable and more credible from an effective strategy than a broad-based approach. If oriented successfully, this will have positive spillover effects on the procurement of the types of skills and human capital associated with the greater strategy, such as rare earth separation, hydrometallurgy, and advanced processing requiring specialization unreplicated through equipment procurement alone. The expertise that exists across the G7 countries is an untapped potential.

The Major Projects Office represents a meaningful shift toward facilitation of these projects. Brownfield expansion is the near-term opportunity while Indigenous partnerships, structured early with genuine economic participation, is consistently the most effective accelerant to mitigate permitting and financing risks.​​​​​​​​​​​​​​​

Roughly $1 in $10 in Canada’s mining sector has been directed towards pure-play critical mineral development over the past 25 years. The majority of the $700+ billion raised in Canadian mining equity and M&A has poured into other metals, with gold and precious metals accounting for 70% alone. In contrast, Australia directed twice that amount over the same period.

Critical minerals are finally attracting a bigger share of mining investment. Around 67 critical minerals projects—representing about half of all active mining proposals—are currently planned, proposed, or under construction, with a potential investment of $72.4 billion by 2034, according to the Major Projects Inventory.

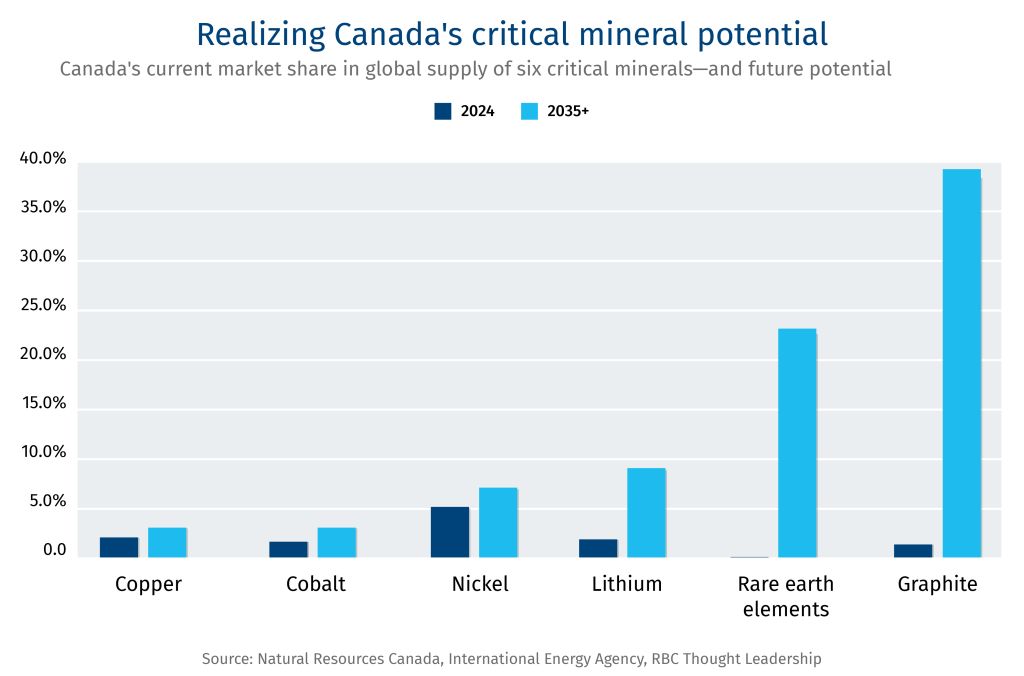
Canada could account for 14% of the global supply across the six key critical minerals by 2040. Current Canadian production of six core critical minerals, cobalt, nickel, lithium, copper, graphite and rare earth, is on average 2% of global supply. It could rise to 14%, on average, at full capacity if identified projects come on stream, the Canadian government estimates.

However, Canada lacks a strong base of well-capitalized domestic players. Only 19% of Canada’s publicly listed S&P/TSX Composite mining firms are diversified miners, compared to two-thirds of Australia’s S&P/ASX 300 mining index. To reach its goals, Canada will likely need to continue relying on international mining companies and foreign investors.

Two decades of capital allocation decisions have stunted critical minerals’ growth. Canada remains largely a “mine-and-ship” jurisdiction when it comes to critical minerals—with much of the value add and refining picked up by China and other players who have captured the refining segment, and further developed ancillary supply chains, such as electric vehicle, electronics and defence industries.

Despite trade tensions, there are still signs of U.S.-Canada capital alignment. Under President Donald Trump, the U.S. has invested an estimated US$135 million in direct equity stakes in Vancouver-based companies Trilogy Metals and Lithium Americas Corp., in addition to a US$2.3 billion bridge loan for Lithium Americas. It will be unlikely the U.S. can (or wishes to) completely phase out Canada from North America’s critical mineral ecosystem.

Canada faces a critical minerals capital crunch. The absence of patient, risk capital severely impedes the country’s ability to support both Canada and other Western nations in their efforts to move their critical mineral supply chains away from China.

Realizing Canada's critical minerals potential

That capital is needed for Canada to take advantage of the critical minerals industry that’s projected to grow between two to three times globally with a capital requirement of US$500-600 billion by 2040, according to an International Energy Agency forecast. Global demand for six core commodities—cobalt, copper, graphite, lithium, nickel and rare earth elements—will be driven by several growth sectors, including electric vehicles, clean energy infrastructure and space. As well as strategic sectors such as defence, manufacturing and electronics.

Canada holds world-class geology across all six metals but remains a relatively marginal player, accounting for roughly 2% of the global supply of the six metals. If identified projects proceed at full capacity, it could climb to 14% of total supply over the next 15 years, on average, according to Canadian government estimates. The development of vertical supply chains such as an expanded advanced manufacturing base, could have an exponential impact on Canadian supply to meet domestic and international demand.

Yet, Canada remains largely a “mine-and-ship” jurisdiction. Raw metals are shipped mostly to China where they are refined and transformed into high-value components. It’s the result of two decades of capital allocation decisions and the lack of a robust national strategy, but also China’s ability to depress metal prices to crush competitors.

There’s considerable global momentum to propel the Canadian critical minerals industry forward. The U.S. is leveraging its funding, market mechanisms and guarantees to build out a critical minerals market that excludes China. Meanwhile, Europe and several G20 allies are eager to diversify their critical minerals supply chain as they fear the Chinese industrial machine will crush their domestic economies and leave them ever more beholden to Beijing.

China’s recent export controls on key minerals—including rare earths, graphite, gallium, germanium—over the past year are a clarion call for Western countries to act.

Among its G7 allies, Canada is best equipped to take advantage: it’s home to high-grade lithium belts and graphite deposits in Quebec and Ontario, globally significant nickel resources in Manitoba, formidable copper reserves in British Columbia, and rare earth elements in pockets across Canada, including Newfoundland and Labrador. Few countries can claim this breadth across all six critical minerals at scale.

We have identified five structural pressure points that explain why Canada’s critical minerals sector remains undercapitalized, and why market forces alone will not correct the imbalance. Closing the gap requires a coordinated public-private agenda anchored in sovereign co-investment, infrastructure financing, miner-driven shared processing corridors and integration into Western supply chains.

1. The loss of national champions

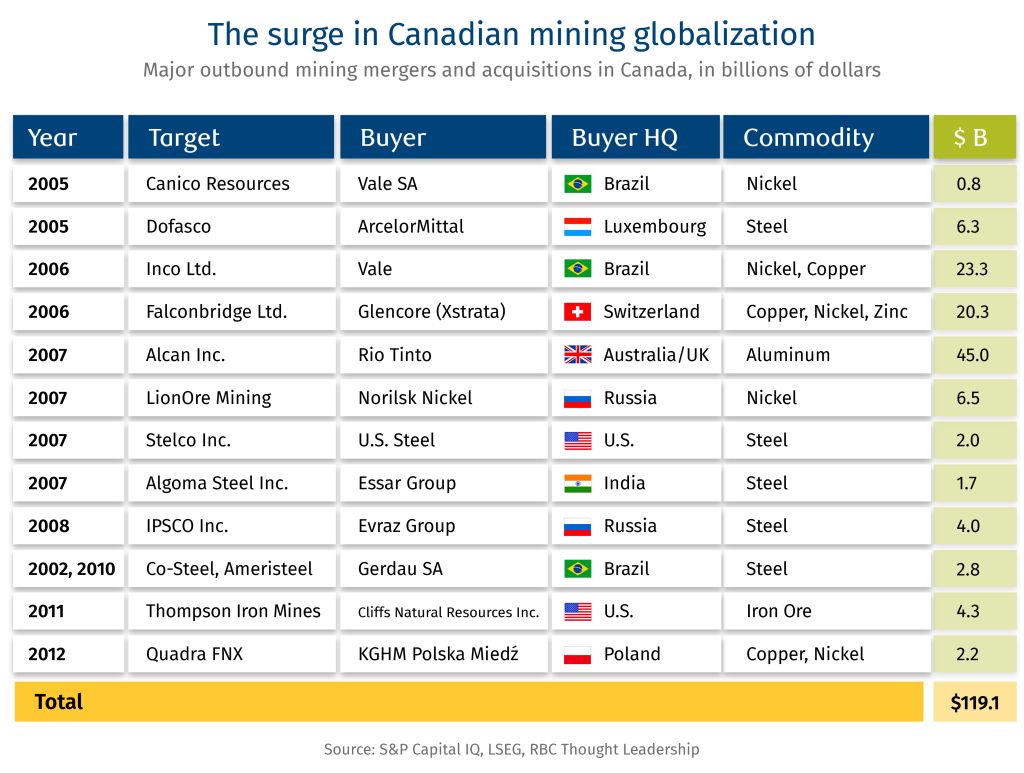
Between 2005 and 2012, more than $119 billion in Canadian base metals and steel assets transferred to foreign ownership.

The surge in Canadian mining globalization

The transactions were part of a wider globalization trend: foreign capital was expected to unlock value faster than our limited domestic capital markets, and nationality of ownership mattered less than the resulting economic uplift from mineral production and job creation. What that consensus underestimated was the long-term cost of losing domestic companies capable of anchoring new project developments—for a future era.

As Canada’s domestic giants were subsumed into global majors, the domestic capital-raising ecosystem was also disrupted. Boutique mining dealers shrank from around 60% of deal flow in 2010 to effectively 20% today, according to S&P Capital IQ. A similar trend is seen across capital holders as well, with resource-specialist funds now making up only 1-2% of domestic equity mutual fund assets under management today, compared to 6-8% in the early years following the global financial crisis, according to ISS MI MarketSage.

Many of the national champions that could have spearheaded Canada’s lithium, graphite and rare-earth projects largely no longer exist. Meanwhile, global majors allocate capital across their global portfolios that may not align with Canada’s strategic, sovereign objectives. This dynamic stands in marked contrast to the oilsands, which is the predominant operating asset controlled by large domestic players with large domestic ownership.

2. Capital consolidation around gold took the shine off other metals

Of the $700 billion raised in Canada in mining equity and mergers and acquisitions over the past 25 years, only 11% of capital was channelled to pure-play critical minerals development, according to S&P Capital IQ and LSEG. In contrast, Australia directed over twice as much capital to critical minerals during the same period. This was partly due to geology (Australia’s copper deposits are larger and less associated with gold), and partly to a closer proximity to Chinese and East Asian smelters.

The higher gold concentration in Canada reflects a historical M&A wave, with the S&P/TSX Composite mining complex becoming increasingly dominated by a smaller pool of large gold producers. In essence, Canada’s public mining equities evolved into a precious metals financing platform—a result of structural choices made over two decades across Canada’s critical minerals companies.

It doesn’t have to be a zero-sum game between gold and critical minerals—there is room to grow both mining sectors and even create ecosystems that feed off each other.

However, in Canada excellence in gold did not necessarily extend to critical minerals for two reasons:

  • The composition of Canada’s gold endowment made it efficient at producing the yellow metal, but relatively less so for other associated minerals like copper, nickel, cobalt as by-products. Australia’s mix of iron oxide-copper-gold deposits provide a more diverse commodity portfolio.

  • Gold mining skills and infrastructure do not inherently transfer to critical minerals. Gold smelting and refining are mature and standardized, whereas critical minerals processing, which is oriented towards specific end-uses (especially on battery metals) that require complex hydrometallurgy and chemical conversion..

3. Junior miners continue to face a financing cliff

Canada’s flow-through share financings—a tax incentive that allows investors to deduct 100% of their investment against their taxable income—works exceptionally well for early-stage exploration. It aggregates retail capital, reduces the effective cost of capital, and has successfully supported mineral exploration.

However, once a company completes the first assessment hurdle, these tax incentives expire (until construction begins). What follows is a $20-30 million financing gap: feasibility studies, engineering, permitting, and technical validation are required for ultimate final investment decision. These costs are often too large for high net-worth investors and too risky for institutional investors and lenders. Delays in permitting compound this challenge, as the companies remain pre-revenue with a stretched balance sheet.

For niche commodities such as graphite, rare earths and lithium, the problem is worsened by lack of market diversity. China often remains the sole buyer of mineral concentrates. Chinese lithium converters buy spodumene ore and process it into battery-grade lithium, while rare earth concentrates must be converted into a Mixed Rate Earth Carbonate—a processing step Canada largely lacks.

Few institutional investors have historically backed a Canadian junior whose only offtake market is a Chinese refiner, leading to a structural financing gap that has stalled viable projects for years.

4. Refining and processing face a structural deficit

Over the past three decades, Western countries effectively outsourced lower-margin, energy-intensive refining to China. Backed by state-backed capital, lax environmental regulations and lower labor costs, China now controls 70% of global refining market share for 19 of the world’s 20 most critical minerals.

China also builds overcapacity to squeeze competitors. Global copper smelting utilization was only 70% last year, and has played a role in Canada closing the Flin Flon, Gaspe and Kidd Creek copper smelters over the years. Today, only one Canadian copper smelter/refinery remains active: Glencore’s Horne smelter in in Rouyn-Noranda, Que., and its associated Canadian Copper Refinery.

Competing head-to-head in pure-play downstream processing against subsidized overcapacity is economically difficult. However, Canada’s advantage lies in pairing upstream mineral exposure—where margins are structurally higher—with selective downstream integration in “mineral corridors” that offer durable cost advantages, such as low-cost, zero-emitting hydro power in Quebec.

5. Limited domestic demand has constrained value chain growth

Refining investment follows demand—a capital-intensive smelter is hard to build in Canada where local demand is limited. Battery cell manufacturing is nascent and defence procurement operates at a fraction of U.S. scale. Magnet manufacturing, rare earth processing, and cathode precursor production are largely absent. The result is that shipping concentrates are shipped to where the customers are: primarily China.

The paradox is that Canada committed up to $55 billion to attract electric vehicle and battery manufacturers over the next 15 years without attaching domestic sourcing conditions that peer jurisdictions demanded. Germany and France implemented strict, minimum E.U. content and local supply-chain requirements into their electric vehicle subsidy schemes. South Korea similarly tied support to the use of Korean-source battery materials and components. The absence of such commitments in Canada, means the subsidies have not yet catalyzed ancillary industries.

1. Scale sovereign capital across the full value chain

Ottawa’s $2-billion Critical Minerals Sovereign Wealth Fund requires more heft to match the significant capital requirements. The Korea Zinc joint venture, for example, is developing a refinery in Tennessee for US$7.4 billion alone, demonstrating the substantial capital-intensity of downstream investments. A full build-out of mining, refining and processing critical minerals require an order of magnitude of patient capital that’s willing to persevere over years of construction and commercial validation.

The Canada Growth Fund (CGF) has made three mineral investments to address the gap. Its recent co-investment in Thompson Nickel Mines in Manitoba alongside U.S.-based Orion Resource Partners LP and Brazil’s Vale SA anchored the project, attracting credible corporate capital, and signalling strong sovereign commitment. This follows investments by the CGF in Quebec’s Nouveau Monde Graphite facility and the Foran Mining Corp. copper-zinc project in Saskatchewan.

Internationally, the Brazilian Development Bank also offers a template: a US$1-billion blended fund structured with government and private capital (including national mining champion Vale), managed at arm’s length and deployed across extraction, refining and processing. The structure, backed by government funding, instills commercial discipline, and makes strategic projects financeable.

2. Deploy infrastructure capital to unlock regions

Co-investing in enabling infrastructure—such as roads, transmission, grid connections to remote mining regions—reduces a project’s required break-even price by around 22-24%, the single largest lever of any individual policy measure, according to a recent Canada Infrastructure Bank (CIB) analysis.

The build-out of accompanying infrastructure is ideal for pension funds and long-duration institutional investors who are best suited to participate: lower risk than equity in a junior miner, contractual cash flows, and infrastructure-style returns. Ontario’s metal-rich Ring of Fire region alone requires as much as $2.4 billion in road and transmission investment before a single mine becomes commercially viable. For pension funds, it’s an opportunity to finance infrastructure, provided there’s surety of the facility being built, and the new infrastructure can be put to multiple uses and even serve as a springboard for new developments.

Investment in remote communities, many of which are on First Nations territories, presents another opportunity. However, unlike Alberta and British Columbia where oil and gas commercial precedents are well-established between First Nations communities and corporations, these mining jurisdictions require nurturing local governance and technical readiness to ensure long-term commercial success.

3. Build mineral corridors around Canada’s best clusters

Shared processing infrastructure solves multiple problems simultaneously. For instance, Quebec’s six high-grade, high-tonnage lithium projects can complement a regional refining hub. A similar logic applies to the lithium belt running from Thunder Bay to Winnipeg, and to the Sudbury nickel cluster, which already boasts world-class refining infrastructure that could expand to serve new critical minerals projects across Northern Ontario.

Such centralized refiners would give junior and mid-sized miners credible non-Chinese buyers, reinforcing their business and investment case. Corridor economics could also have a cascading economic effect, extending to logistic, transport, commercial and residential housing, and other amenities.

A shared Central Lithium Refinery—potentially structured with government loan guarantees and anchor offtake agreements with battery producers in Europe, Korea, Japan, and emerging Canadian manufacturers.

This offtake, in turn, makes projects financeable on Canadian equity markets and eventually eligible for project financing. The infrastructure economics improve further if the Plan Nord railway extension in Quebec proceeds—an initiative championed by the Cree Development Corporation that would materially reduce both the environmental footprint and capital costs of the Quebec lithium cluster.

4. Draw in global majors to improve project economics

The Canada Growth Fund is well-positioned to co-invest alongside global majors, provide offtake agreements that de-risk revenues, and leverage investment tax credits (ITC) to improve project economics. CGF’s partnership with Strathcona Resources Ltd., to build a $2-billion carbon capture and sequestration facility is a case in point: the government underwrote half the capital and allowed full ITC value to flow to private investors. Revenue de-risking tools, such as offtake agreements and contracts for difference, could reduce a project’s required break-even by approximately 18-19%, CIB analysis shows. The combination of infrastructure investment, revenue de-risking, and co-equity could move Canadian projects to the top of a global major’s priority list.

5. Forge closer ties with U.S. supply chains—but diversify

Few governments are doing more to reshape the global minerals order than the United States. The U.S. Office of Strategic Capital is authorized to deploy US$100-200 billion to bolster defence and industrial supply chains—roughly 15-20 times Canada’s federal funding. Washington’s Project Vault, a US$12-billion critical minerals stockpile, is already operational and striking deals with other countries.

Developing closer ties with U.S. supply chains is Canada’s greatest structural advantage other jurisdictions would struggle to replicate. Strategic deals under the Project Vault umbrella, would ensure Canadian minerals flow into U.S. rules of origin for batteries and EVs. Guaranteed offtake commitments would also give Canada both the demand signal and the financing certainty that mine-refine-process economics require.

The strategy is not without risk as deeper supply-chain alignment with Washington could mean Canadian minerals face U.S. export licencing and defence procurement priorities that serve American industrial policy first.

To avoid diminishing its resource sovereignty, Canada should pursue a strong diversification strategy targeting European and Asian allies, building on its 26 new investments and partnerships with G7 allies that unlocked $6.4 billion of critical minerals projects.

Australia and Canada share comparable geological endowments and mining traditions, but the similarities end there. Australia has consistently outpaced Canada in diversifying its resource wealth, employing a robust strategy focused on mobilizing capital, project permitting, and underwriting infrastructure—ultimately shaping investor behaviour.

Here’s how the Australian and Canadian playbooks have deviated:

1. Anchor investors lead the way

Australia’s pension funds maintain a standing allocation to resources, supported by specialist mining investors who understand the risk profile at every stage of development. Canadian pension funds don’t have the same obligation, while its overall investor base has rotated away from resources over the past 15 years towards tech, healthcare, and global equities. This has left mining capital in Canada episodic, cycle-dependent, and increasingly risk-averse at critical stages of development. The result is a more fragile domestic funding environment for Canadian miners, a trend partly driven by the historically lower total return performance of Canadian miners relative to their Australian peers.

2. Mechanisms to manage financing troughs

While both countries successfully fund early-stage exploration, Canada’s path diverges sharply after that. Flow-through financing—which provides tax incentives at the earliest stages—is effective but limited to exploration. This leaves feasibility, construction, and first production with few funding and incentive levers. This creates a structural incentive to sell assets early rather than build and operate them. Australia’s deeper capital pool through pension funds and specialist resource investors has fostered mid-tier producers that Canada largely lacks.

3. Permitting certainty as a capital advantage

Australia’s approval frameworks include statutory timelines to prevent processes from stalling indefinitely. Canada’s multi-layered federal and provincial reviews, combined with open-ended consultation processes, can stretch five years or more with no defined endpoint. Because permitting risks directly impact project economics, these delays serve as a significant deterrent to capital.

4. The virtuous cycle of base metal wealth—and expertise

Australia’s commodity diversity is anchored in bulk and base metals—iron ore, metallurgical coal, copper, bauxite and alumina—in greater propensity than Canada and its precious metals. That mix supported the growth of BHP Group, Rio Tinto Ltd and Fortescue Ltd., which are now backing other critical minerals including the energy-transition metals like lithium and rare earths. While Canada’s geology is diverse, public markets, historical mergers and acquisitions (M&A) and resulting producer base tilted towards gold companies.

5. Market access and Asian ties facilitated demand

The rise of Asian steel manufacturing, especially China but also Japan and Korea, drove long-term contracts for Australian iron ore and metallurgical coal and anchored the rise of the Australian mining majors. These deep commercial ties now extend to copper, alumina and other emerging battery materials. Canada, by contrast, built commercial ties with North America and Europe, and became cost uncompetitive from a supply standpoint given the lower operating costs of Asian refiners but also missed out on the nexus of demand from Asian battery value chains.

Download the report

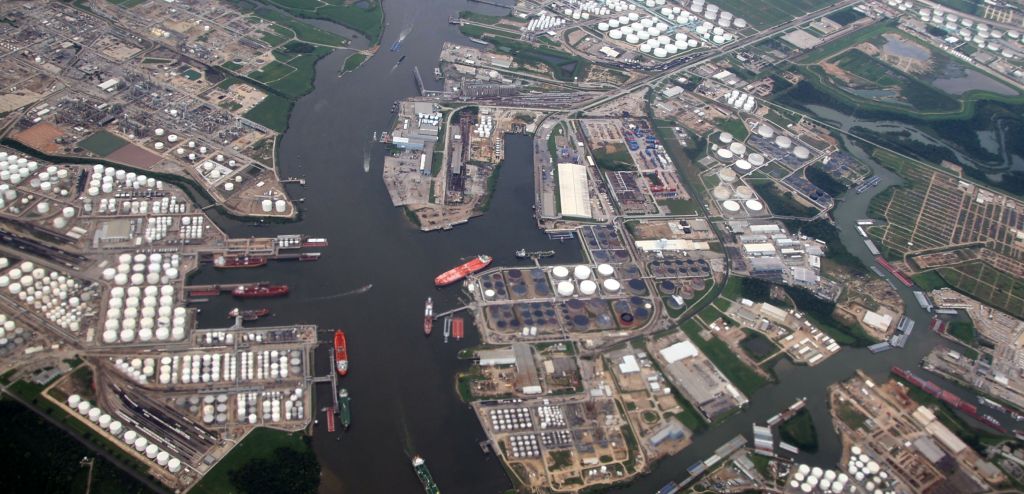
The U.S. loves heavy oil. The blend is vital for diesel, jet fuel and petrochemicals, and Canada is, by some distance, its biggest foreign supplier. However, a U.S. plan to influence and revive Venezuelan oil has raised concerns that Canada—already facing U.S. pressure on several other domestic industries—could start losing market share to Venezuelan heavy crude in a few years. It could amount to a Washington squeeze on Canada’s most prized resource.

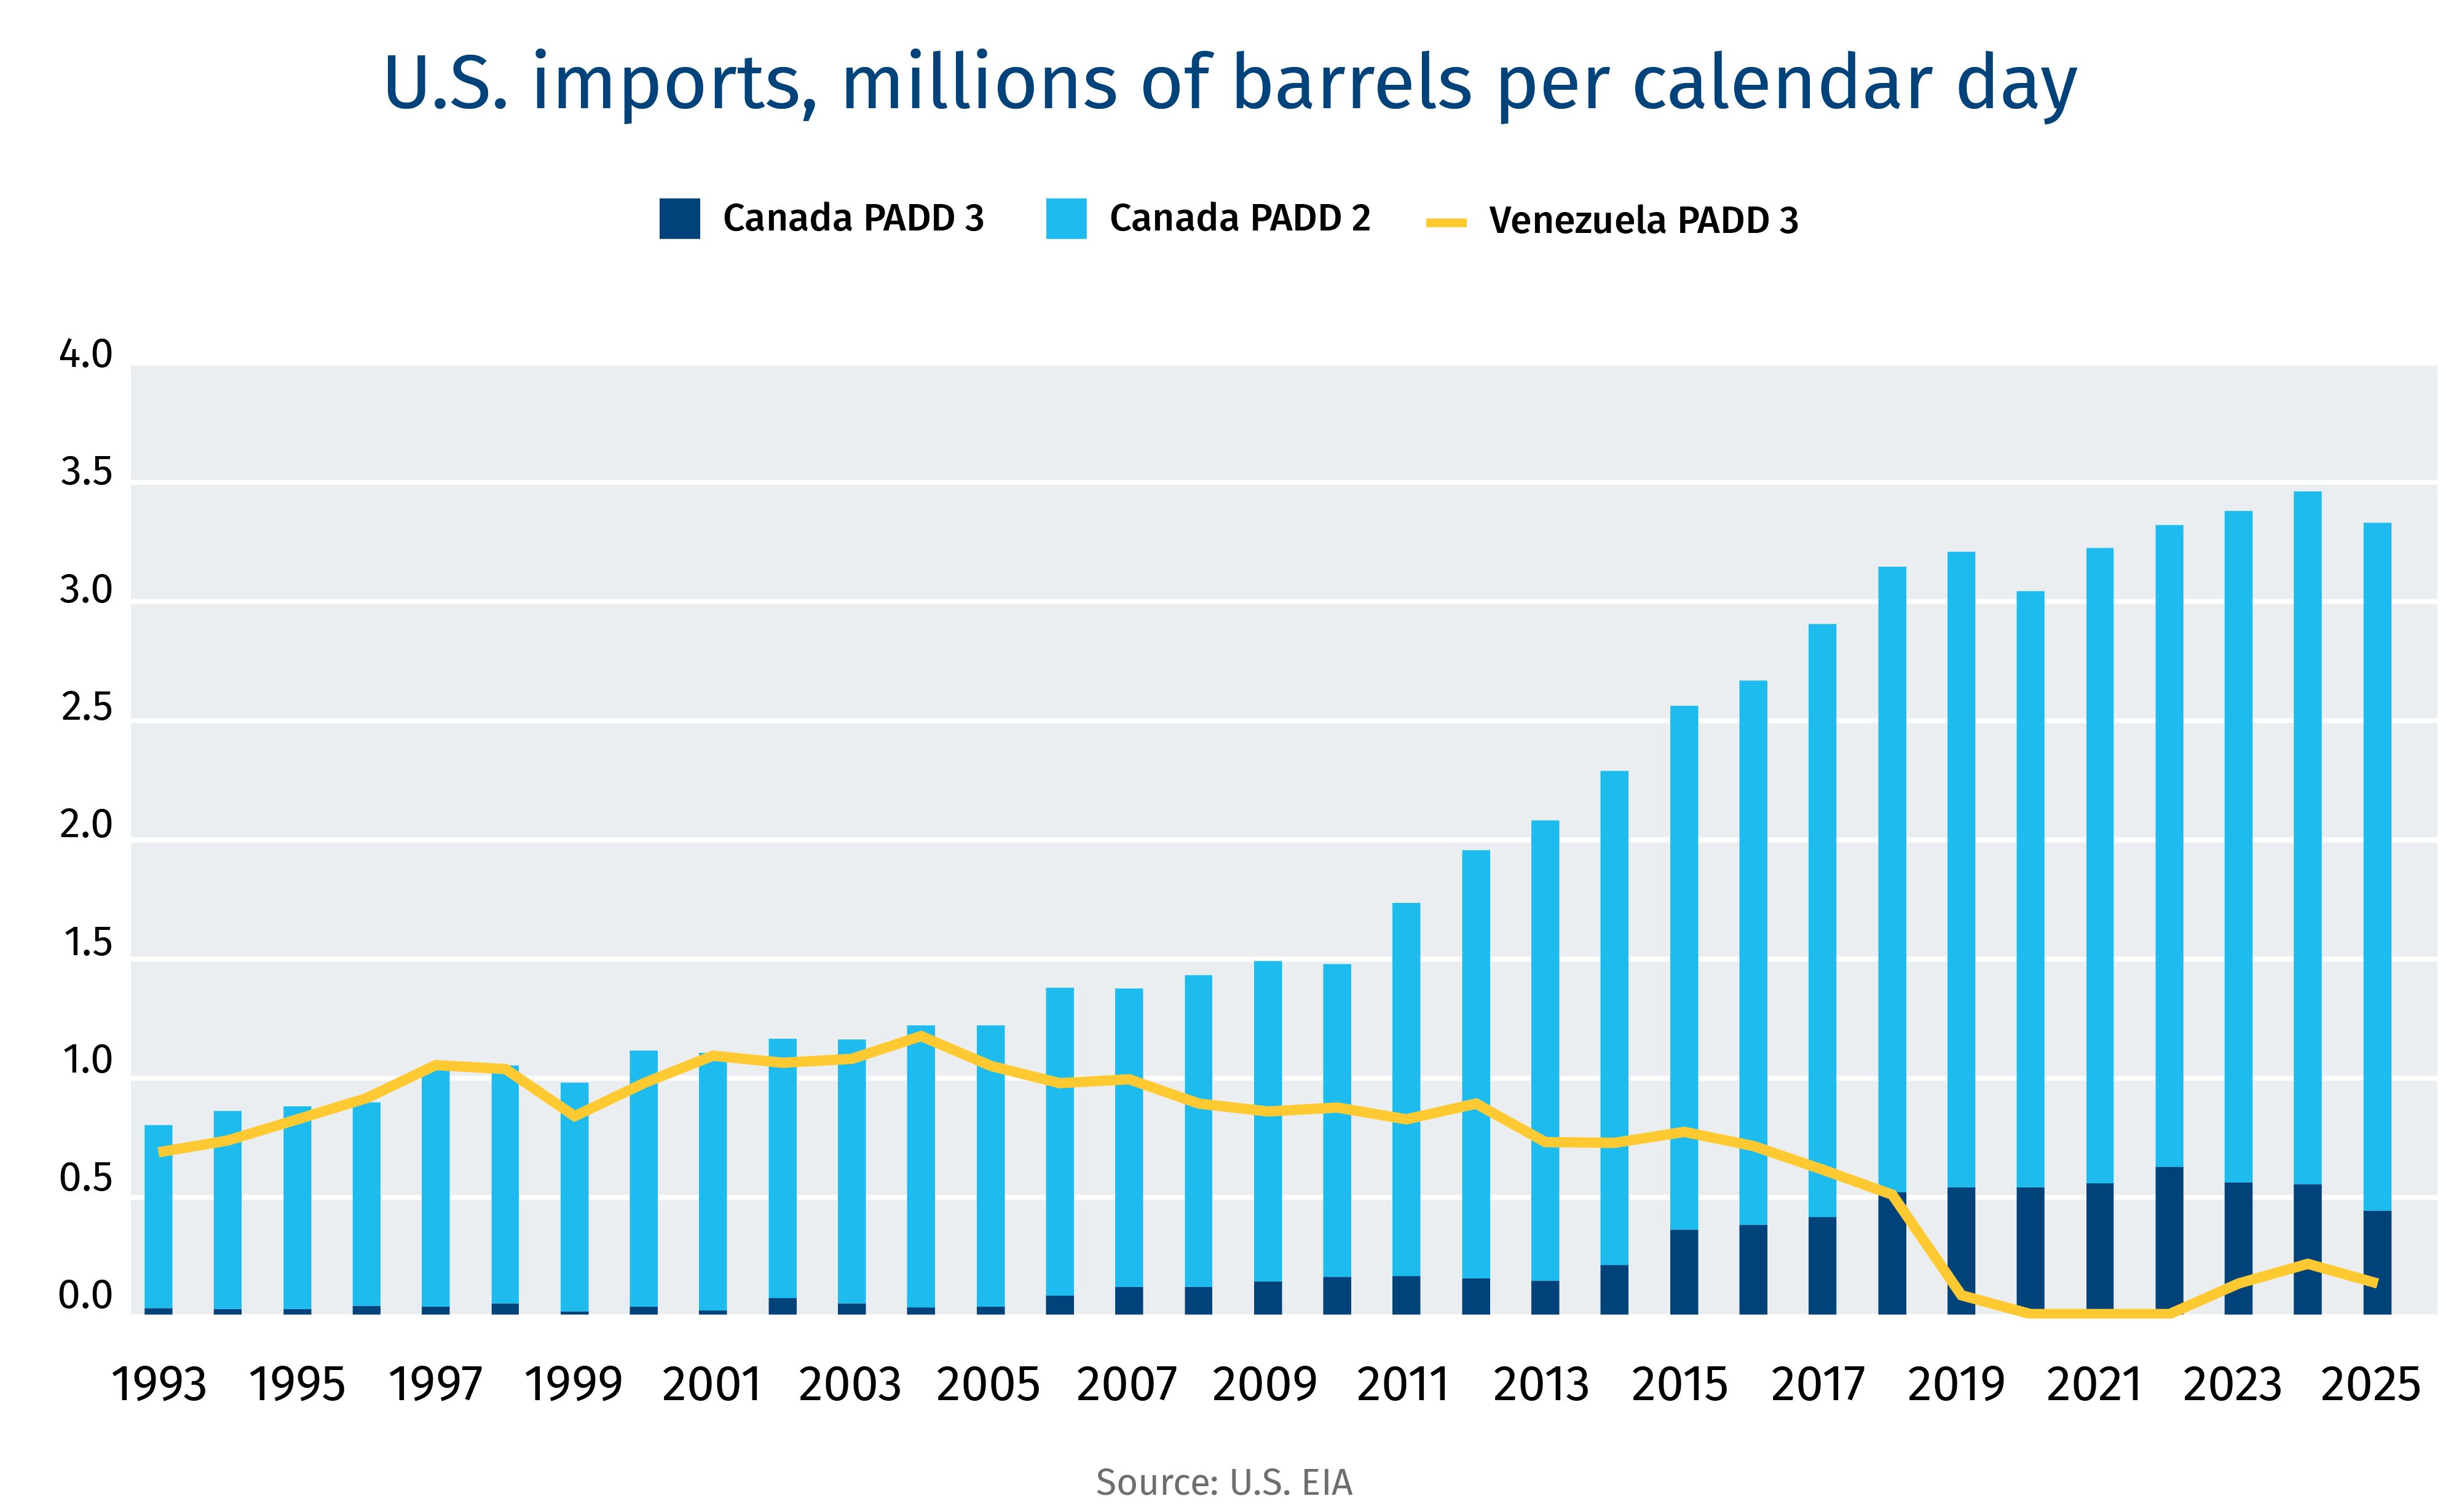
Imports of crude and liquids into the U.S., the millions of barrels per calendar day

U.S. crude import patterns reflect a clear structural divergence between Canada and Venezuela. The result is a fundamental reorientation of U.S. import dependence toward Canadian supply, reinforced by reliability, infrastructure, and long-cycle capital investment.

U.S. Imports, millions of barrels per calendar day

Venezuelan crude once dominated Gulf Coast imports, but its collapse created space that has only partially been filled by Canadian barrels. The Gulf Coast is seen as a battleground, but only 10% of total Canadian imports flow into the region known as PADD 3. Most Canadian crude growth has occurred within the Midwest refinery region, known as PADD 2, which accounts for 69% of total Canadian export growth into the U.S. over the past three decades.

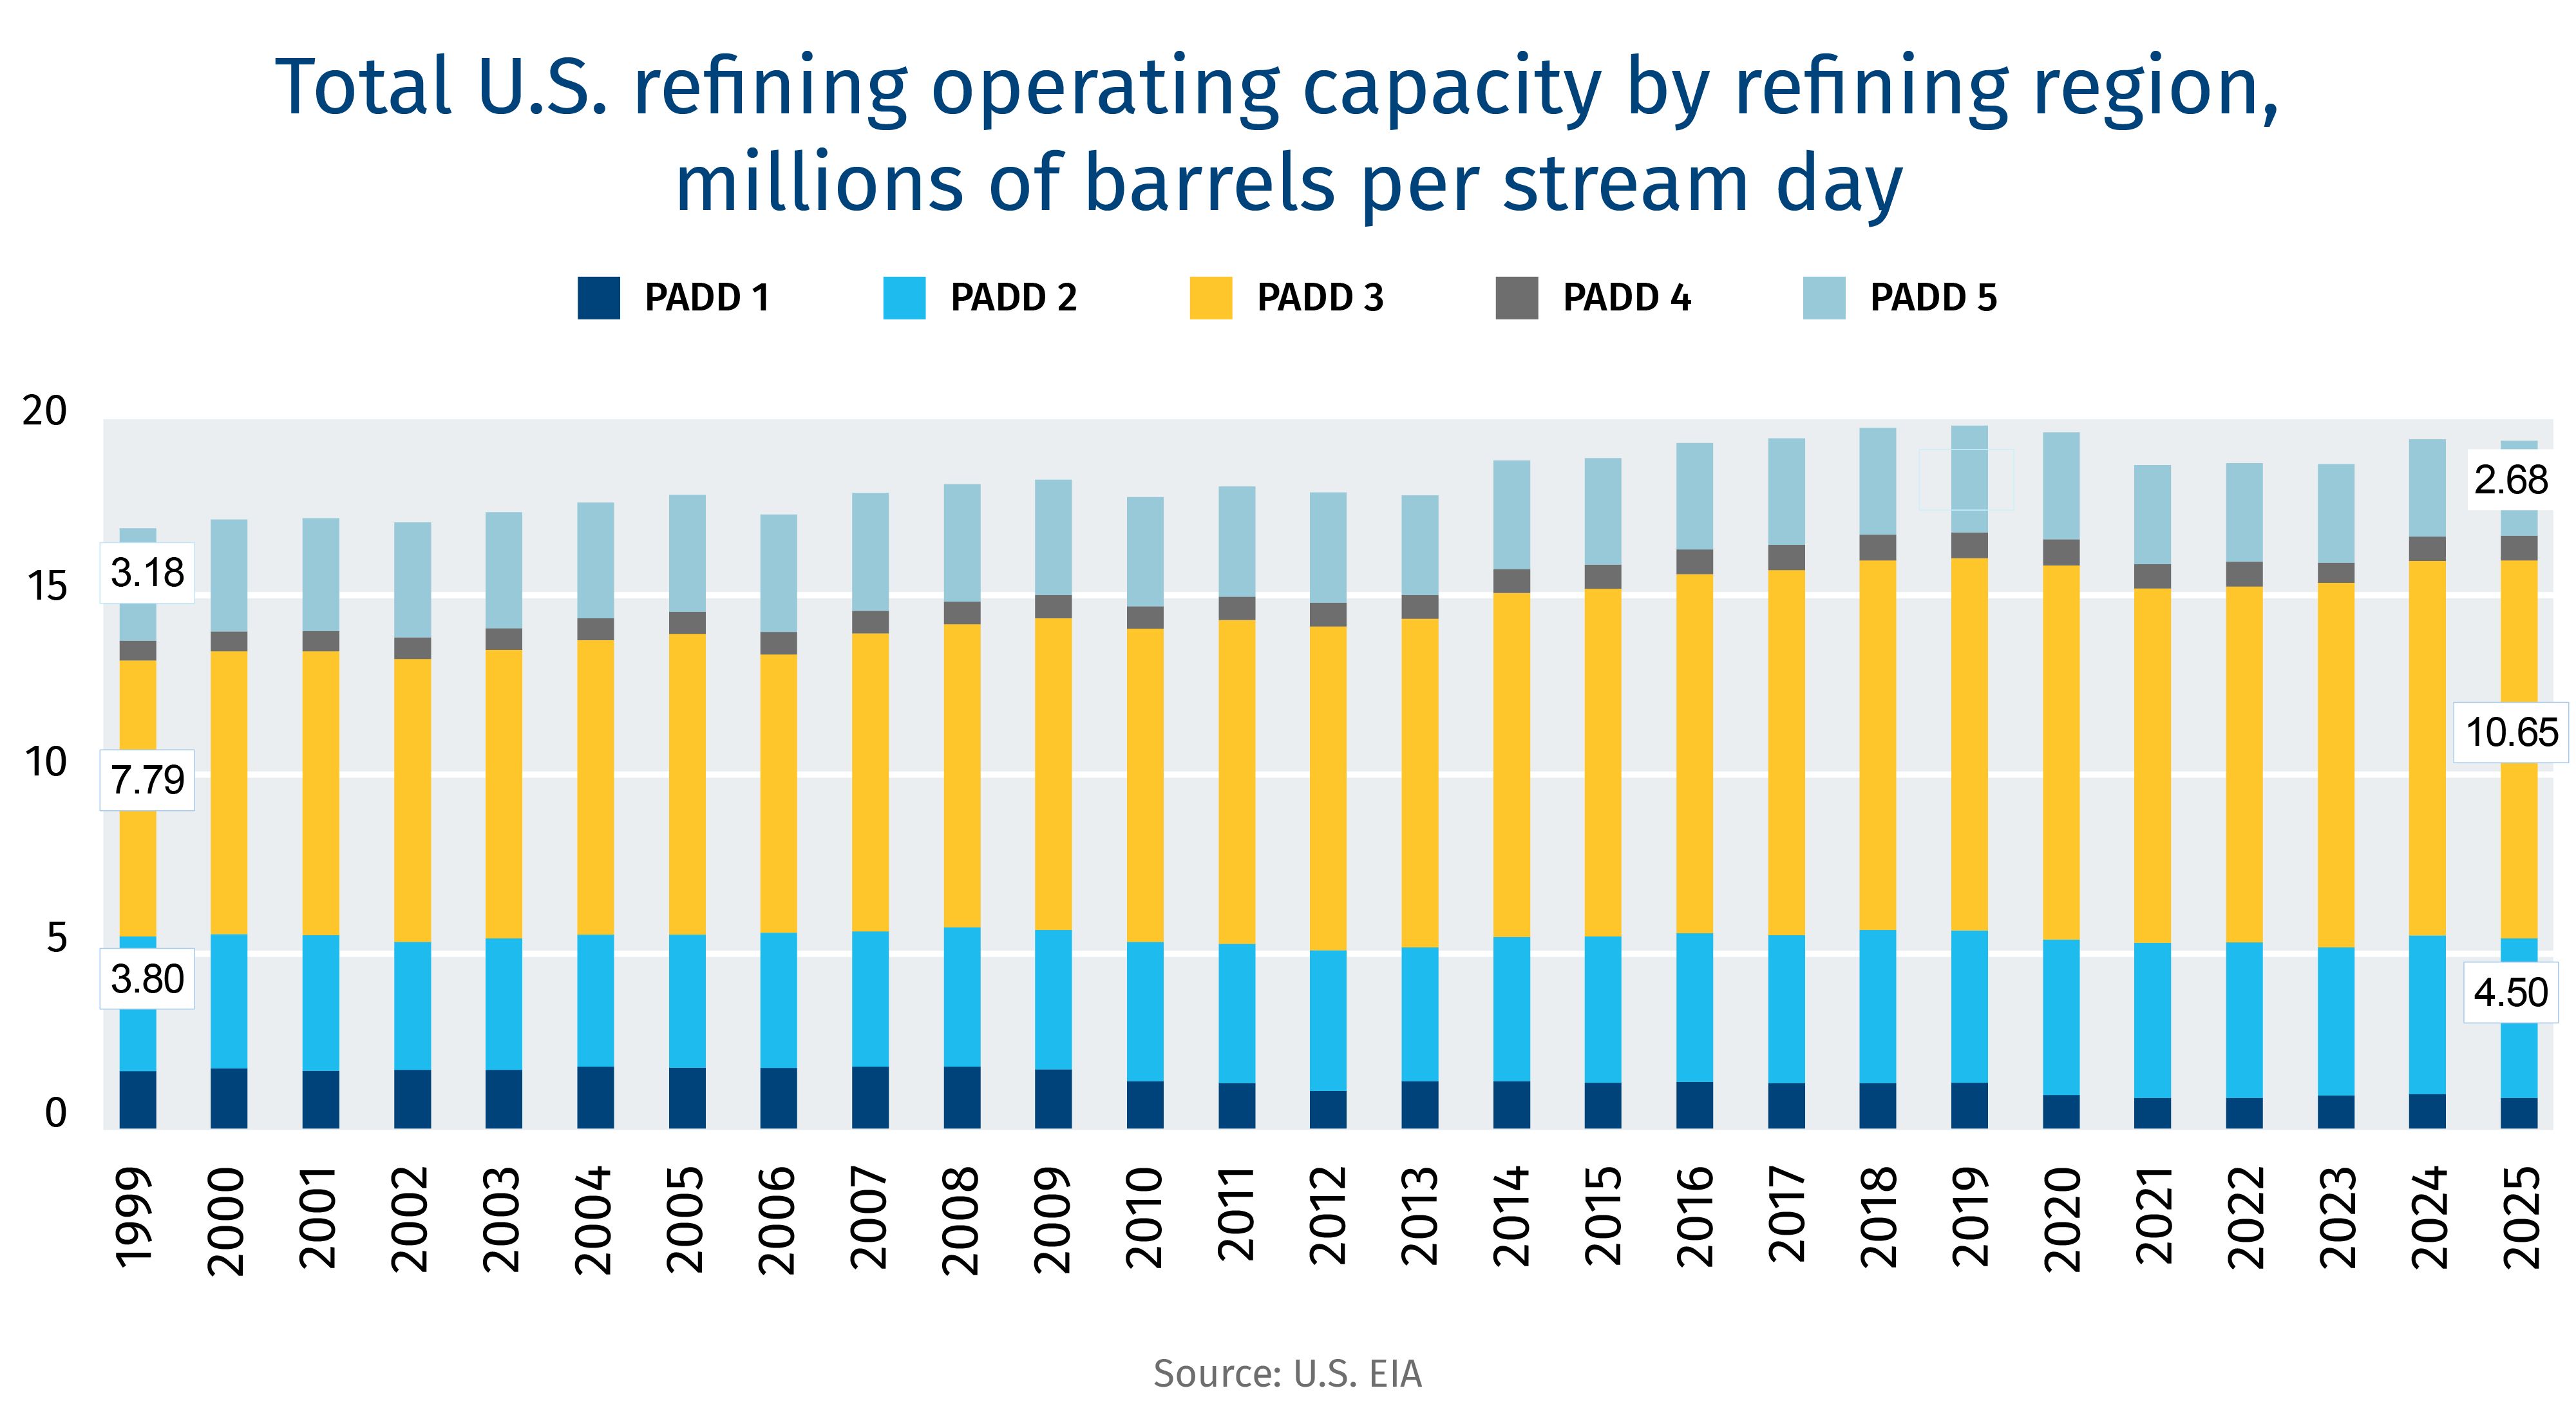
Total U.S. Refining capacity by refining region, millions of barrels per stream day

U.S. refining capacity growth has been concentrated in PADD 3 and PADD 2, reinforcing the system’s orientation toward large-scale, complex refining hubs. The Gulf Coast’s dominance reflects decades of investment designed to process heavier and more diverse crude slates, positioning it as both a domestic refining centre and a globally relevant supply hub.

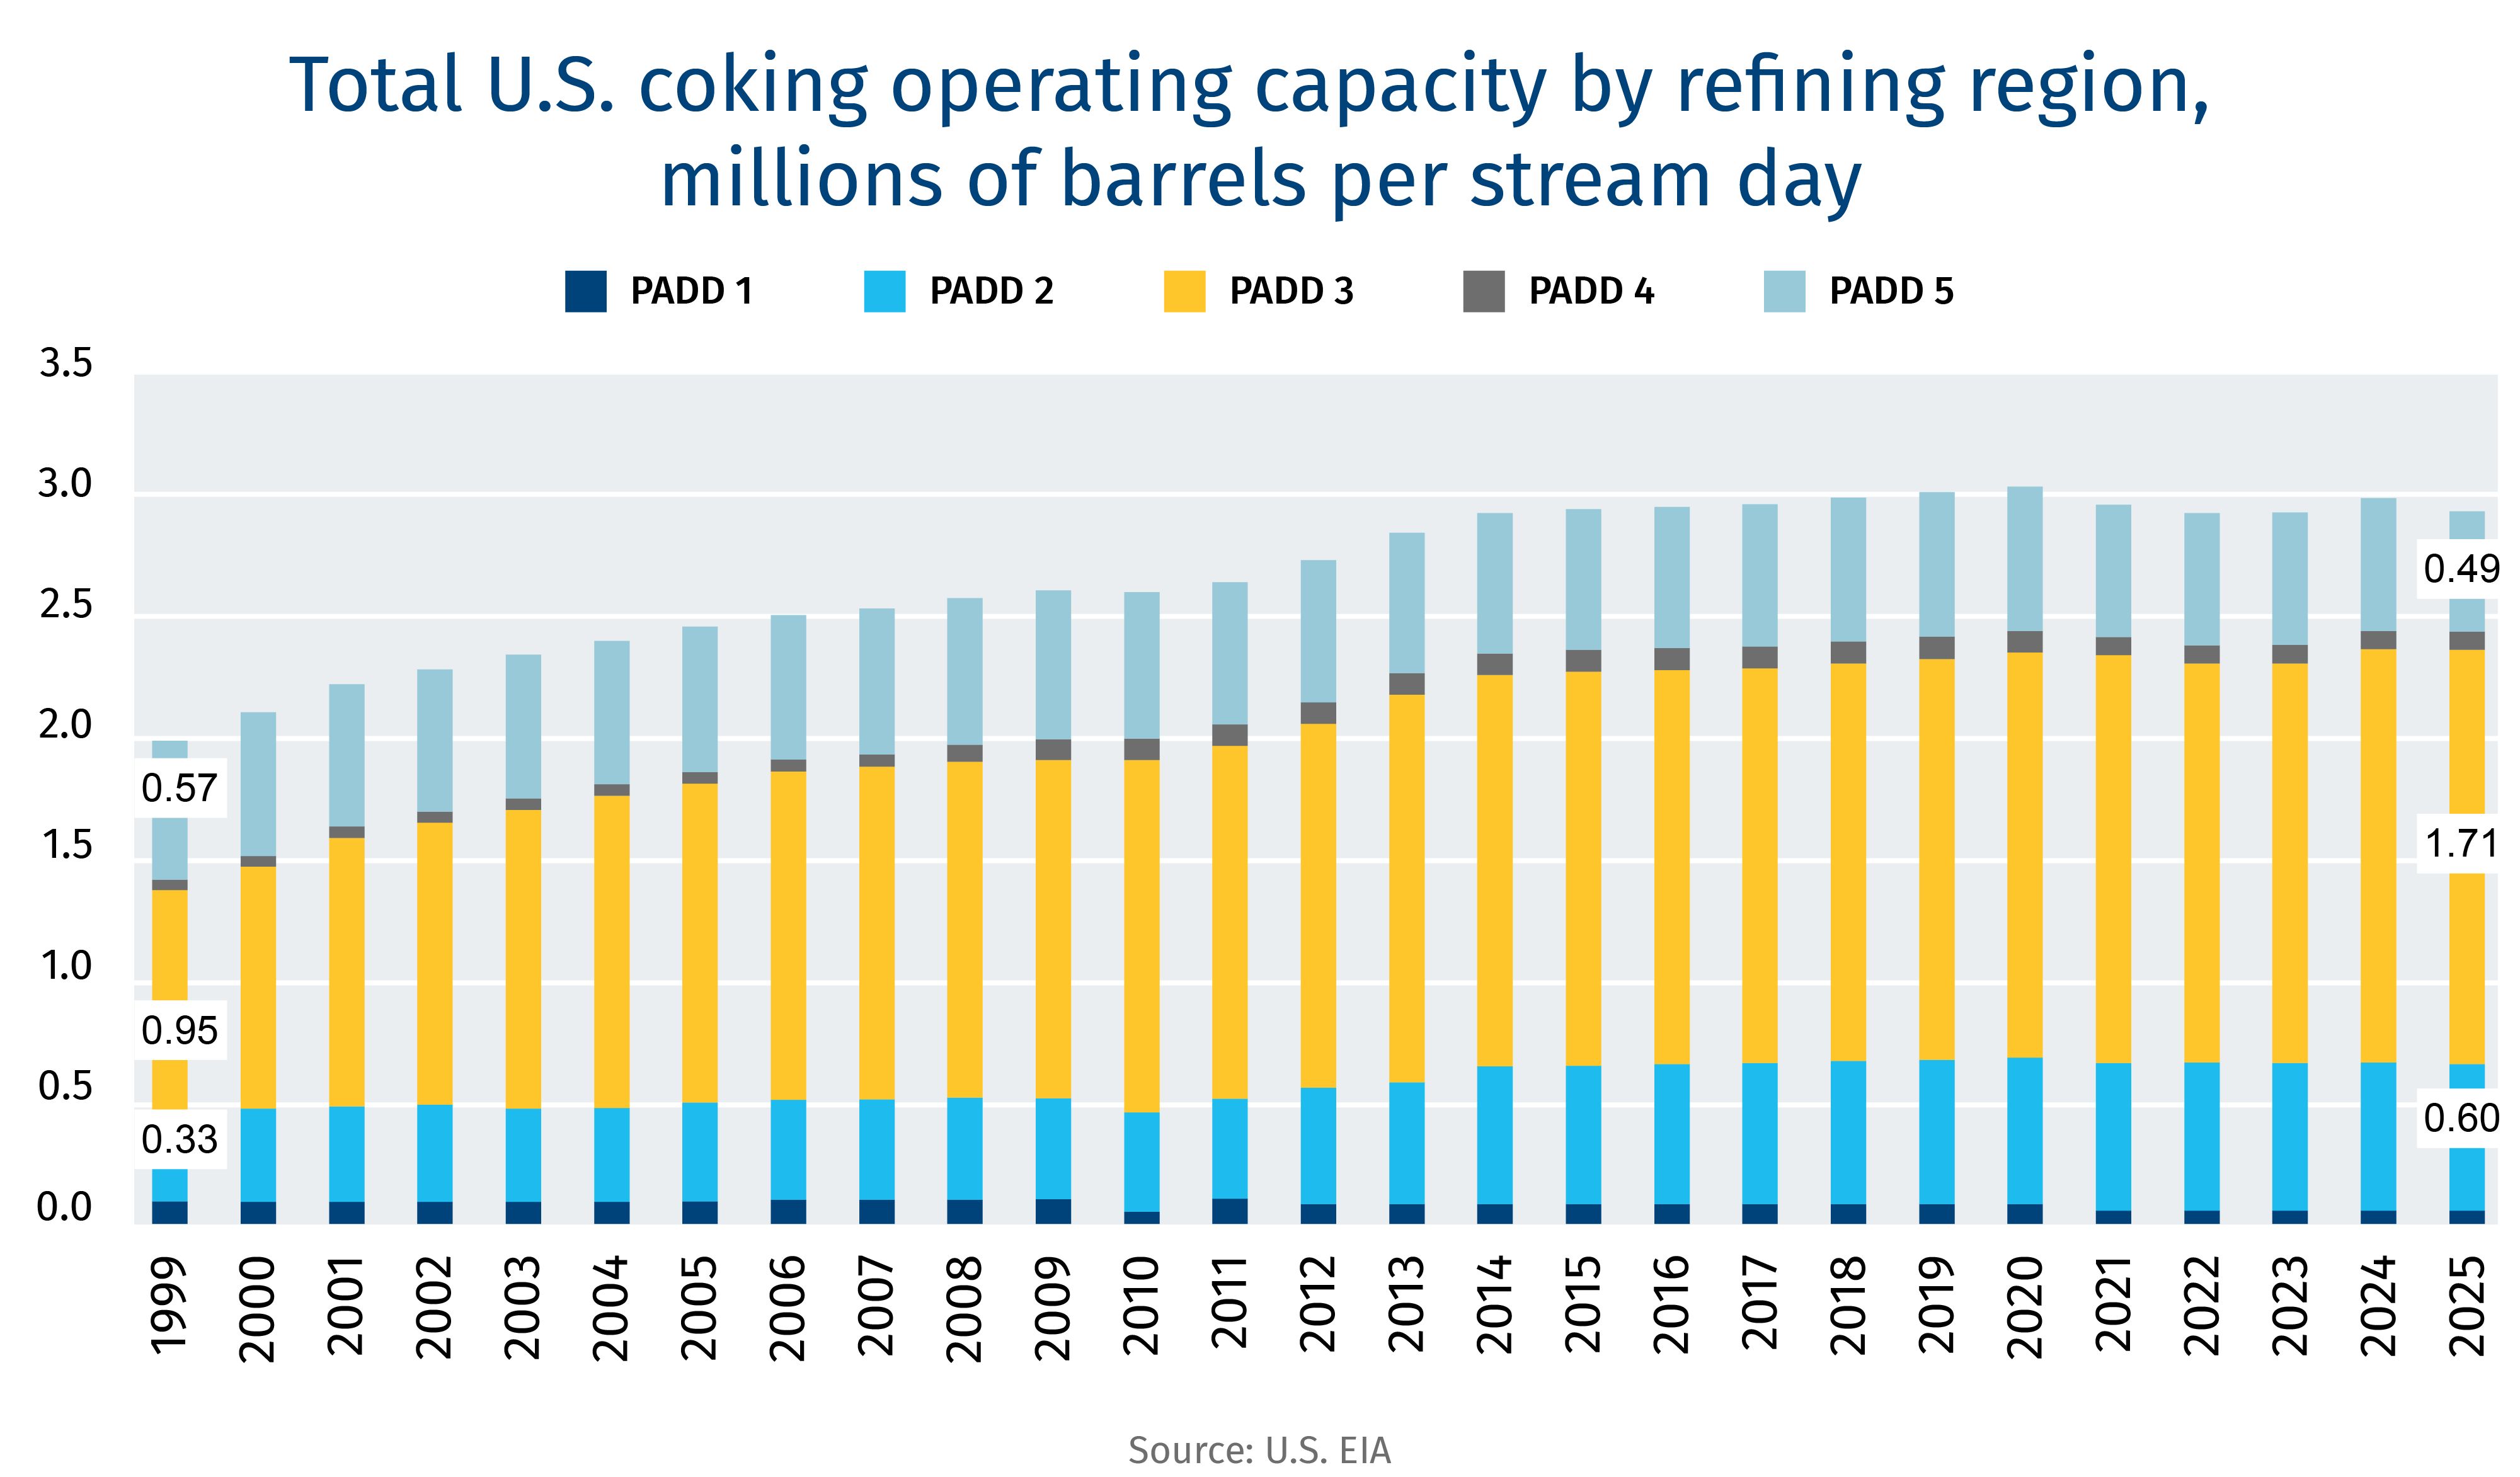
Total U.S. coking operating capacity by refining region, millions of barrels per stream day

Coking capacity remains a defining feature of the U.S. system’s ability to process heavy crude, with the majority of investment concentrated along the Gulf Coast. The steady build-out of coking units over time highlights how refiners structurally adapted assets to heavier barrels, further entrenching supply relationships that favor Canadian crude.

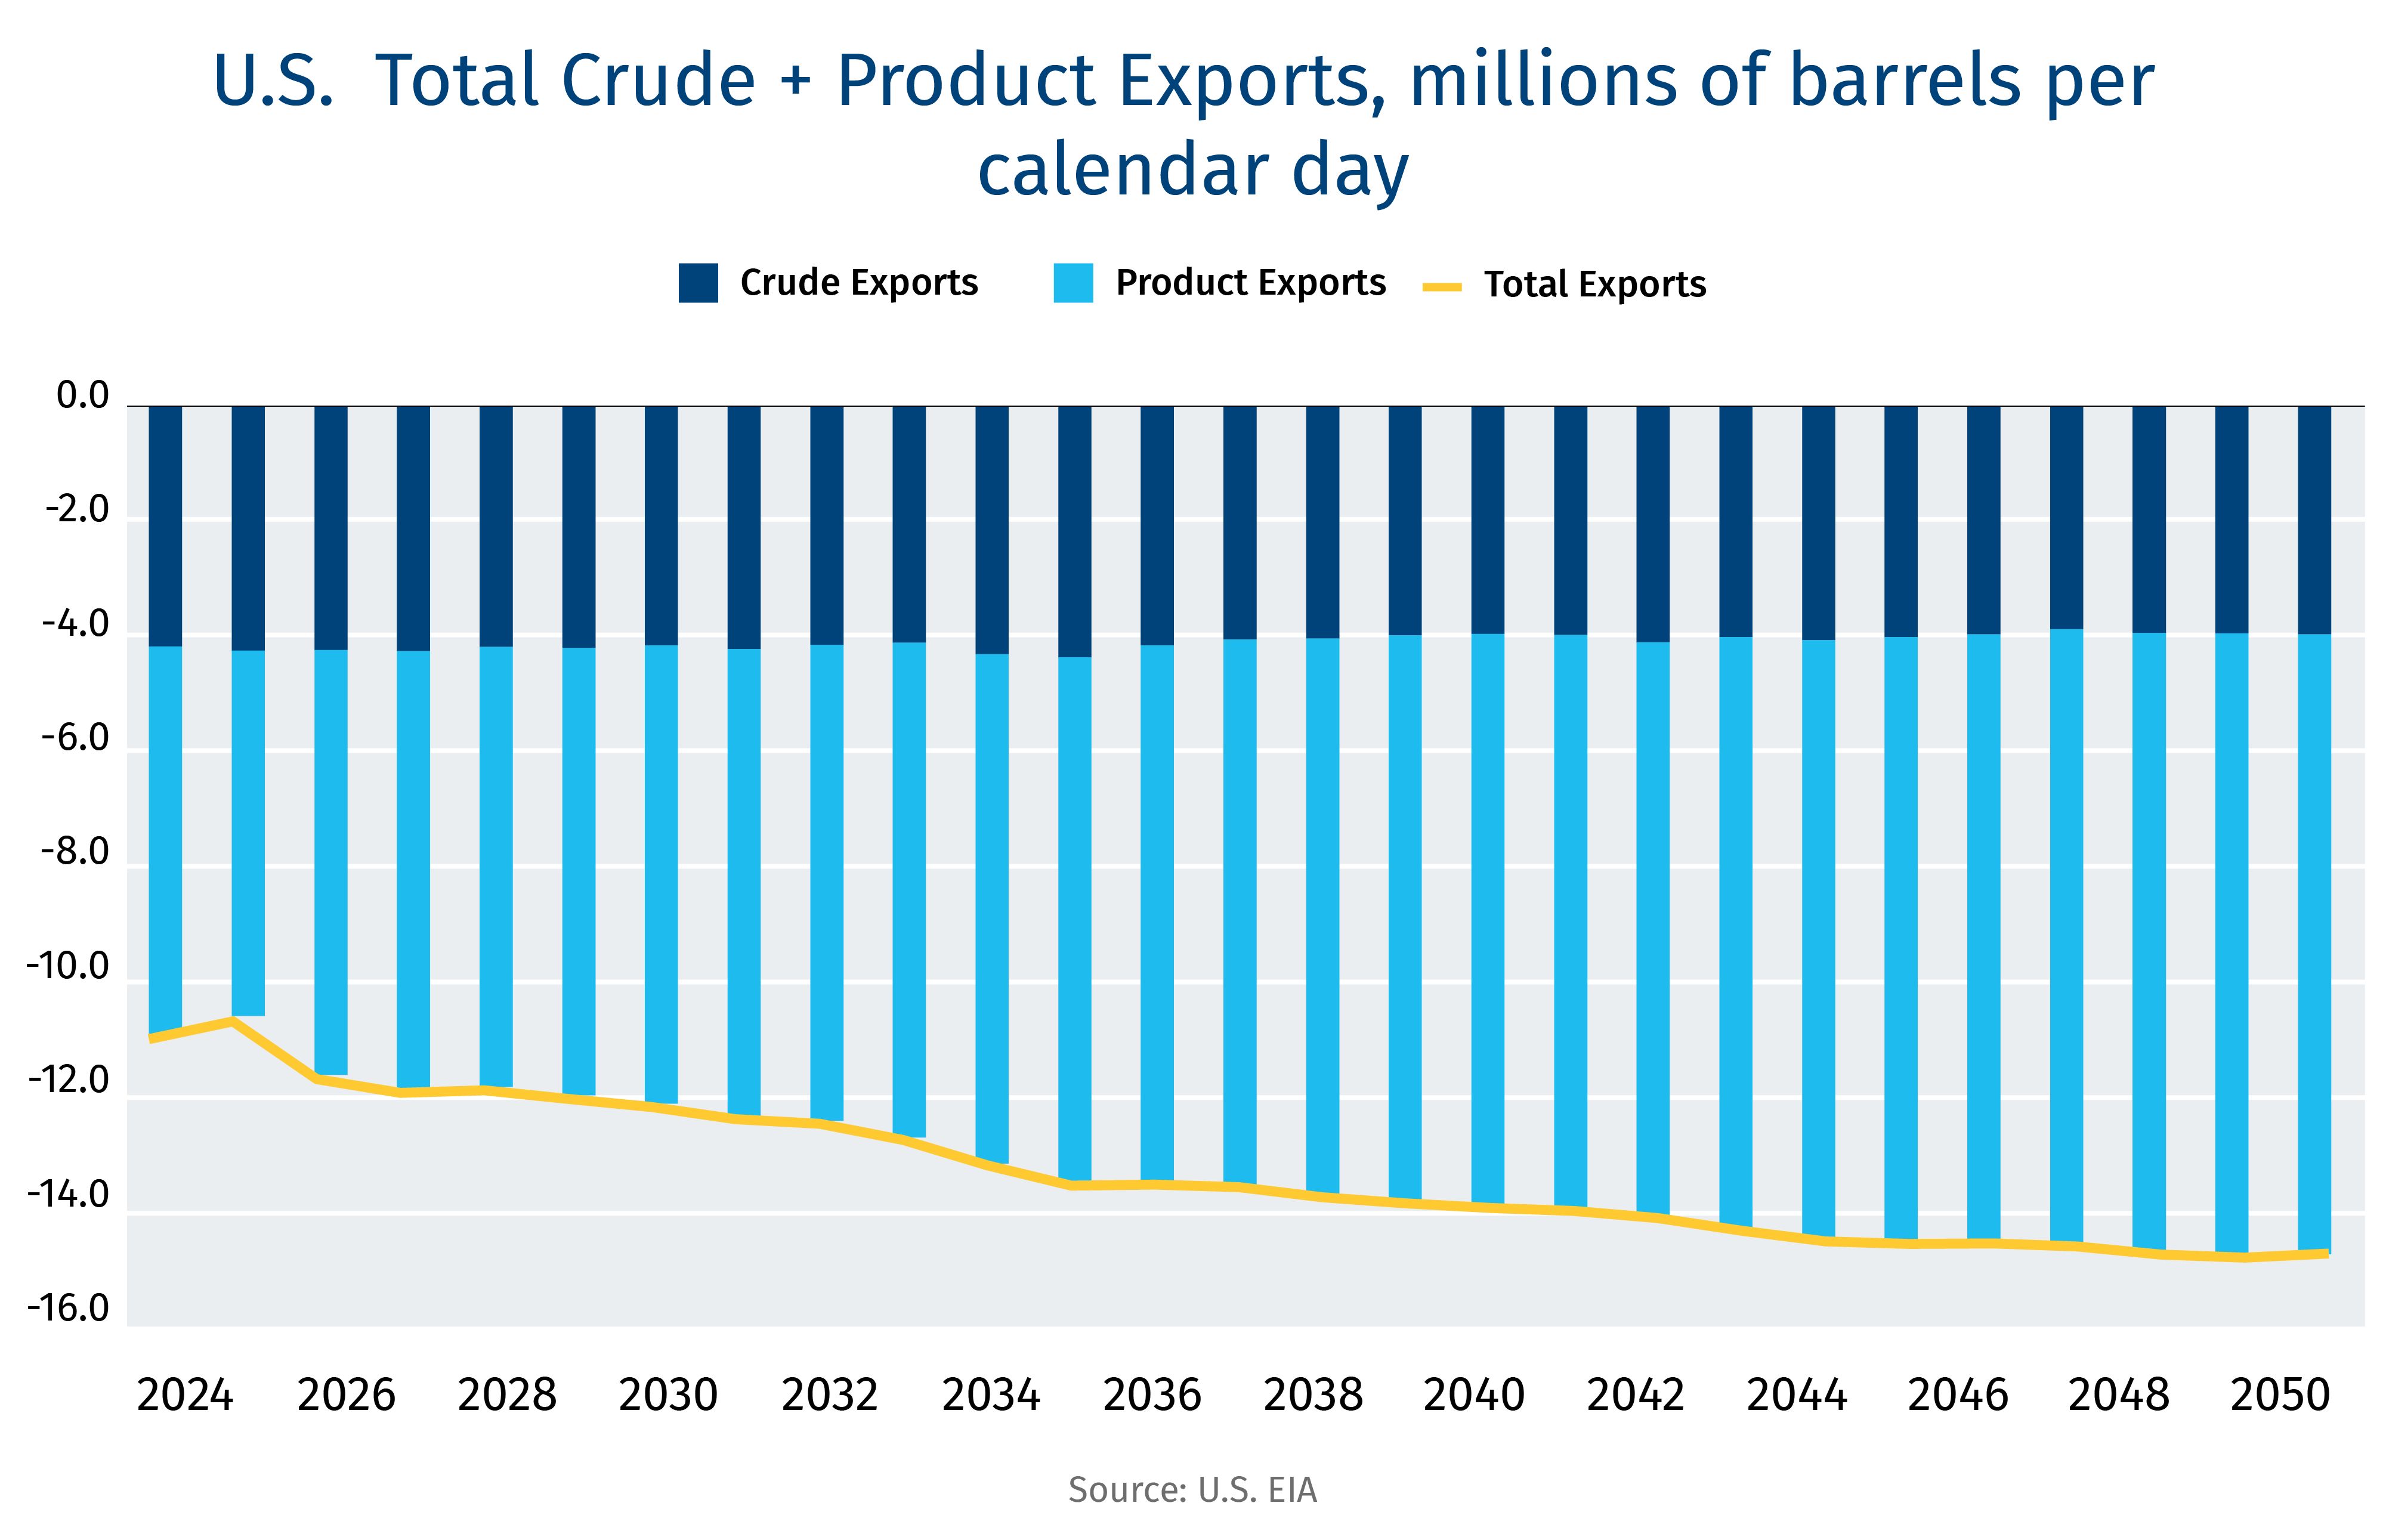
U.S. Total Crude + Product Exports, millions per barrel per calendar day

The U.S. energy system is increasingly focused on exports, with petroleum products accounting for majority of outbound volumes over time. This underscores the Gulf Coast’s role not only as a refining hub, but as a critical petrochemical and export platform. For Canada it reinforces the importance of market access, blending, refining, and re-export pathways within an evolving global trade landscape.

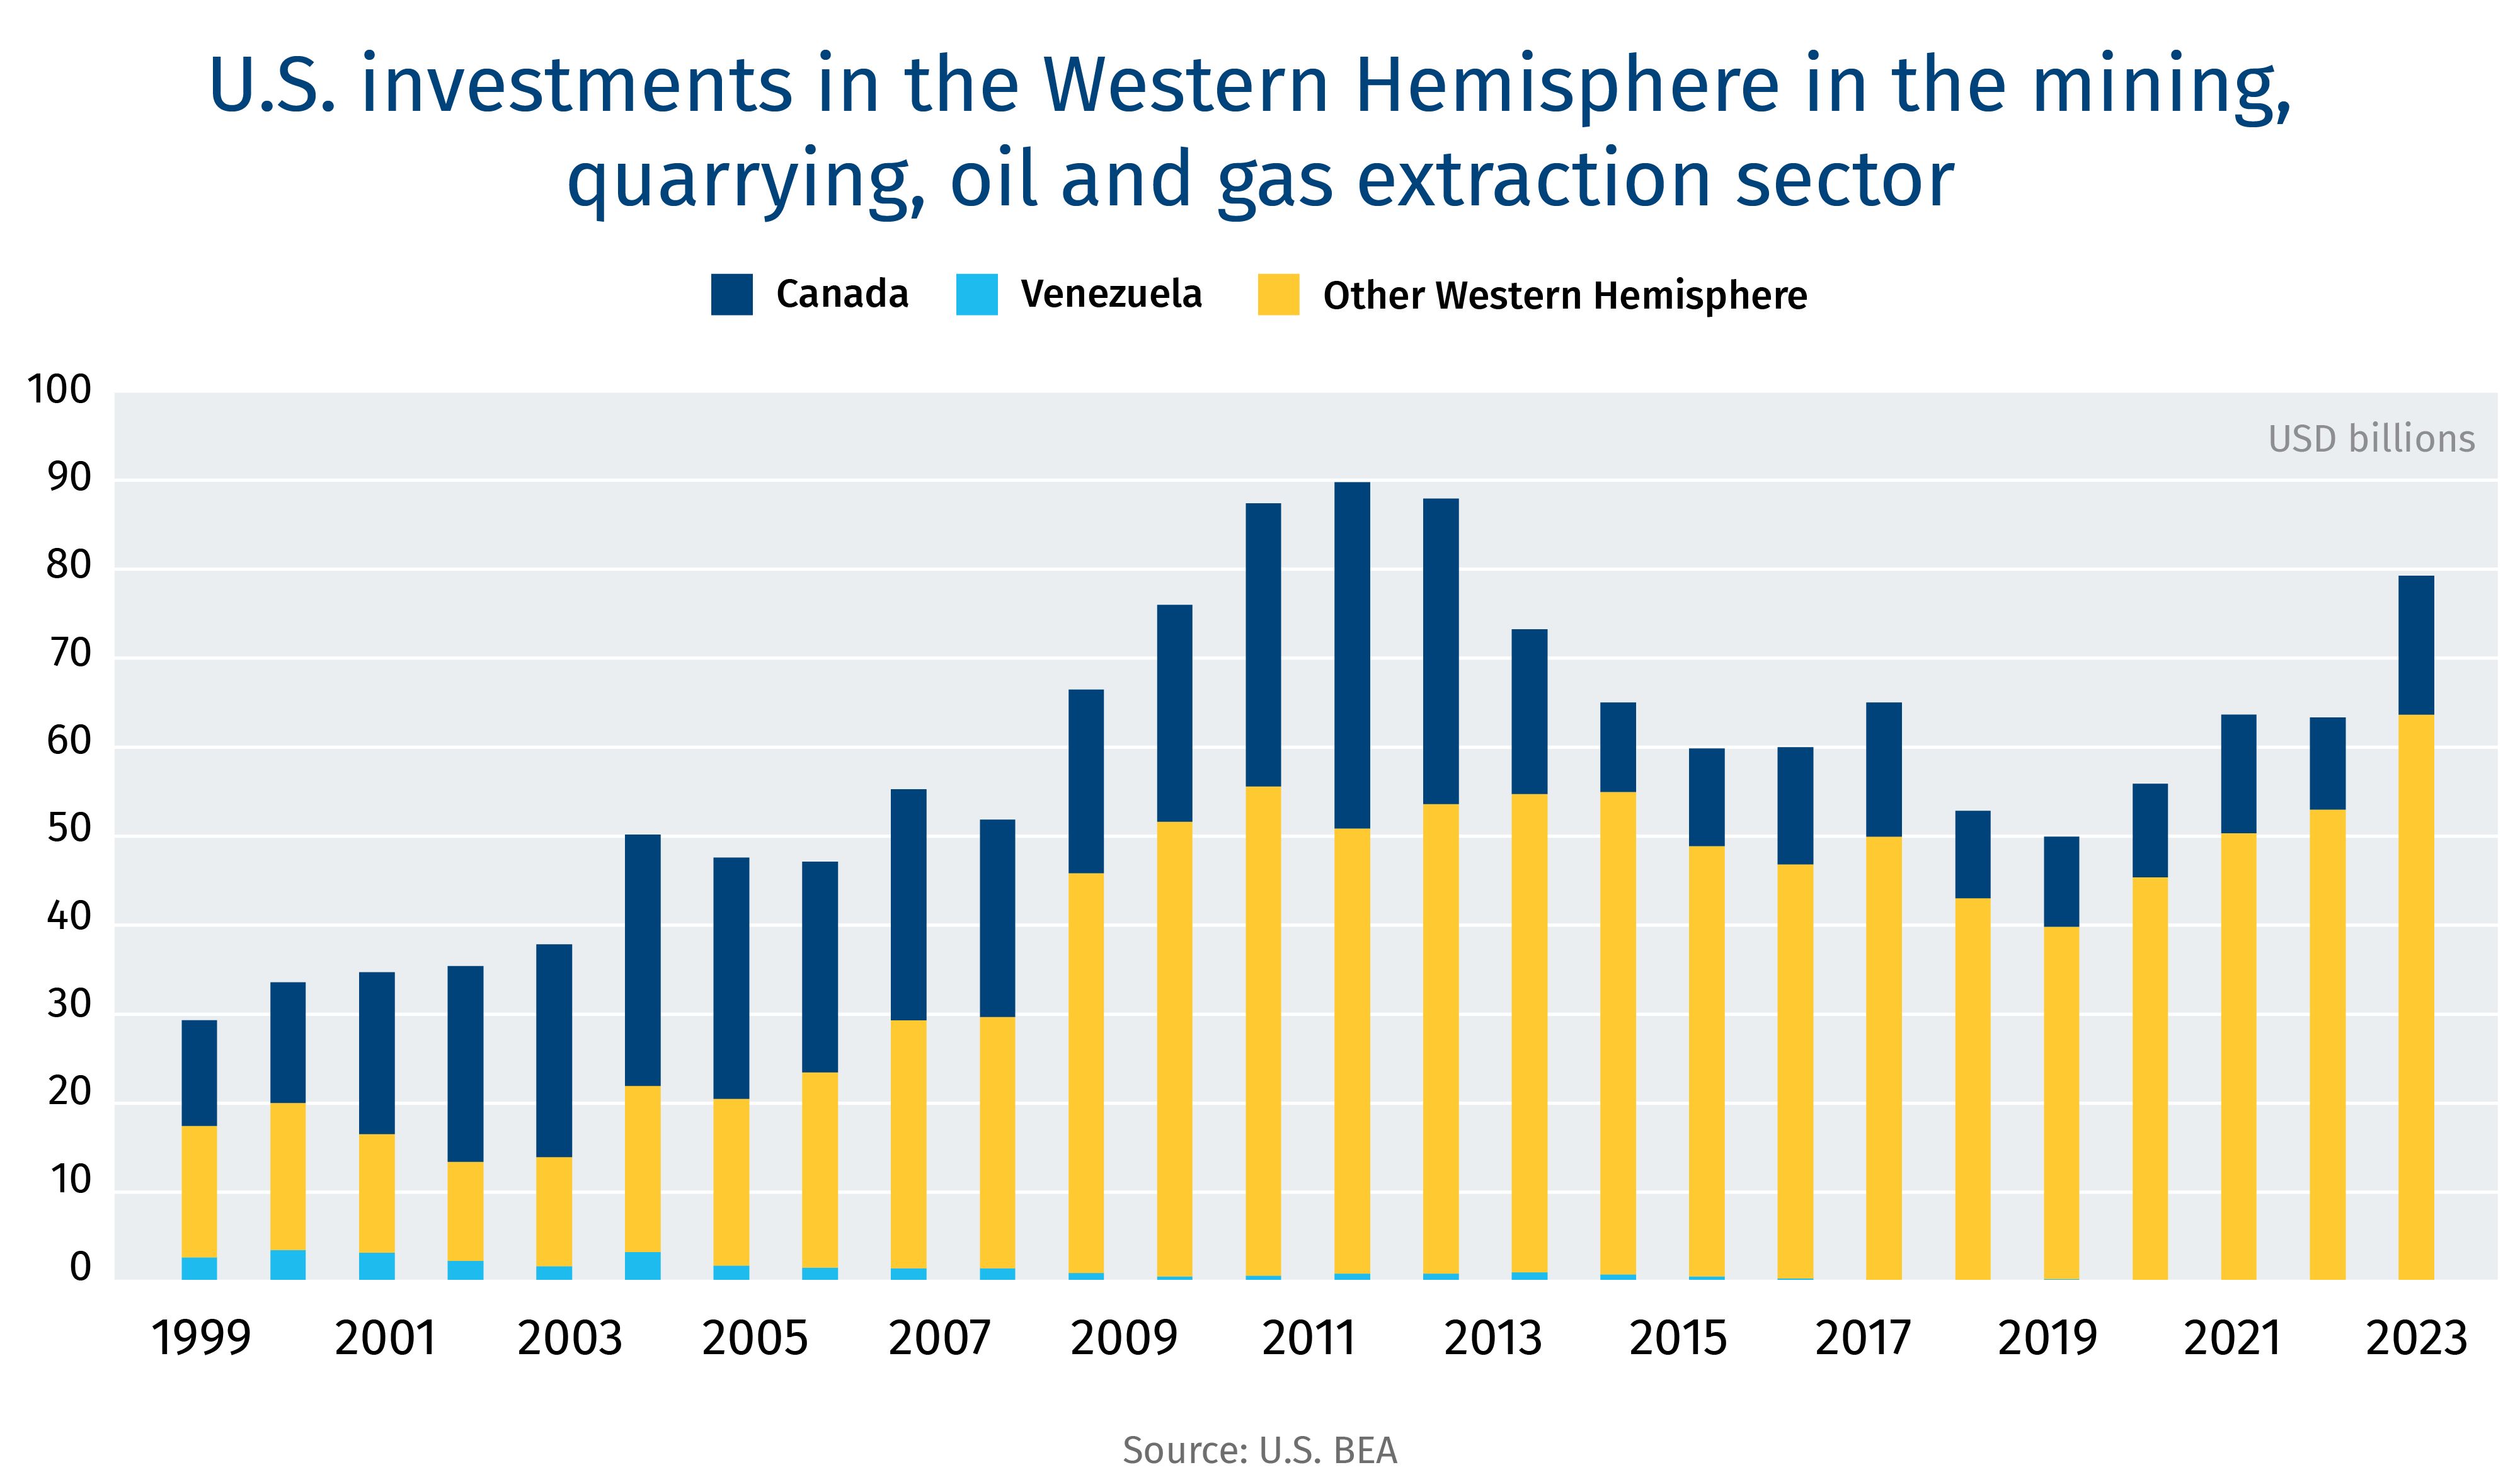
U.S. investments in western hemisphere in the mining, quarrying, oil and gas extraction sector

For all the cross-border integration, U.S. capital investment in the Canadian resource sector (mining, oil and gas) has fallen by more than half from its US$39.1 billion peak in 2011. Meanwhile, U.S. investments into other Western Hemisphere countries has steadily grown from US$16 billion in 2000 to US$64 billion in 2024, even without Venezuela.

The competition for investment dollars from the U.S. into the Western Hemisphere is growing—Canada will need to lock in American capital to ensure it preserves its pre-eminent position in the U.S. market.

The Canada-Alberta Memorandum of Understanding (MOU) sets the stage for the province to become a continental energy superpower across both traditional and non-traditional energy forms. A key piece of the MoU centres around a bitumen pipeline project provided Alberta proceeds with several low-carbon projects and programs in parallel.

As it stands, the province’s major projects inventory consists of almost 1,000 projects valued at $167 billion. Incorporating a new major bitumen pipeline, plus meaningful growth in data centres and accompanying power generation and distribution, could raise that figure to more than $400 billion.

Here are five themes that stood out to us from the MoU:

1. A clear roadmap: The level of specificity within the document gives the MoU teeth. Unlike most MoUs that usually focus on outlining broad contours of areas of co-operation, this MoU sets out clear guidelines and targets.

2. Tight deadlines: The accelerated timelines suggest an urgency that puts the onus on Alberta to deliver, quickly, on several climate policies in order to secure expansion of its fossil fuel sector. Most of the key action items required on the Alberta side (carbon pricing equivalency, methane equivalency, tri-lateral Pathways MoU) have an April 1, 2026, deadline. It also brings an urgency in British Columbia where Premier David Eby would have to make some quick decisions on a new pipeline (and the proposed expansion of Trans Mountain pipeline) across his province.

3. A new bitumen pipeline: The success of the MoU, especially in the context of a new, large bitumen pipeline, revolves around the historically challenged duty to consult and the Build Canada Act to bypass future legal challenges, which at this point appear almost certain.

4. A 700,000-bpd proposition:
The Alberta government is expected to remain the central pipeline proponent until all parties—including Indigenous groups— are on board to reduce the possibility of delays and cost overruns that has plagued past pipeline expansions. In the nearer to mid-term (next five years), pipeline expansions across Enbridge’s Mainline and the federal government-owned Trans Mountain will add up to 600,000 to 700,000 barrels per day in added capacity, which should be enough to support growth for the remainder of this decade.

5. Low-carbon boost: The space given to non-oil and gas commentary such as a substantial expansion of power generation for traditional heavy industry, but also around data centres, interties, and domestic supply chain capture (e.g., Canadian steel and pipeline), suggests that the federal government is creating linkages to ensure a potential Alberta boom cascades across industries and provinces.

What’s being overlooked:

  • The increase in Alberta’s TIER price to $130 per tonne does not specify a date. The Canadian federal benchmark was set to cross that threshold in 2027/2028. Current Alberta TIER prices have since risen to $25-27/tonne (from $17-18/tonne just a couple weeks ago) according to RBC’s Environmental Markets trading desk, implying a 5x return if prices reach the threshold level;

  • The MoU makes specific reference to include enhanced oil recovery (EOR) as part of an extension of existing federal investment tax credits for carbon sequestration, utilization and storage (CCUS). The economic uplift from the ability to monetize the additional oil stream can be meaningful. According to a University of Calgary study, certain Alberta EOR-CCUS reservoirs are economically viable at a carbon price of $60/tonne. In comparison, a Colorado School of Mines study suggests that in the U.S. allowing EOR within the 45Q tax credit— designed to accelerate carbon capture, utilization and storage—could provide an additional economic benefit of between US$95-$120 per tonne of CO2e.

  • Both the construction of a bitumen pipeline and construction of the oilsands-led Pathways carbon capture, utilization and storage (CCUS) project are preconditions of one another. Yet, that precondition is dependent upon the commencement of ”Pathways Phase 1 Projects” (22-million tonnes out of Pathways’ total 50-million tonne capacity). It’s unclear if that references the sequestering (12 million tonnes) or emissions reductions (10 million tonnes) initiatives.


    Shaz Merwat is Energy Policy Lead at RBC Thought Leadership

Energy. Geopolitics. Trade.

All three topics were on full display at Columbia’s Global Energy Summit 2025. Tariffs and trade policy dominated the Summit, with significant implications to both the supply and demand of North American energy. Shaz Merwat, Energy Policy Lead of RBC’s Climate Action Institute, was in attendance and shares the five most pressing themes at this year’s event.

1. Energy risks becoming more complex

The push to re-orient trade flows to manifest specific economic outcomes (reduce a trade deficit, reshore production) likely increases price risk through a bifurcation of supply and demand in key commodities. At the most obvious, tariffs levied on steel, aluminum and possibly copper–all key inputs to energy infrastructure–result in regional pricing. As seen in the chart below, U.S. aluminum prices have largely decoupled from European pricing as a result of Trump’s tariffs. Similarly, price differences between U.S. Midwest hot rolled coil steel prices (US$1,075/tonne) and Northern Europe hot rolled coil steel (US$715) has increased to about $360/tonne, compared to $150/tonne at the start of the year.

Geopolitically, risks are also expanding beyond the simple ‘Middle East’ supply risk that we have known for the last half century. Spheres of influence can re-orient supply and demand relationships, especially in the case of LNG and critical minerals. These emerging geopolitical trade barriers ultimately weaken an otherwise more ‘global’ market to absorb supply and demand shocks–which likely are more deliberate at a time when weaponized trade is becoming increasingly more common (Russian gas, Chinese supply chains, the American market).

2. What is this energy dominance you speak of?

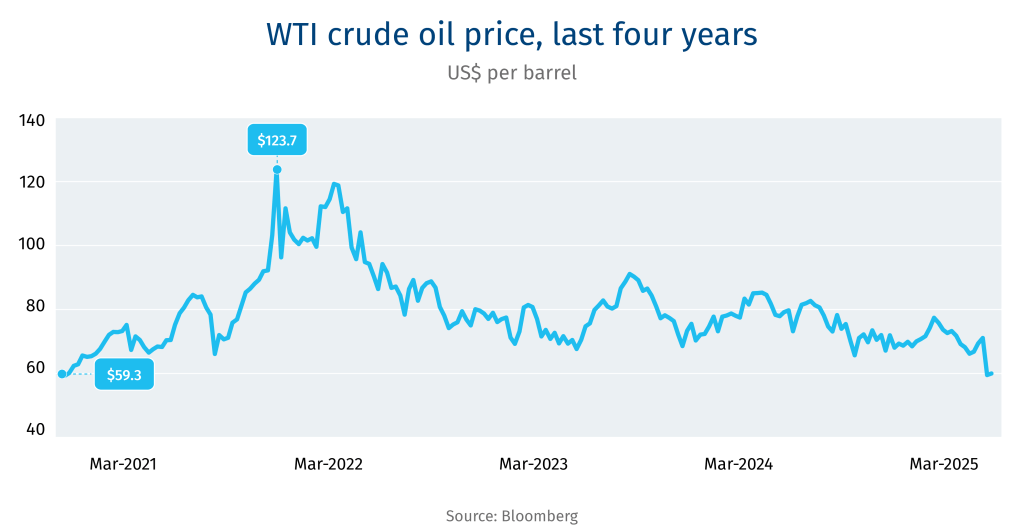
While the Administration has vowed to unleash U.S. energy dominance, to date, it appears to have done the exact opposite. On oil, Trump’s trade/tariff agenda has driven oil prices lower than those witnessed for most almost all of Biden’s presidency. WTI has twice dipped below US$60 per barrel in the past week–a level widely seen as U.S. shale’s breakeven–leading to increasing concerns of idled rigs and declining production; S&P Global estimates US$50/bbl oil could cause a U.S. production decline of 1 million bbl/d. All the while, OPEC is boosting production.

The continued desire to gut funding for the Inflation Reduction Act also stymies U.S. renewable energy, even for tax credits deemed friendly to the oil industry (such as the 45Q carbon capture tax credits). Lastly, concerns around supply inflation (steel/aluminum tariffs) and general market/economic uncertainly has created a very challenging environment to deploy capital.

3. Climate trade frictions remain alive and well

With the gutting of the WTO and Trump’s reciprocal tariffs, developing nations are increasingly seeing their preferential trade terms (higher ‘allowable’ tariff rates) erode. You can add climate to that list, as nations impose climate-related trade measures to enhance economic competitiveness.

In Europe, carbon border adjustments protect domestic carbon policy. In the U.S., a border pollution fee leverages America’s carbon advantage–especially in relation to China. The U.K. and Australia are also exploring carbon border adjustments of their own.

Domestic carbon policies without a climate trade measure (such as a CBAM), politically, is almost certainly bound to fail. Yet, expectations for developing nations to enact similar carbon prices as the E.U.’s emissions trading scheme–a system that has seen carbon pricing increase/expand over the last two decades–in a mere few years, seems unjust. This likely only accentuates climate trade tensions between North and South.

4. Reducing the trade deficit

In the eyes of U.S. President Donald Trump, reciprocal tariff rates yield a balanced trade relationship. For trade partners, a balanced trade relationship is as good as a ‘due north’ one can expect under Trump’s vision of America First. Trade partners will be served well if they can better house American (merchandise) exports.

In this world, U.S. LNG likely shines bright. The country is expected to surpass Qatar as the largest provider of U.S. LNG, globally, by 2030 according to RBC Capital Markets forecasts as seen below. For major LNG buyers that run large trade surpluses with the U.S. (the E.U., Japan, Korea, India), greater purchases of LNG supply can be the ‘easy’ win.

5. AI clusters and cross-border data flows

Nations with abundant, cheap electricity are best positioned in the race to build data centers. This likely results in supply ‘clusters’, especially torqued to renewable generation given the climate commitments of tech firms. Consensus is increasingly pointing to Canada, the U.S. and the Middle East as becoming cluster of American artificial intelligence deployment.

But what does that mean for data flows? Data protectionism towards data hosting (colocation) likely remains, but more alignment is needed on cross-border data transfers resulting from compute capacity (hyperscale). We expect more on this in the renegotiation of USMCA in 2026.

Shaz Merwat is the Energy Policy Lead of RBC’s Climate Action Institute
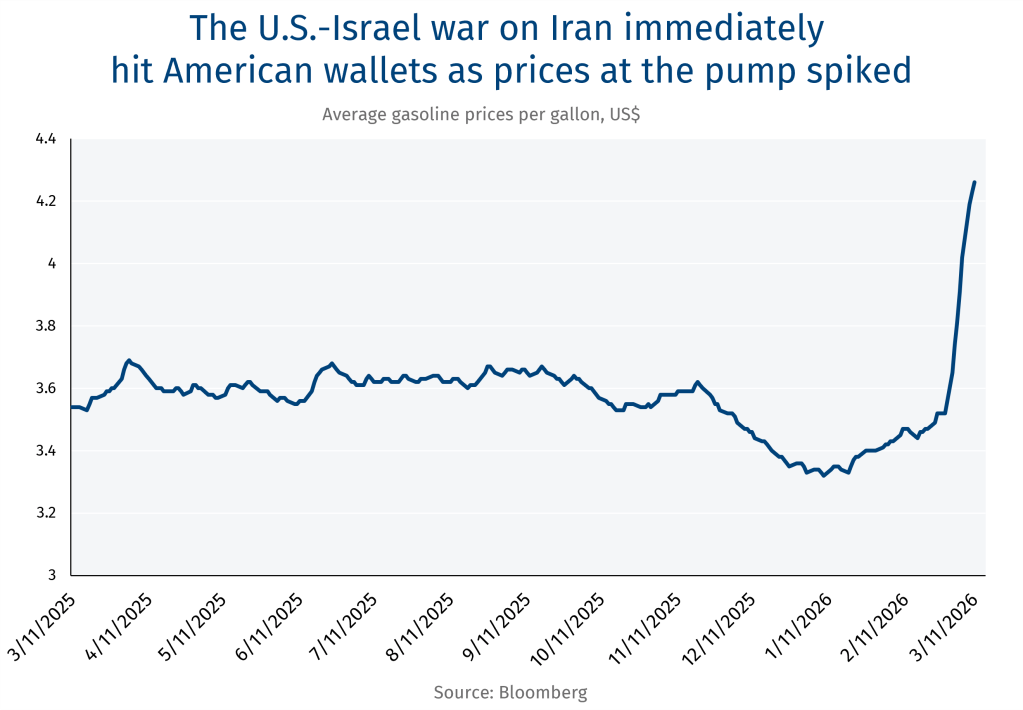
Excluding energy, Canada has a trade deficit with the United States. That’s the top message Ottawa sent to Washington in a filing in response to U.S. Trade Representative’s (USTR) request for comments as it assesses the “unfair” practices of its trading partners.

U.S. President Donald Trump has decried the trade surplus Canada enjoys against the U.S., calling it “essentially a subsidy”. Ottawa’s eight-page filing, however, noted that the surplus is primarily due to American refiners’ preference for affordable, reliable Canadian fuels that Americans count on to power the U.S. economy.

Excluding energy, the U.S. has enjoyed a merchandise trade surplus with Canada since 2007, which stood at $34.3 billion in 2024. Meanwhile, U.S.’s services surplus with Canada stood at $34.9 billion.

The filing sets the stage for a Canadian response and also tries to get ahead of several sticky points that will likely come up in any future negotiations on the Canada-U.S.-Mexico Agreement (CUSMA).

Here are some of the key themes and numbers—and grievances—that emerged from Canada’s filing:

We are your biggest customer: Canada buys more U.S. goods than China, Japan,  and Germany combined. Canada was the top export destination for 32 U.S. states in 2024, and buys many high-valued finished manufactured products such as equipment, vehicles, agricultural products and a wide variety of consumer goods. Some eight million U.S. jobs are tied to trade with Canada.

Canada shares American concerns over unfair trade practices: Ottawa imposed 100% tariffs on Chinese EVs and 25% on Chinese steel and aluminum products, in addition to other tariffs on Chinese critical minerals, renewable equipment etc.—all these align Canada to several U.S. actions to limit Chinese goods. Ottawa is also monitoring steel import supply chains, and amended its Investment Canada Act last year to address national—and continental—security risks.

Crucially, “Canada is considering additional measures to address risks to Canadian and North American economic security and supply chains,” to crack down on critical mineral being sourced from “jurisdiction of concern.”
Equally critical, Canada emphasized that it’s neither a transshipment risk nor a backdoor to the U.S. market for trade practices that could harm the continent’s collective economic security.

There should be no beef over dairy trade: U.S. dairy exports to Canada has soared to $1.14 billion from $728 million when CUSMA came into force. The U.S. enjoys a dairy trade surplus with Canada, which has grown 45% since 2020. Trump had said Canada’s 200% tariffs on U.S. dairy products is a “trade irritant,” but omitted that the tariffs only apply if the agreed tariff-rate quotas on U.S. dairy imports under CUSMA are reached or exceeded. U.S. negotiators were interested in retail access to dairy during the original CUSMA negotiations, which may pop up again during the renegotiations process. But the quota system is what’s seen as a trade irritant, which may require some accommodation from Canada.

Canadian digital services tax do not discriminate: The tax does not solely target U.S. firms, but applies equally to Canadian entities. Last fall, Canada engaged in a substantive and constructive dialogue with USTR counterparts as part of the USMCA dispute settlement consultation process. The DST, however, has been a persistent irritant that corporations and the U.S. government have raised, and this letter is unlikely to wish that away.

Setting the record straight on VAT: A bone of contention that President Trump raised was Canada’s GST—a consumption tax, equating it to a tariff. The Canadian brief sets the record straight—that it’s not a tariff and does not unduly harm, U.S. firms.

Let’s launch a trilateral Financial Regulatory Forum: The first Trump administration had proposed the creation of a Canada-Mexico-U.S. Financial Regulatory Forum to boost dialogue on financial sector developments and regulations. The forum never got off the ground, but Canada said it welcomes the opportunity to establish the initiative.

We need each other in steel and aluminum: Canada bought 37% of U.S. steel exports , or $5.5 billion, and has historically been a top export destination for U.S. steel for the past fifty years. Meanwhile, U.S. manufacturers rely on Canadian steel are vertically integrated with companies north of the border to maintain their competitiveness.

The U.S. industry is also highly reliant on scrap aluminum – and particularly on primary scrap aluminum of which Canada is the primary source.

Canada has taken steps to protect both industries from unfair trade practices by imposing tariffs on Chinese imports and strengthening its trade remedies regime to address unfair trade and circumvention.

The overall message was Ottawa remains committed to promoting fair trade and countering unfair and non-reciprocal trade practices by other countries to facilitate North American competitiveness and security.

“However, Canada’s ability to take action to combat unfair trade practices from other countries is constrained when faced with unjust and unwarranted trade measures from the United States,” The briefing noted.

Ottawa said it aims to leverage its G7 presidency this year and stress on the issue of unfair trade practices with like-minded countries. Closer to home in Charlevoix, G7 Foreign Ministers came out with a statement calling out China’s “non-market policies and practices that are leading to harmful overcapacity and market distortions”, but watered down language on the human rights situation relative to prior G7 statements.

The G7 will be an important forum this year on issues of trade, economic security and energy, with Prime Minister Mark Carney inviting President Zelenskyy, with whom President Trump is signing a ceasefire deal with that could lead to Ukraine signing away some of its critical minerals. It’s a useful reminder that Canada is one of many countries that is at the receiving end of the U.S.’s economic statecraft measures.

Read Ottawa’s full response here.

With contributions from Shaz Merwat and Varun Srivatsan.

This article is intended as general information only and is not to be relied upon as constituting legal, financial or other professional advice. A professional advisor should be consulted regarding your specific situation. Information presented is believed to be factual and up-to-date but we do not guarantee its accuracy and it should not be regarded as a complete analysis of the subjects discussed. All expressions of opinion reflect the judgment of the authors as of the date of publication and are subject to change. No endorsement of any third parties or their advice, opinions, information, products or services is expressly given or implied by Royal Bank of Canada or any of its affiliates.