Feeding the crisis: The tariff toll on food insecurity
Author: Lisa Ashton
Lisa leads research and stakeholder engagement on climate, agriculture and food, and nature. Prior to joining RBC, she worked at a trade association and as a consultant working with farmers and their agri-food supply chains to design programs and strategies that advance sustainability outcomes. Lisa’s passion for Canada’s agriculture sector—and its role as a global leader in production, innovation, and sustainability—was shaped by her upbringing on her family’s farm in southwestern Ontario. This early interest led her to pursue post-graduate degrees in Ireland, Germany, and most recently at the University of Guelph, where she completed her PhD.
The past few years have been incredibly hard for many Canadians. The pandemic caused massive disruptions to the job market and the highest rates of inflation in decades, which was intensified by the war in Ukraine. And now comes a trade war with the U.S., with its own set of shockwaves, including job losses and supply-chain upheaval, sending the price of goods even higher. Many can’t keep up.
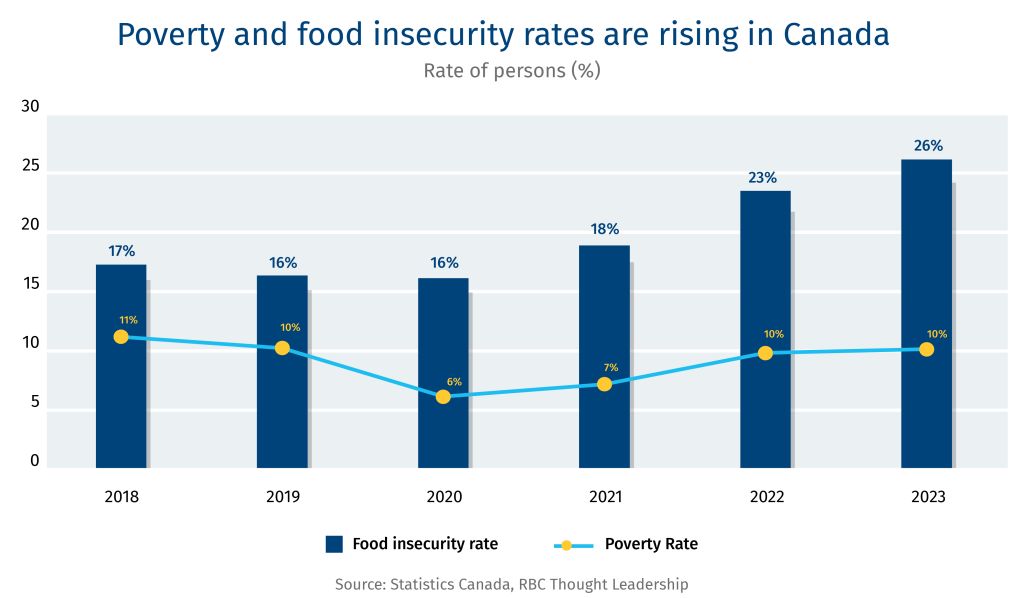
Today, one in four Canadians are experiencing food insecurity. That’s 10 million people—a level never seen before in this country.1 Ultimately, it’s an issue of affordability. There is an abundance of food available. But for an increasing number, it’s out of reach. In March 2024, more than two million visits were recorded at Canadian food banks. That’s a 90% increase in just five years.2 And food banks are a last resort, signalling how dire things have become. Properly supporting and resourcing food banks is critical. However, addressing food insecurity longer term, relies on building a stronger Canadian economy. This includes addressing the affordability crisis, improving productivity, and advancing durable economic development in Canada’s rural and remote areas.
Trade war on food: Rising job loss, costs, and disruptions
Job loss and insecurity is forcing many to make difficult choices
U.S. President Donald Trump’s trade war has caused widespread uncertainty. Launches have been delayed. Production has been paused. Layoffs have been announced. Between January and May, Canada’s manufacturing sector lost 54,000 jobs and the country’s unemployment rate rose to 7%, the highest it’s been since 2016, excluding the pandemic.3 4 Trade exposed industries, including manufacturing, continue to scale down jobs, and now there is greater uncertainty in steel and aluminum jobs with Trump’s 50% tariff on the industry. All this volatility can leave workers in precarious financial situations.
The average Canadian household spent about $76,750 on goods and services in 2023, with 15% and 32% of their money spent on food and shelter, respectively. The lowest income quintile spent $40,080 annually—nearly half that of the average household—with 18% spent on food and 35% on shelter.5 In the event of a job loss—or the fear of potential layoff—Canadians in higher income brackets can cut spending on discretionary items (e.g., new clothes, meals out) in the short term. Lower-income households don’t have that luxury and are left with difficult choices between what basic needs—utility bills, medication, food—they’ll cover. These choices can also impact the quality of food purchased, with lower income households opting for cheaper, lower-nutrient-rich foods.6
Like downturns in the job market, swings in international commodity markets impacted by tariff wars can impact Canadians whose income is directly tied to market prices. Farmers are often price receivers—unable to pass rising costs onto buyers and consumers. And China’s tariffs on agri-food products including canola oil and seafood have recently taken a toll on Canada’s rural economy. Nova Scotia is thought to be the hardest hit by China’s 25% duties on aquatic products, which represented 9.2% of the provinces total export value in 2024. Farmers and fisherpersons are familiar with volatility in the marketplace from bad weather to shifts in demand. Still, ongoing disruptions can erode stability in rural and remote regions that are already at a disadvantage in accessing economic opportunities and services.
And the impact of tariffs is not just about job security. Windsor, Ontario, for example, is reliant on automotive and advanced manufacturing, food processing, and grains and oilseed handling and shipping. This exposes the entire city and surrounding area to Trump’s tariffs on auto as well as China’s retaliatory tariffs on Canada’s agri-food products. Unemployment in Windsor is higher than the national average at 10.8% in May 2025, up from 7.8% in May 2024.7 And the knock-on effects from multiple pressures on employment within a region and rising costs of living can trickle down to local retail and services. As consumer spending tightens, all sectors and their workers are impacted.
Rising cost of living threatens to further deepen the food insecurity crisis.
With rising costs in Canada, a job is no longer a precursor for meeting basic needs. More than 60% of Canada’s food-insecure households rely on wages, salaries, or self-employment income as their primary source of income.8 Workers experiencing moderate to severe food insecurity often occupy low-wage or precarious jobs that are not keeping pace with the cost of living. Visible minorities, women and new immigrants in Canada earn less than the national average. As a result, food insecurity is disproportionality experienced by these groups. More than 46% of black households and 39% of the Indigenous population living off-reserve are food insecure.9 Single-mother households also have higher rates of food insecurity at 52%.10
The effects of food insecurity further marginalize vulnerable groups. Food insecurity is associated with higher rates of chronic diseases, including diabetes and cardiovascular disease. This means more visits to the doctor’s office and the hospital. Severely food insecure Canadians incur health costs that are more than double those who are food secure.11 Food insecurity also impacts the physical and mental development of children, as well as academic performance and behaviour.12 These impacts underline the health and socio-economic costs to families and the Canadian economy.
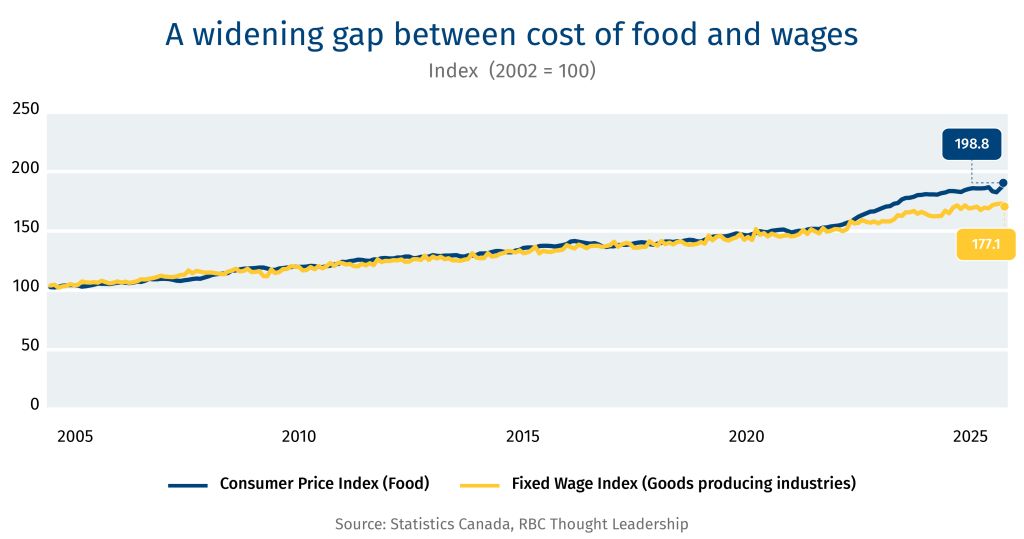
Over the past five years, the affordability crisis has been acutely experienced by households whose wages are not keeping pace with the rising price of goods and services. With pre-tariff inventory coming off grocery store shelves, tariffs are starting to intensify the unaffordability of products in Canada, especially food. Since January 2025, food prices have been a notable driving factor growing the Canadian Consumer Price Index. In April 2025, food prices increased by 3.8% from last year.
Supply chain disruptions impact food consistency and costs
Food companies and retailers reported loses in the first quarter—a direct result of the tariff wars.13 On top of mitigating losses, Canada-U.S. agri-food supply chains are now tasked with additional administrative demands in proving the Canada-United States-Mexico (CUSMA) trade agreement compliance as only two-thirds of Canada’s agri-food exports in 2024 were traded under CUSMA. These stacking complexities and added costs cannot only be absorbed by agri-food suppliers, wholesalers, and retailers, who often operate on thin margins. Eventually rising costs are passed onto the consumer. In the U.S., the impact of tariffs is estimated to increase food prices by 2.6% in the short run, disproportionately impacting fruit and vegetables, that are expected to rise 5.4%.14
Trade wars have sparked a diversification movement. And while trade diversification is a strategy to grow and strengthen Canada’s agri-food exports, it can also result in trade-offs such as short-term uncertainty in quality and cost for consumers while supply chains are being established. Stability and consistency in trade is a key factor in keeping transportation, logistics and operational costs down for traders, wholesalers and retailer, which helps ensure consumers have consistency in price, quality, and availability. Now, uncertainty from tariffs jeopardizes these benefits that North American consumers have become accustomed to through Canada and the U.S.’s interconnected supply chains.
The next step: Tying food solutions to Canada’s growth ambitions
Solutions to food insecurity in Canada are well documented but the issue remains on the sidelines when it comes to large-scale policy and funding commitments.
Potential solutions include:
Address the disparity between Canada’s rural and urban as it relates to access to resources, living wages, and economic development opportunities.
Rebuild Canada’s social safety net to better support low-income households and proactively respond when a household has lost income or has experienced a disruption that impacts its budget.
Improve the affordability of housing.
A food security target may be the catalyst needed to pull these solutions together to drive action across Canada and track progress. This is not a new idea. Food security experts in Canada have called for a 50% target by 2030.15 16 But now is the time to implement a bold vision for food security in Canada as the country sets out to build back a better economy. A key challenge is identifying where food security solutions can be aligned with existing landmark commitments to build momentum. A food secure plan for Canada must also consider how it proportionally improves rates in regions and among groups that are the worst impacted.
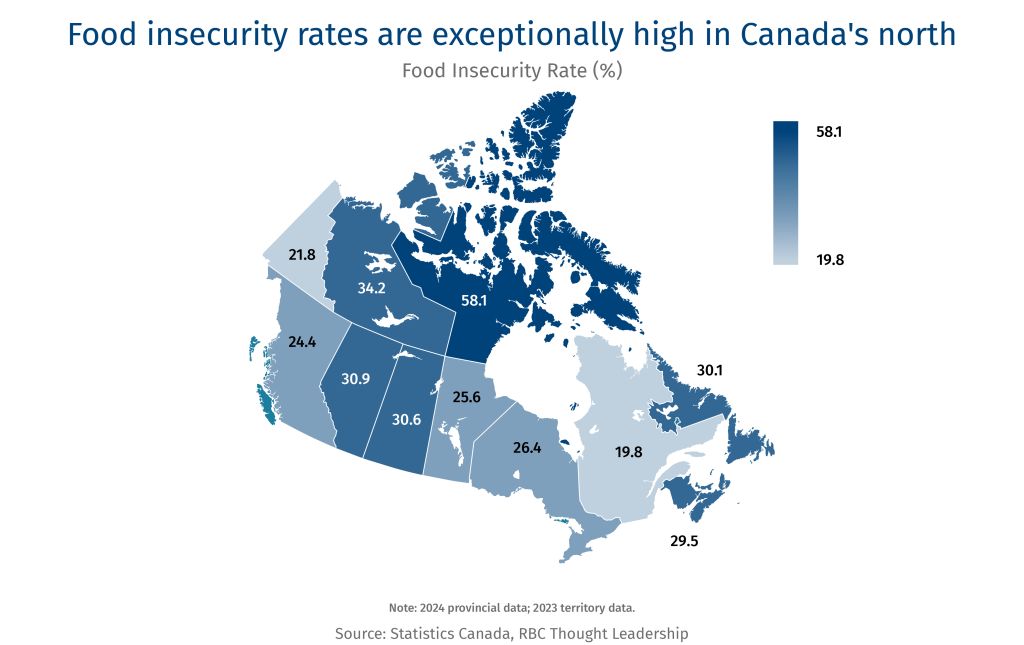
Expedite the development of rural and remote community and health services alongside efforts to expedite Canada’s major infrastructure projects. Canada’s ambitions to accelerate major infrastructure projects from the Port of Churchill to the Ring of Fire are primarily concentrated in northern rural and remote Canada. Canada’s rural and remote areas account for 25% of Canada’s GDP but are grossly underserviced when it comes to health care, housing, and other basic needs, including access to healthy food.17 Food insecurity is high across Canada but is highest in northern and remote areas. More than 58% of people in Nunavut experience food insecurity. Further, only 7% of doctors work in rural areas despite the fact Canada’s rural population accounts for 18% of the total population.18
Much of Canada’s plans to build its economic security and sovereignty hinges on having a productive workforce in rural and remote Canada. But getting people to stay in rural and remote areas or relocate for these projects is a tough sell if they can’t access resources needed for their families to lead a healthy life. Canada can help flip the trend of urban areas growing 15 times faster than rural by mitigating brain and resource drain through investments in community resources including access to healthcare, food and housing that match the ambitions of major infrastructure projects.19
Improving access to household financial supports and benefits through policy reform. It is especially timely to advance such reform efforts as the Liberal government has committed to review and reform the process of applying for the Disability Tax Credit (DTC). The DTC is the gateway to key federal programs, including the Canada Disability Benefit, the Canada Child Benefit for children with disabilities, and the dental benefit. This review process is an opportunity to engage Canada’s network of food banks servicing families that rely on DTC benefit to develop practical solutions that work for households, especially those experiencing housing and food insecurity.
On top of qualifying for benefits, Canada’s most vulnerable groups, including those with disabilities and houseless people, are often the hardest to reach populations for tax returns, and have filing rates below Canada’s national average of 92%.20 Unfiled taxes and unclaimed returns account for more than 8.9 million uncashed Canada Revenue Agency (CRA) cheques, totaling $1.4 billion.21 The value of household tax credits won’t solve a household’s financial challenges, but it’s a start.
Building upon CRA’s automatic tax filing pilot and approaches to streamline and simplify tax filing, there is an opportunity to explore support services that better position Canadians to navigate administrative processes to qualify and access credits. And to learn from community organizations including food banks who offer “wrap around services” such as food and financial literacy programming for Canada’s most vulnerable and marginalized populations.
Align food security objectives with Canada’s home building boom. Cutting housing costs can transform a household’s budget. The new federal Liberal government’s plan to build 500,000 homes a year would boost the economy and address a critical need: one of the priority functions of Canada’s forthcoming entity “Build Canada Homes” (BCH) is to build affordable housing at scale. This priority includes a $6 billion commitment for deeply affordable housing including supportive housing, Indigenous housing, and shelters. Complementary to building these homes rapidly and setting homelessness targets with provinces, government could also consider aligning with national food security targets and activities as a measure of their success in affordable housing and enabling people to achieve a healthy, more productive lifestyle that in turn contributes to growing Canada’s economy.
Food insecurity is a systemic problem, requiring systems-based solutions. As Canada embarks on its pro-growth era, it is opportune to consider how its unified approach can be applied to address the most chronic symptoms of a poor economy—food insecurity and poverty.
Experiences and approaches from around the world
Food insecurity affects every country, and over 295 million people worldwide face acute hunger.1 Countries are taking different approaches to measure, monitor, and mitigate the issue, which extends far beyond food programming and policy into income, housing and social equity domains. However, advanced economies like Canada are increasingly expanding food programming to counter the short-term impacts food insecurity is having on communities.
More than 7 million people, or 11% of the population, in the U.K. are living in food insecure households.22 And one-third of children in the U.K. are living in poverty. To tackle this challenge, the government launched a Child Poverty Taskforce.23 The U.K. also has a few notable programs that directly relate to food access such as:
Free school meals program provides meals for children and young people during school with standards on the nutrition of food offered. Complementary to school meals, the UK launched Holiday Activities and Food (HAF) in 2022 to improve access to food and resources during school breaks.24
Healthy Start vouchers in England, Wales, and Northern Ireland support people on low incomes to access pre-natal vitamins, infant milk formula, and healthy food for young children. In Scotland an equivalent Best Start Foods program launched in August 2019.
Household Support Fund: Allocated £1.5 billion in 2022/23 to help with household essentials, including food, energy and housing bills.
The U.K. is also undergoing its largest home building campaign since World War II. The lack of affordable housing and its impact on household stability and spending is a key driver for this building boom. The campaign goes as far as outlining a plan for creating a dozen new towns of approximately 10,000 homes each.25
In New Zealand, 27% of households with children ran out of food often or sometimes in 2023, up from 14.4% in 2021.26 In response to rising rates of food insecurity, New Zealand led the development of a 10-year food security roadmap for the Asia Pacific Economic Cooperation (APEC) covering four key areas: digitalization, productivity, inclusivity and sustainability. APEC includes 21 member countries across the Pacific Rim, including Canada.
Food security research, policy and programming are delivered under multiple ministries in New Zealand, including health, education, and social development ministries, signalling the recognition of food insecurity’s impact on human health and wellbeing. Within New Zealand there has been a growing movement to improve access across its four main regions to resources for basic needs and to improve healthy living standards:
Launch of the Public Health Advisory Committee in 2022, which was asked in 2023 to review New Zealand’s food system and provide advice and recommendations, which are presented in the 2024 report, Rebalancing Our Food System.
New Zealand provides some government funding to maintain community food distribution infrastructure and support regional community food hubs under its Food Secure Communities program, which was established in 2020.
Ka Ora, Ka Ako (Healthy School Lunches Program) was launched in 2019 to provide free lunches to students attending schools in low-income areas. The program is active in over 1,000 schools and provides meals for nearly 240,000 students every day.
Food insecurity affected 47 million Americans in 2023. The U.S. has experienced a similar post-pandemic trend to Canada with the rate of food insecure households rising from 10% to 14% between 2021 and 2023.27 Among those in the OECD, only Costa Rica has higher levels of income inequality. And proposed legislation such as, One Big Beautiful Bill Act, risk worsening inequality in the U.S. by raising national debt and potentially triggering cuts to programs that are designed to reduce food insecurity and improve food access, including:
The Supplemental Nutrition Assistance Program (SNAP) provides a restricted subsidy to purchase food. SNAP serves an average of 42.2 million people per month (12.6% of the US population).28 Participating in SNAP for six months has been shown to decrease food insecurity by 5-10 percentage points and is even more effective for children and those with very low food security.29 30 SNAP has also shown to positively impact local communities’ economic activity and job creation.
The Special Supplemental Nutrition Program for Women, Infants and Children (WIC) provides a restricted food subsidy for pregnant and post-partum people, infants and children up to five years old who meet both income- and nutrition-based eligibility criteria.31 In 2023, the federal government spent US$6.6 billion on WIC program, reaching an average of 6.6 million people per month.32
Statistics Canada. Food insecurity by economic family type, 2025.
Food Banks Canada. HungerCount 2024, 2024.
Statistics Canada. Labour force characteristics by census metropolitan area, three-month moving average, seasonally adjusted, 2025.
Statistics Canada. Employment by industry, monthly, seasonally adjusted and unadjusted, and trend-cycle, last 5 months (x 1,000), 2025.
Statistics Canada. Household spending by household income quintile, Canada, regions and provinces, 2025.
French et al. Nutrition quality of food purchases varies by household income: the SHoPPER study, 2019.
Statistics Canada. Labour force characteristics by census metropolitan area, three-month moving average, seasonally adjusted, 2025.
Li T, Fafard St-Germain AA, Tarasuk V. Household food insecurity in Canada (2022), 2023.
Statistics Canada. Food insecurity by selected demographic characteristics, 2025.
Statistics Canada. Food insecurity by economic family type, 2025.
Statistics Canada, Canadian Community Health Survey (CCHS) 2005, 2007-2008, 2009-2010, Ontario administrative health databases. Adapted from: Tarasuk, Cheng, de Oliveira, Dachner, Gundersen & Kurdyak (2015)
Gallegos et al. Food Insecurity and Child Development: A State-of-the-Art Review, 2021.
The Budget Lab at Yale. State of U.S. Tariffs: April 15, 2025
Food Banks Canada. Joint Open Letter: Cut Food Insecurity in Canada in half by 2030, 2025.
Beardsley, McCain, and Saul. Let’s commit to cutting food insecurity in half, 2022.
Innovation, Science and Economic Development Canada. Rural Economic Development.
Canadian Institute for Health Information. A profile of physicians in Canada, 2025
Statistics Canada. Census in Brief, 2022.
Canada Revenue Agency. Statistical report on the participation of the hard-to-reach populations in the tax and benefit systems, 2024.
Canada Revenue Agency. Approximately $1.4 billion in uncashed cheques is sitting in the Canada Revenue Agency’s coffers, 2022.
UK Parliament. Who is experiencing food insecurity in the UK? 2024.
Government of the United Kingdom. Tackling Child Poverty: Developing Our Strategy, 2024.
Government of the United Kingdom. Guidance: Holiday activities and food programme 2024, 2025.
Government of the United Kingdom. Government unveils plans for next generation of new towns, 2025.
Ministry of Health. New Zealand Health Survey, 2025.
USDA Economic Research Service. Food Security in the U.S. – Key Statistics & Graphics, 2025.
USDA Economic Research Service. SNAP in Action, 2025.
USDA Economic Research Service. Measuring the Effect of SNAP Participation on Food Security, 2025.
Johnson-Green and Claflin. Gender and Racial Justice in SNAP, 2021.
USDA Economic Research Service. WIC Program | Economic Research Service, 2025.
USDA Economic Research Service.
Thriving natural ecosystems are critical to growing North America’s resource-based economy. “Build, baby, build” and “Drill, baby, drill” policies are driven by immediate concerns such as trade, economic sovereignty and security, and affordability. But plans for growth should consider building up our foundational asset–nature.
As part of the Salazar Center for North American Conservation’s symposium in Vancouver last week, the RBC Climate Action Institute co-hosted a roundtable with Nature United. The topic: How nature conservation and stewardship can be positioned as a strategic asset in pro-growth plans for nature-dependent sectors, including forestry, agriculture, and mining.
Here’s what we heard:
Focus on the economic benefits. There continues to be a movement away from models protecting landscapes with no public activity or access to those efforts that benefit local economies–creating jobs, spaces for recreation, and new streams of revenue (environmental credits) and businesses (ecotourism, responsible logging, forest management). This shift reflects that durability in conservation requires people. A good example of this is the Heiltsuk Tribal Council’s 2021 purchase of the Shearwater Marine Ltd., a 63-acre resort and marina in Bella Bella, B.C. The Heiltsuk regained an important part of their territory and unlocked new economic opportunities, including eco-cultural tourism.
Communicate with people where they’re at. The energy transition risks leaving behind rural communities dependent on fossil-fuel extraction for employment and economic activity. Revitalizing these communities via nature-based economies can be part of the solution, but generating buy-in depends on how the opportunities are communicated, requiring a focus on place-based values and priorities. In West Virginia, a hotspot for coal mining and a focus of the Trump administration’s efforts in building back the coal industry, there has been a new wave of growth via a nature-based economy focused on job creation and regenerate abandoned towns. Opportunities span responsible forestry and forest restoration, conservation rehabilitation within renewable energy projects on retired coal mine sites, and growing tourism along the Appalachian Mountain range.
A debate over assigning nature a monetary value. While opponents argue against commodifying nature, proponents say that valuing nature enables a broader scope of stakeholders to invest. This debate has shaped nature’s role in environmental offset markets and other mechanisms that drive investment in nature, from budgetary accounting to green bonds. For example, the town of Gibsons, B.C. developed an eco-asset strategy, integrating the value of nature in its planning processes. As a result, the town determined that green infrastructure was cost effective in managing stormwater, resulting in the reduction of associated development costs for residential and commercial projects.
3 things to watch:
Proposed U.S. tax cut package could authorize the sale of nearly 300-million acres of public lands. There is growing concern that these lands will be sold for mining, logging and drilling with limited restraint on the scale. This is an issue for Canada, as well, since neighbouring public lands provide intact natural landscapes for wildlife crossing borders on migration routes. It also plays a critical role in the U.S.’s ability to meet global biodiversity and climate commitments. Public Lands in Public Hands Act is a piece of legislation that aims to prohibit the Secretary of the Interior and the Secretary of Agriculture from selling land of more than 300 acres to a non-federal entity. The bill was initially sponsored by Ryan K. Zinke, Republican congressperson from Montana. While seeking further support, the bill is with the Congress’ Subcommittee on Forestry and Horticulture.
The role of the UN Agreement on Biodiversity Beyond National Jurisdiction on Arctic development. While the agreement has 114 country signatories, only 21 have ratified it so far. That’s well short of the 60 required for it to take effect and ensure the conservation and sustainable use of marine biological diversity in international waters. The Arctic is home to some of the world’s largest intact marine ecosystems–the protection of which is a timely consideration with Russia, China, the U.S. and Canada eyeing Arctic-based tourism, commercial fishing, trans-Arctic shipping, and deep-sea mining.
Can the Carney government build up Canada’s natural resources in a pro-growth environment? The Liberal government platform outlines a plan for expediting and scaling energy and critical mineral projects, parallel to commitments to expand Canada’s nature conservation efforts. The challenge for a Liberal minority government will be integrating Indigenous reconciliation, nature-positive efforts, and resource extraction pathways while addressing tensions such as the pace of projects and the value of nature in extraction-based sectors.
Lisa Ashton, Agriculture Policy Lead, RBC Climate Action Institute
Martha Rogers, Senior Economist, The Nature Conservancy/Nature United
To check the pulse on the agri-food industry, RBC’s Thought Leadership team met with farmers from across Canada last week—from pork producers in Manitoba to members of the fruit and vegetable industry gathered in Montreal for their annual tradeshow.
What’s clear is that the industry is highly motivated to keep up the momentum; last year, Canadian agri-food export value was a record $106 billion. And all eyes are on commodity prices, U.S. farm policy and, of course, the impact of U.S. President Donald Trump’s tariffs.
What we heard:
Many farmers are adopting a keep calm, carry-on approach. Farmers are accustomed to volatility, the result of managing through unexpected weather conditions, shifting commodity prices and equipment breakdowns. Trump’s tariffs are seen by many as just another disruption. That’s led some to ride out the resulting pricing swings (i.e. canola). Others, including grain and oilseed producers, are considering shifting the crops in rotation for the 2025 planting season, a direct result of China responding to Canada’s EV tariffs with their own on peas and canola products.
Meeting the moment for Canadian-made items. The increased demand for made-in-Canada products is leading to American-made spoilage at grocery stores. The movement adds to the push for expanding Canada’s greenhouse sector acreage and diversity of products to close our production-consumption gap for fruits and vegetables.
Canadian food producers and processors are working to bulletproof their USMCA-compliancy. Companies are preparing for scrutiny at the border to prove they are USMCA compliant and adhering to the rules within, such as country-of-origin. Just 0.1% of all agri-food products traded in 2024 were likely not USMCA-compliant but more than a third of Canada’s agri-food exports, albeit compliant, did not trade under the agreement.
Trade diversification is underway. It is, however, yet to be seen if Canadian retailors and traders are going to be able to get like-for-like on quality and price for food products. Exporters and retailors are exploring where else they can source the products they need for their customers. But will Canadians want to buy a Moroccan orange over one from Florida?
Can our ports handle our growth and diversification ambitions? Canada’s turn-around times are slower than key agri-food competitors, including the U.S., Australia and Brazil. The potential influx of product flow at Canada’s ports due to rising costs of moving goods through the U.S. may cause greater congestion and bottlenecks if Canada is not preparing for growth.
3 things to watch:
Emergency U.S. farm support and its impact on Canadian farmers’ competitiveness. The USDA’s Emergency Commodity Assistance Program (ECAP) is a $10 billion one-time economic assistance payment program to help farmers mitigate the impacts of increased input costs and falling commodity prices. For example, U.S. farmers can receive upwards of $77.66 per acre of oats and roughly $30 per acre for soybeans and wheat.
Cuts to U.S. agriculture research programs and services. The dismantling of USAID and cuts to its funding to 19 land-grant university-based innovation labs across 17 states, as well as proposed cuts to NOAA’s climate research can undermine agriculture innovation and risk halting essential services such as weather monitoring.
Risk of rising costs and disruptions for supply chains running through U.S. ports from New Orleans to Philadelphia. Trump’s April 9th executive order, Restoring America’s Maritime Dominance, instructs U.S. Trade Representatives to proceed with a proposal that includes a $1M docking fee at US ports for any ship that is part of a fleet that includes Chinese-built or Chinese-flagged vessels. On top of cost risk, U.S. custom services could slow down these just-in-time supply chains needed to bring Peruvian blueberries to Canada.
Lisa Ashton is Agricultural Policy Lead
Climate action is often associated with groundbreaking technologies, new data, and fresh approaches. But what if the next big climate innovation isn’t something new—but something we already have, simply seen through a different lens?
Ear tag on dairy cow for identification and data collection
Dairy barn in southwestern, Ontario
As Climate Action 2025 highlights, this year has brought turbulence for climate priorities, as trade and geopolitical tensions, particularly with the U.S., dominate attention. With climate action slipping down the priority list, industries must pivot—embedding sustainability into core business strategies, not as an add-on, but as a driver of efficiency, resilience, and growth.
With shifting priorities competing for resources and investments, innovation found right under your nose may hold the key to unlocking new market ready opportunities. Semex, a leading genetics company based in Guelph, Ontario shows us how.
Methane emissions from cattle—driven by enteric fermentation, a natural digestion process— is the largest source of GHG emissions in agriculture and among the toughest to abate. What if the key to reducing them was ready and waiting to be unlocked?
Semex offers animal semen, embryos, breeding services, and software to farmers in more than 80 countries. The company recently identified a genetic trait that farmers can now select to reduce their herds’ methane by 2 to 3% each generation, with permanent reductions of methane emissions estimated to be 20 to 30% by 2050.
The key to bringing this discovery to market wasn’t a brand-new technology—it was a new way of looking at existing industry data. Semex leveraged a national milk database managed by Lactanet, who collects data using mid-infrared (MIR) spectroscopy for milk quality and herd performance. By analyzing this data through a climate lens, researchers uncovered a striking insight: MIR datasets could also be used to predict and influence methane emissions. This existing dataset was the resource needed to unlock insights on methane production by cattle as novel and direct measurement approaches in the barn for methane are still too costly to scale.
Thanks to existing big data and collaboration, Semex was able to bring the methane efficiency trait to market.
This case study highlights a vital lesson: climate innovation doesn’t always require new tools—sometimes, it’s about looking at what we already have through a new lens. Businesses that embrace this mindset can unlock new efficiencies, market advantages, and climate solutions without reinventing the wheel.
For more on policies, people and companies driving climate action in the agriculture sector, visit the sector analysis of our flagship report here.
Key takeaways
U.S. trade tensions have cast a spotlight on Canadian food trade: American tariff threats pose a special challenge to Canadian agriculture and agri-food exports, as they now account for 20% of U.S. agri-food imports.
Exports to the U.S. are growing: Over 60% of Canada’s agriculture and agri-food exports go to the U.S.—and the value of those exports has quadrupled since 2000.
But Canada’s falling behind competitors globally: Canada’s position in global agriculture and agri-food trade has slipped to 7th from 5th place, and could drop to 9th by 2035 if corrective measures aren’t taken.
Rivals are gaining ground in the world’s top growth markets: Emerging competitors like Brazil have gained ground in Africa and the Middle-East, while traditional rivals like Australia are gaining market share in Southeast Asia.
Canada can increase our global share by 30%: With the right investments, Canada can increase global share from 3.7% to 4.8% to regain 5th place in exports, according to new modelling by RBC and the Boston Consulting Group’s Centre for Canada’s Future. That could add $44 billiona to agriculture and agri-food’s export value by 2035.
A clear plan is critical: To regain market share, Canada needs to focus on innovation, investment, export-oriented infrastructure, digital infrastructure, and overseas agri-food promotion.
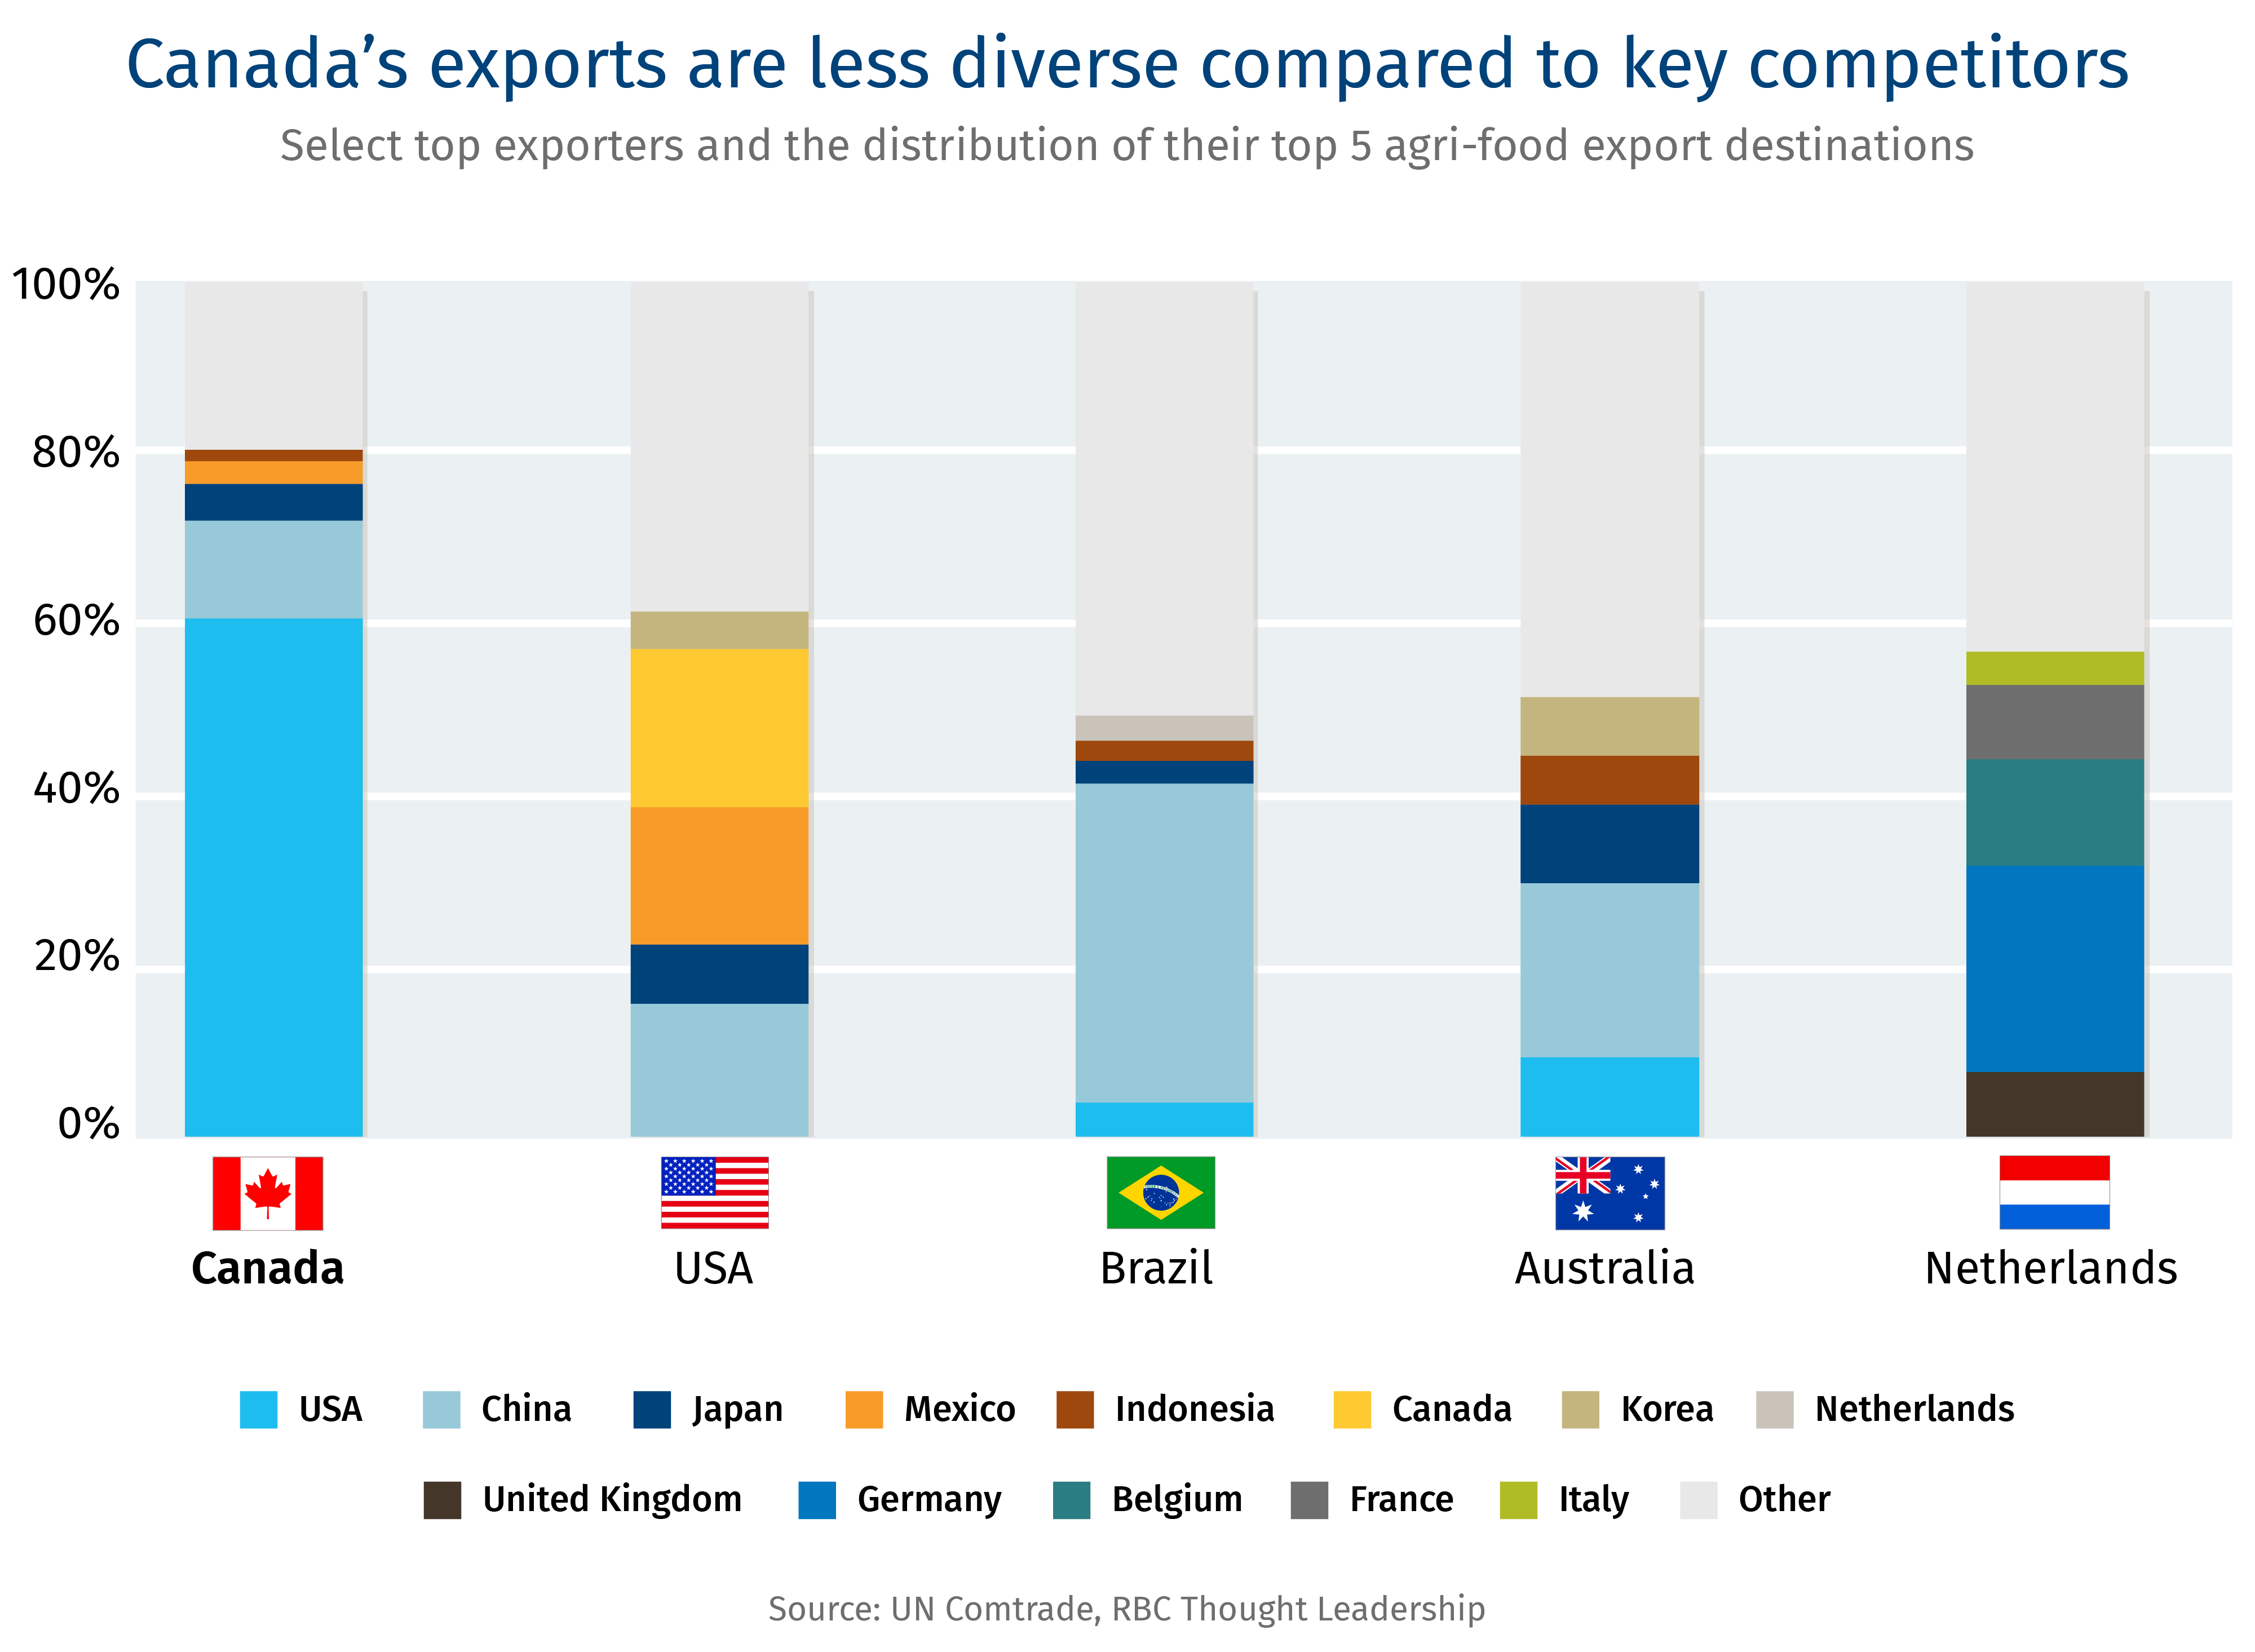
Canada has become overly reliant on the US for agri-food exports
Steel, autos, lumber and oil: The growing trade conflict between the United States and Canada has focused on the backbone of our blue-collar economy. But check any border crossing, and you’re just as likely to see food and agriculture products—be they lobsters trucked from Nova Scotia to Maine, or muffins from Toronto to Chicago, or cattle from Alberta to Montana.
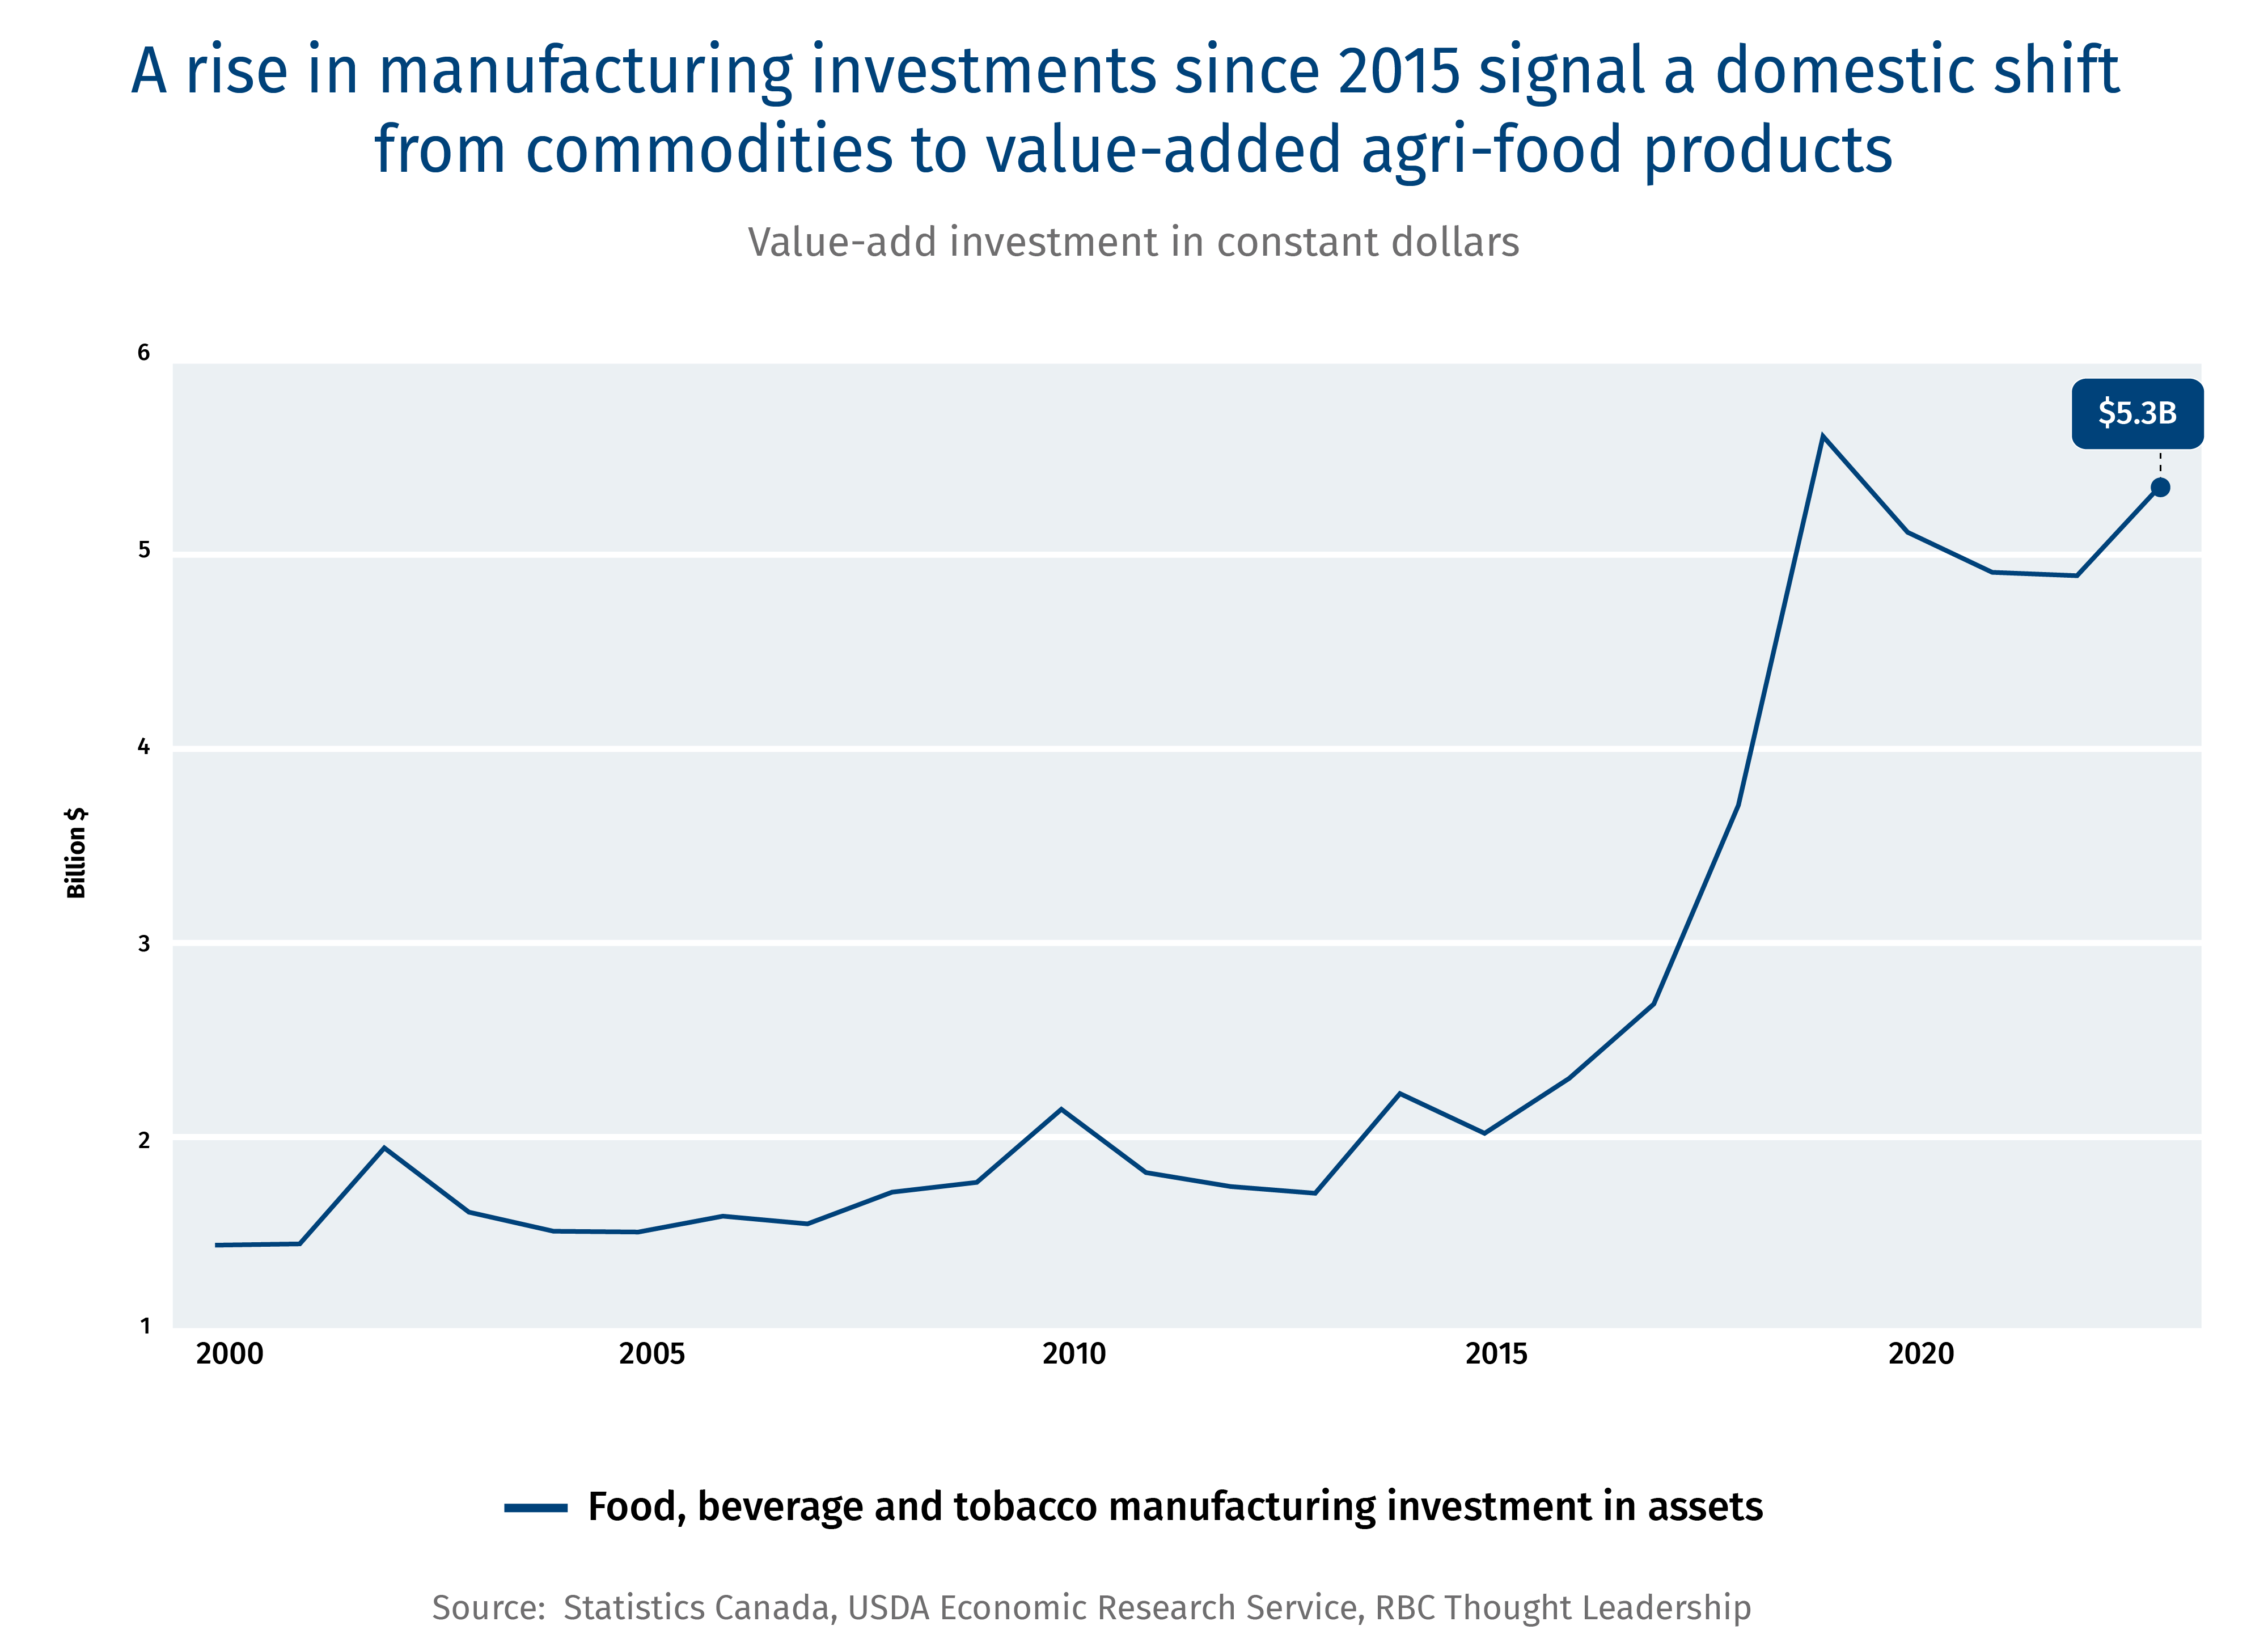
More than $100 billion worth of agriculture and agri-food products cross the border every year, with the U.S. importing nearly 60% of this trade. And thanks to a surge in agri-food processing investment over the last 20 years, that trade gap is growing. The value of Canadian exports to the U.S. has quadrupled since 2000, and Canada is now the source of 20% of U.S. agriculture and agri-food imports.2
This quiet transformation has helped the Canadian agri-food sector become the country’s largest source of manufacturing revenue. No longer just a bulk commodity producer, we are now a dominant foreign supplier to America’s grocery aisles and dining tables, as Canadian farmers and processors have become more advanced in developing new products and marketing them to Americans.
Take canola, for instance, used for cooking and biofuels and meal for animal feed. Thanks to large crushing facilities, roughly 96% of Canada’s canola oil and 65% of canola meal export volumes went to the U.S. in 2024.4 And then there’s potash, which is key to American fertilizers. Canada supplies 85% of U.S. needs, which could go higher if it pulls back from Russia and Belarus, its only other major suppliers.5
Both countries have benefitted. The U.S. has had priority access to Canada’s production and processing that has a comparative advantage for products including prepared cereals and vegetable oils. Canada’s large production base in the Prairies, as well as the scale and proximity of manufacturing and processing hubs in Ontario and Quebec, have been key to the large inflows of investment capital in recent years. In addition, consistent, high volumes and a lower dollar have propped up Canada’s ability to be a preferred importer. Historical growth in the efficiency of Canadian farms and food processors has further strengthened Canada’s position as a reliable and efficient place to source agriculture and agri-food products from. The result: Canadian food manufacturing has increased its value-add ratio—its production minus its consumption—by 71% between 2014 and 2023.7
These advantages are now in question with the threat of large-scale tariffs. If they’re applied to agriculture and agri-food products, they will make Canada a less desirable trade partner to the U.S., as our position as a low-cost exporter of agriculture and agri-food products relative to others, including China and the Netherlands, will suffer. Agri-food manufacturing may also struggle to maintain investment levels, as one of its biggest selling features has been its preferential access to the world’s largest market.
Such challenges will force Canadian producers to make a choice: accept the cost of tariffs to access the U.S. market, or search for more demand abroad.
Meanwhile, our global competitiveness has slipped
For generations, Canada has been a global leader in agriculture—wheat shipments to China during that country’s post-revolutionary struggles, pork to Japan as its economy took off, lentils to India as it looked to feed its rapidly growing cities, and maple syrup to Europe as it opened its markets. Canadian potash, fertilizer and seeds have also been critical to the ability of the world’s farmers to grow more for their own markets. Thanks to decades of export growth—ahead of most of Canada’s economic sectors—our agriculture and agri-food sector entered the 21st century as a productivity leader. But with so much focus on the U.S. market, many Canadians didn’t realize that the rest of the world was catching up, and in some categories, overtaking us.
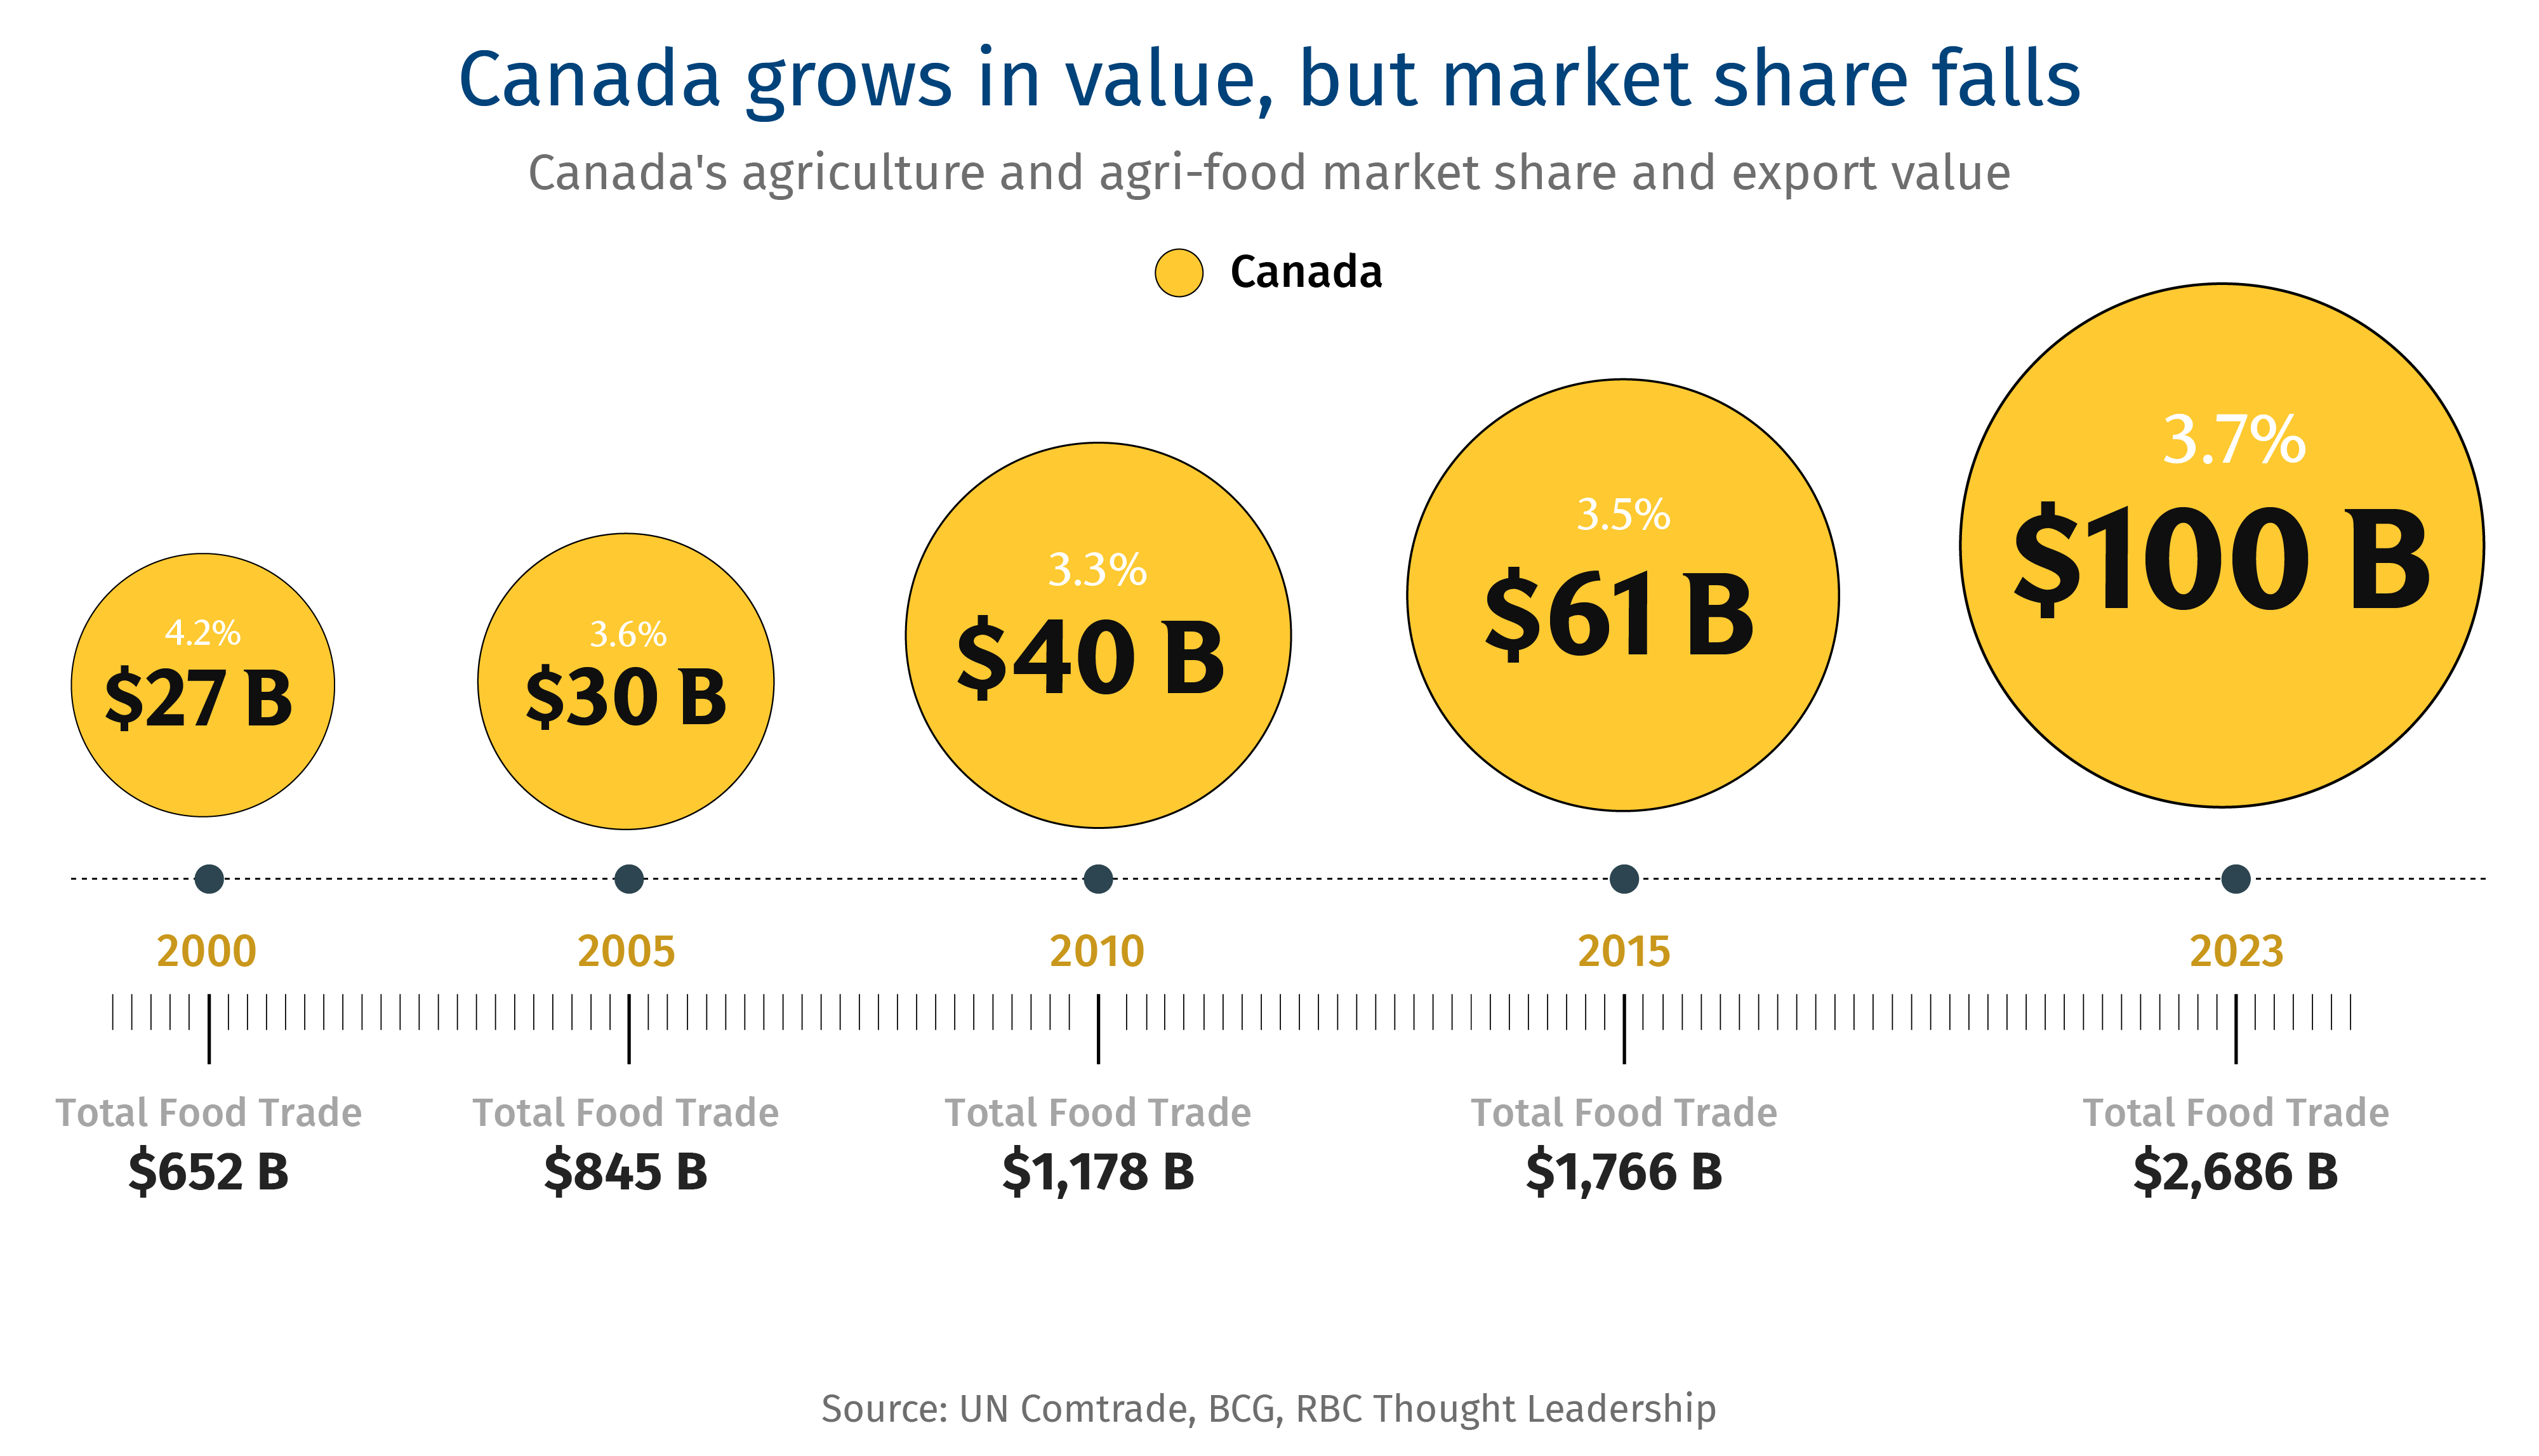
Here’s where we stand today on the global leaderboard: over the first quarter of this century, we’ve slipped from 5th to 7th place, bumped by China and Brazil.8 And under a business-as-usual scenario, we could drop to 9th place over the next decade. A global model developed by the Boston Consulting Group’s Centre for Canada’s Future and RBC shows Canada’s market share since 2000 has declined, relatively, by 12%. Our exports are still growing—they’ve quadrupled during that time. It’s just that we’re not keeping pace with the rest of the world, which saw agriculture and agri-food exports grow five-fold over the same period.c d
This relative decline could be an early-warning signal that our agriculture and agri-food exports are not only overly dependent on the U.S., they’re likely to face even greater competition abroad in the decades ahead. Other countries such as Brazil and Chile have taken big bites of markets including meat and fish, where Canada has been competitive in the past.
Ecuador is another case worth studying. It has a highly concentrated inland aquaculture industry, outside the city of Guayaquil, where advancements in shrimp genetics have led to production volume increases of 18-fold since 2000.9 Today, shrimp accounts for roughly 24% of Ecuador’s total exports and 25% of the global crustacean export market, including shrimp and lobster.10 Similar trends can be seen in blueberries from Peru, pasta from Türkiye and soybeans from Paraguay. Such focused, aggressive growth from our competitors has contributed to Canada losing market share in two-thirds of the sectors that make up agriculture and agri-food trade—including meat (-2%), live animals (-5%) and beverages and spirits (-2%). The result for Canada, according to our model: $23 billion in forgone export value in 2023 as a result of market share loss from 2000, which is worth more than the steel and iron Canada exported to the U.S. in 2024.
An important battleground to watch is Southeast and South Asia. India and Southeast Asia‘s global agriculture and food consumption is expected to grow to over 31% of global consumption within the next decade.11 Much of the region has also been a long-time reliable market for Canadian producers, be it soybeans to Vietnam or wheat to Indonesia or peas to India. But the region is increasingly turning to other suppliers. A free trade agreement between Australia, New Zealand and the Association of Southeast Asian Nations (ASEAN) eliminated tariffs on 99% of New Zealand exports to Indonesia, Malaysia, the Philippines, and Vietnam. Through this agreement, Australia has steadily built up its exports to ASEAN, now accounting for 23% of its agriculture and agri-food export value.12 13 Brazil is another competitor to watch. Its enhanced trade promotion has not only made it a bigger supplier to ASEAN; it’s accelerating its presence in Africa and the Middle East—the world’s fastest growing regions—where its export values jumped by 24.4% and 20.4%, respectively, from 2023 to 2024.14
That re-ordering of global food trade occurred largely during a period of liberalized global trade—but that era may now be fading. If tariff and non-tariff barriers become normalized, and trade becomes more politicized, Canada’s ability to compete internationally may be challenged anew, including by growing exporters like Kazakhstan that are seeking to gain market share, especially in Asia and the Middle East.
Last year set a record US$45 trillion in global merchandise trade value, yet year-over-year growth in volumese have been on a downward trend since 2000.15 Average annual growth in trade volume was 2% between 2016 and 2025, slower than 3.45% in the previous decade.16 A key factor driving the slowdown is a deviation from a rules-based system, making way for protectionist-like policies.
For example, harmful trade interventions for cereals have increased by 2.5 times relative to liberalizing interventions since 2009, driven by financial grants, state loans, and import tariffs.17 Agriculture and agri-food often bear the brunt of such policies, given the political importance of food prices and also the political power in many countries of food producers. Average tariffs by a World Trade Organization member charged on an agriculture product is 14.8%, compared to 8% for non-agriculture products.18 A slowing appetite for trade, fewer new trade agreement opportunities, and disruptions to Canada’s North America-first export strategy are among the biggest challenges we may need to consider in the years ahead.
How to diversify: Play to our strengths, grow with new allies, invest in old markets
The opportunity is clear. Our model estimates that Canada’s share of the global export pie could grow by 30% by 2035f, adding $44 billion to total exports, if we pursue three main trade objectives: grow where Canada has market access, expand in the world’s best growth markets, and maintain existing relationships through strengthened “food diplomacy.“
The first challenge is straightforward, which is taking advantage of what we have. Canada has 15 free trade agreements providing access to over two-thirds of the global economy. Through these agreements, there is room to make better use of Canada’s market access in Europe, Asia, and Latin America. For example, the Canada-European Union Comprehensive Economic and Trade Agreement (CETA) is gradually phasing out most tariffs on seafood. Before CETA, EU tariffs for fish and seafood averaged 11%, with highs of 25%. These will be fully phased out within the next five years.19
Taking on new growth markets, with more ambition, is our next challenge. That can start in the Asian markets mentioned in the previous section. Consumers in Southeast and South Asia are expected to have more to spend on higher value products over the next decade, thanks in part to expectations for economic growth that will be among the best in the world, with GDP per capita forecast to rise 3.9%, annually, between 2024 and 2033, up from 2.6% in the previous decade.20 India is one of the clearest opportunities — a market of 1.5 billion people whose economy and standard of living are growing rapidly. This market will increasingly be an opportunity for Canada’s agri-food processing industries, especially plant-based proteins driven by Canada’s production of legumes – peas, lentils, and soybeans.
Canada’s oilseed and agriculture waste processing can also help meet expected growth in biofuel demand in Southeast Asia, where blending rates of biofuels with fossil fuels in markets such as Indonesia are expected to stay above 30%. That would raise biodiesel demand by 56% over the next decade in that country.21 Sub-Saharan Africa, the Middle East, North Africa, and Latin America are also expected to see large GDP expansions. For these regions, we can expect to see total and per capita consumption not only rise, but shift towards more nutrient-dense foods, including animal protein, vegetables, and legumes. One way to help: Canada can contribute to linking global marine transportation to local supply chains by helping to build up food corridors and port infrastructure in Türkiye, United Arab Emirates, and Saudia Arabia as key points of entry to growth markets.
Thirdly, Canada can strengthen and grow current partnerships. These markets include the U.S., Japan, China, and Mexico—the first three of which are projected to have food trade deficits over the next decade that surplus producers like Canada will compete for. Our advantage is established business networks and consumer confidence in our products. In particular, the U.S. is expected to expand its imports of fresh produce, fish, and vegetable oil over the next decade.22 Driving production and processing in these domains will help position Canada as a strategic as well as a reliable partner, if we can make some of the investments we’ll outline in the following sections.
Countries to watch
Brazil – The Investor
Now the second largest exporter of agriculture and agri-food products, Brazil is taking exceptionally large bites out of global oilseed and meat exports, with an approximate 20% and 11% rise in value shares, respectively.23
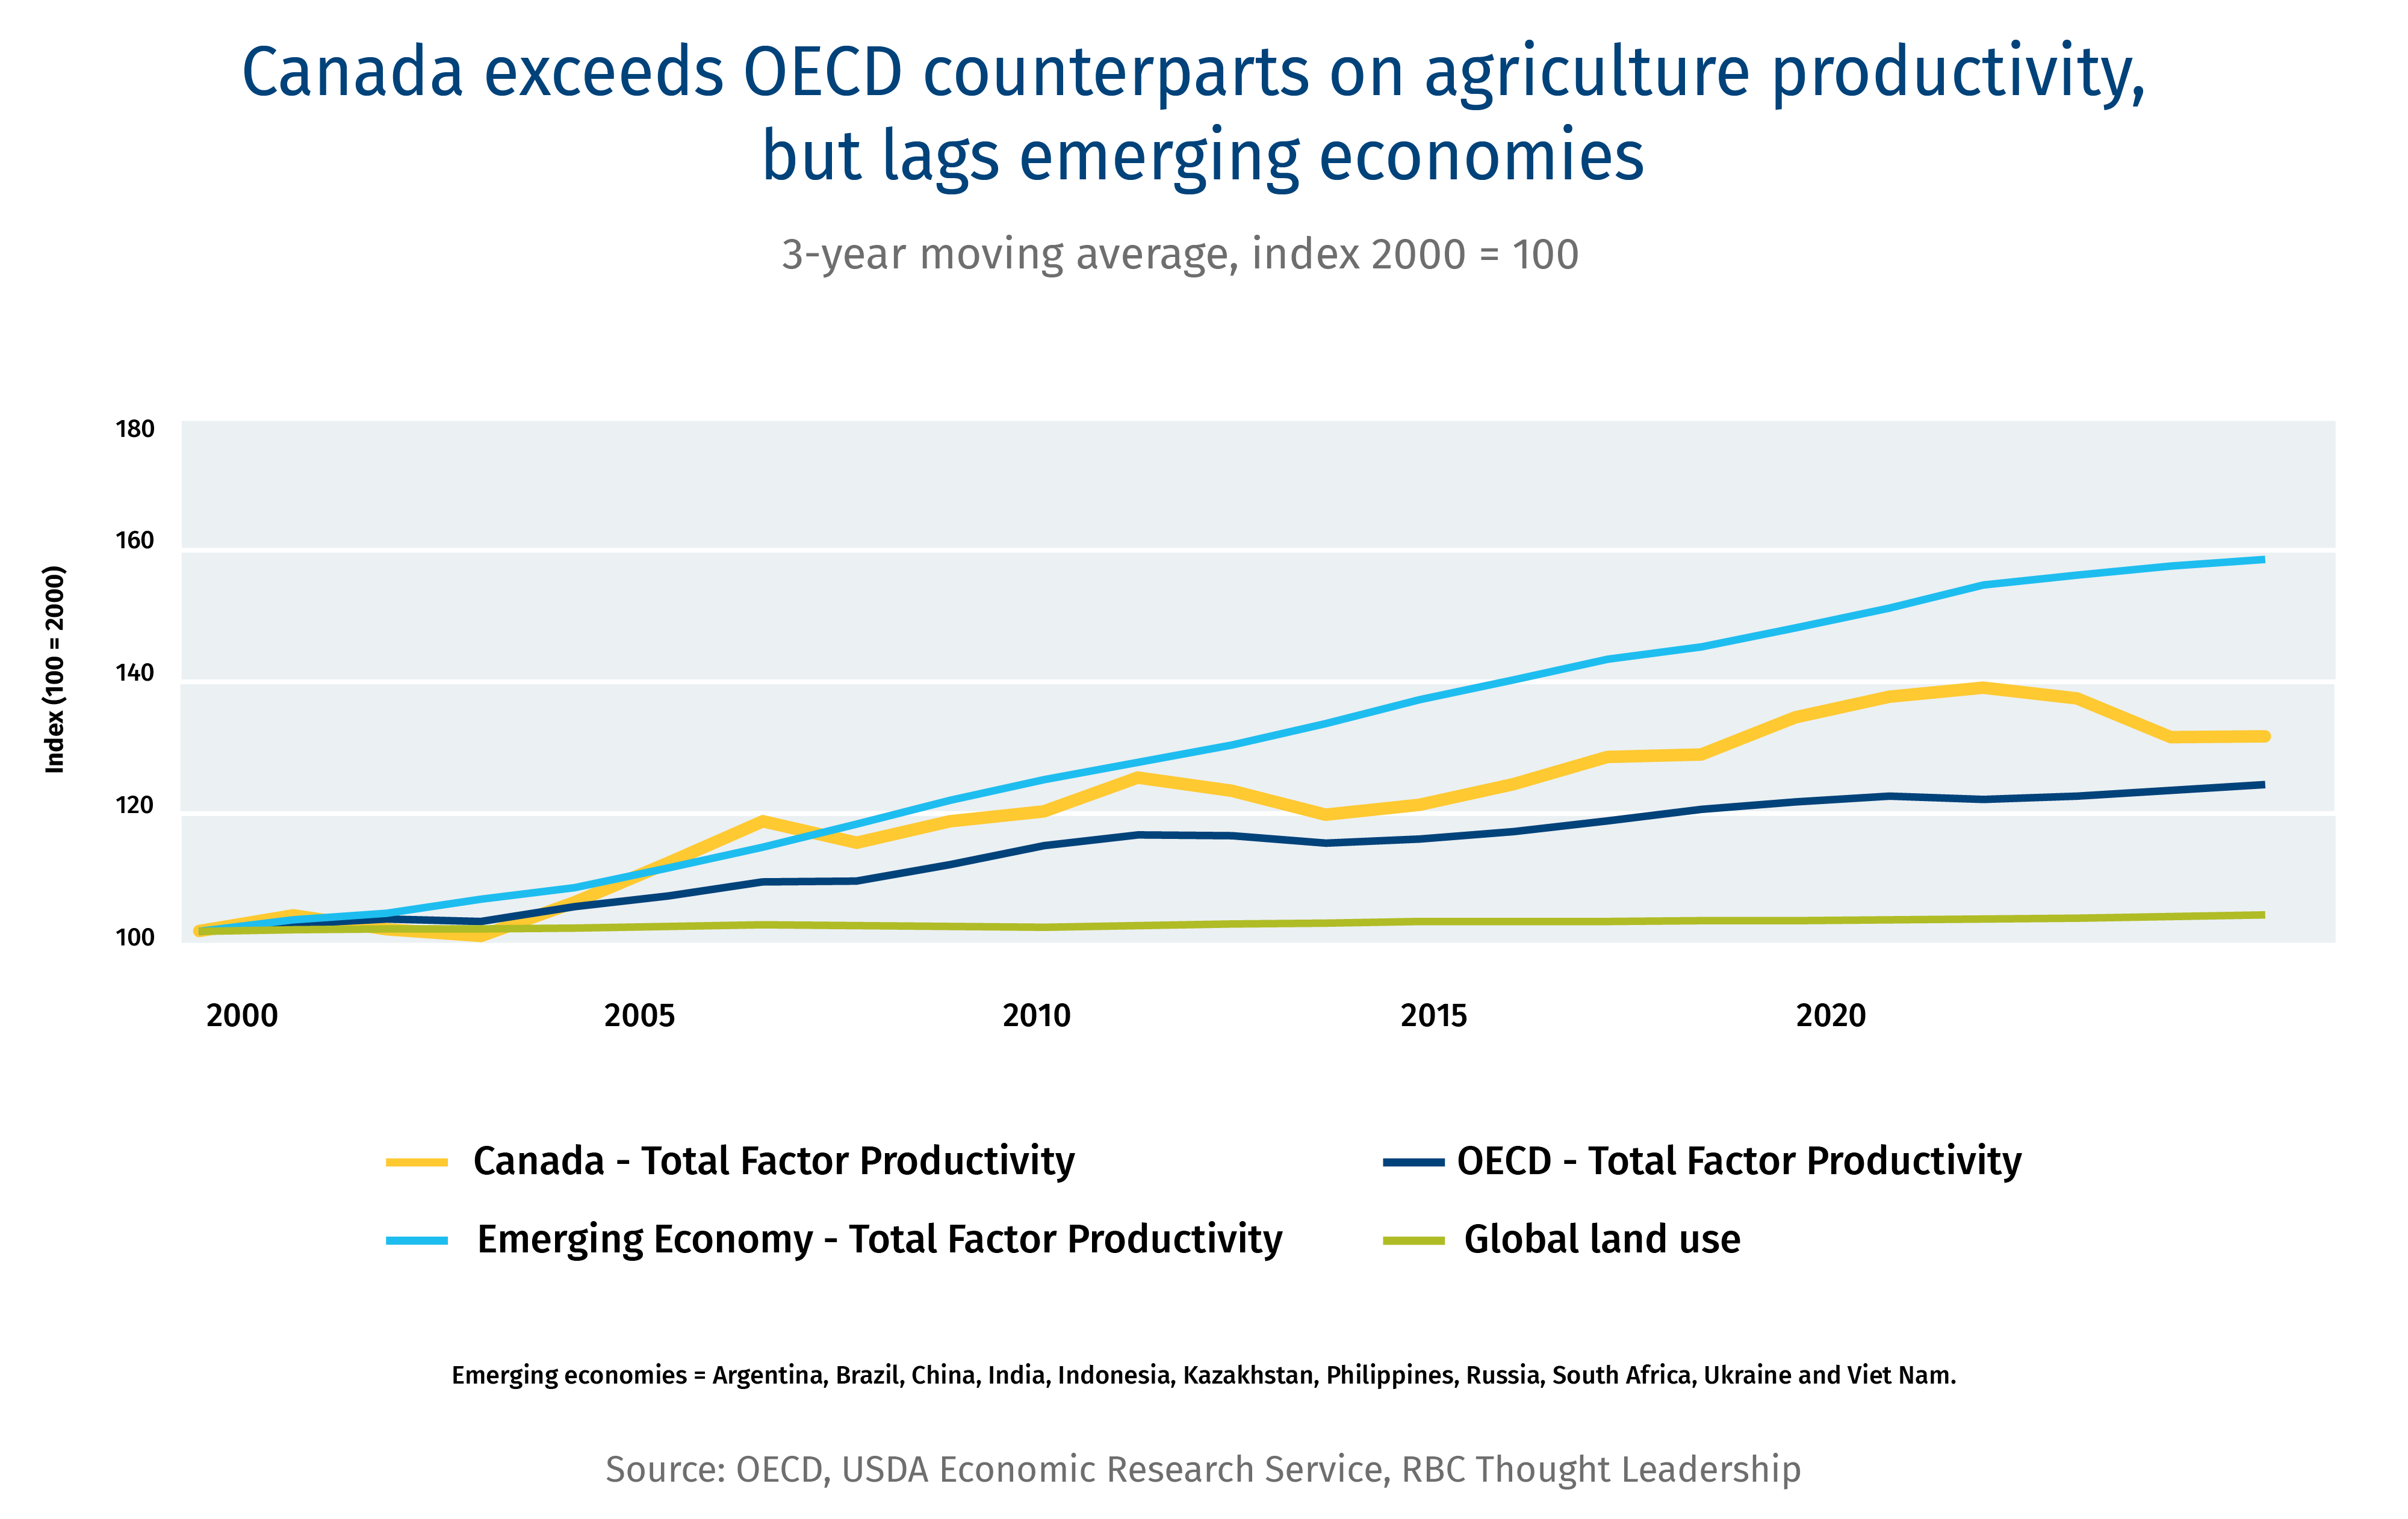
Row cropping in Brazil nearly doubled between 2000 and 2014, primarily from pasture conversion (80%), but forested land as well (20%).24 Brazil is also improving yields per inputs such as land, fertilizer use, and labour, with agriculture total factor productivity growing by 53% between 2000 and 2022. For comparison, Canada’s productivity grew by 27%. An industrial policy regime took a pro-business support model during the early and mid-2000s that attracted investment from multinational agri-businesses and life science companies, and helped finance growth in domestic storage, transportation infrastructure, and processing capacity.26
Brazil has taken an aggressive approach to marketing and promotion in growth markets and in expanding its market share in China. On the other hand, the European Union, Brazil’s second largest market, is set to enforce a zero-deforestation regulation by the end of 2025, prohibiting select imports, including soy, beef, and coffee products associated with deforestation post-2020.27 The regulation and other similar environmental policies tied to trade could present compliance challenges for Brazil even as domestic deforestation rates fall.
For the next decade, Brazil’s industrial policy playbook, Nova Industry Brazil, will drive innovation and sustainability with agri-food supply chains as a top priority for growth.
Australia – The Trader
Australia has used its 18 free-trade agreements with 30 countries to diversify, expand and adapt its agri-food export flows. The value of Australia’s agri-food exports to India increased +106% between 2022 and 2023 after the Australia-India Economic Cooperation and Trade Agreement (ECTA) entered into force in December 2022. In 2023, Australia took advantage of lower tariffs for meat in the Korea-Australia Free Trade Agreement, raising sheep and goat sales by ~50% in value relative to 2022.28
It’s diversifying its production to align with growth in export markets such as canola, and support that with trade promotion. Its new cross-sector agribusiness expansion initiative is a $85-million-dollar fund aimed at expanding and diversifying agri-food exports.29
An active participant in the Codex Alimentarius Commission, which is a collection of internationally adopted food standards. Alignment on food standards between trading partners is essential to avoid non-tariff barriers.
Spain – The Scaler
The country positioned itself as the go-to market for fruit, vegetables, and pork in the European Union, by focusing on production scale, quality, and regionalized production.
Propelled itself as a leader in agri-food reaching its EU and international customers via its 46 ports.30
Spain scaled production to meet export volume demands through growing productivity and a shift towards farm commercialization. This is evident through its centralized greenhouse production, optimized for regional market access and trade. However, this production cluster is primarily reliant on road transportation, creating vulnerabilities in logistics.
Spain will remain one of Canada’s top competitors in expanding in the European market, if it were to optimize its use of CETA.
Kazakhstan – The Grower
While not yet cracking the top 50 list of exporters, Kazakhstan’s agriculture and agri-food export value has grown by nine-fold since 2000.31
Over the next decade, if Kazakhstan’s agriculture land use trends mirror other agriculture powerhouses such as Brazil, Canada, and the U.S., we can expect to see its pastureland, which accounts for roughly three-quarters of all agricultural land to, in part, be transformed into cropland, strengthening their place in global cereal and oilseed markets.32
Under the Ministry of Agriculture 2021-2030 agricultural development plans, Kazakhstan plans to boost productivity in meat and dairy production, increasing carcass weights and milk outputs per animal, with sights on increasing their exports.33
Its agriculture sector has significant potential for growth, but is underdeveloped and underfinanced. With meaningful investments scaled through state-owned financial institutions such as KazAgroFinance, Kazakhstan will be one to watch for cereals, oilseeds, beef and sheep.34
Brésil
Brésil : l’investisseur
Devenu le deuxième plus grand exportateur de produits agricoles et agroalimentaires, le Brésil prend une part exceptionnellement importante dans les exportations mondiales d’oléagineux et de viande, avec des augmentations respectives d’environ 20 % et 11 % en valeur.
Les cultures en rangs ont presque doublé entre 2000 et 2014 au Brésil, principalement en raison de la conversion des pâturages (80 %), mais aussi des terres forestières (20 %). Le Brésil améliore également les rendements par rapport aux intrants tels que la terre, les engrais et la main-d’œuvre, et la productivité des facteurs agricoles globaux a augmenté de 53 % entre 2000 et 2022. À titre de comparaison, la productivité du Canada a augmenté de 27 %. Le régime de politique industrielle a adopté un modèle de soutien aux entreprises au début et au milieu des années 2000, ce qui a attiré les investissements des multinationales de l’agroalimentaire et des sciences de la vie et contribué à financer la croissance du stockage national, des infrastructures de transport et de la capacité de transformation.
Le Brésil a adopté une approche agressive en matière de marketing et de promotion sur les marchés en croissance, et il augmente progressivement sa part de marché en Chine. D’un autre côté, l’Union européenne, deuxième marché du Brésil, compte appliquer fin 2025 un règlement contre la déforestation interdisant des importations spécifiques, notamment de soja, de bœuf et de produits à base de café associés à la déforestation après 2020. Cette réglementation, conjuguée à d’autres politiques environnementales régissant le commerce international, pourrait poser des problèmes de conformité au Brésil malgré le repli des taux de déforestation dans le pays.
Au cours de la prochaine décennie, la politique industrielle brésilienne « Nova Industry Brazil » encouragera à l’innovation et à la durabilité, les chaînes logistiques agroalimentaires étant définies comme une priorité absolue pour la croissance.
Australie
Australie : le négociateur
L’Australie a mis à profit ses 18 accords de libre-échange avec 30 pays pour diversifier, développer et adapter ses flux d’exportation agroalimentaires. La valeur des exportations agroalimentaires de l’Australie vers l’Inde s’est envolée de 106 % entre 2022 et 2023 après l’entrée en vigueur de l’Accord de coopération économique et commerciale Inde-Australie (ECTA) en décembre 2022. En 2023, l’Australie a tiré parti de la baisse des tarifs douaniers sur la viande dans le cadre de l’Accord de libre-échange entre la République de Corée et l’Australie, augmentant les ventes de moutons et de chèvres d’environ 50 % en valeur par rapport à 2022.
L’Australie diversifie sa production afin de s’adapter à la croissance de marchés d’exportation tels que le canola, et soutient cette politique à l’aide de promotion commerciale. Sa nouvelle initiative d’expansion agroalimentaire intersectorielle est la création d’un fonds de 85 millions de dollars destiné à accroître et diversifier les exportations agroalimentaires.
Participant actif à la commission du Codex Alimentarius, qui est un ensemble de normes alimentaires adoptées à l’échelle internationale. L’harmonisation des normes alimentaires entre les partenaires commerciaux est essentielle pour éviter les barrières non tarifaires.
Espagne
Espagne : l’expansion
Le pays s’est positionné comme le marché de référence pour les fruits, les légumes et le porc dans l’Union européenne, en se concentrant sur l’échelle de production, la qualité et la production régionalisée.
L’Espagne s’est hissée au rang de chef de file de l’agroalimentaire en se connectant à ses clients européens et internationaux depuis 46 ports.
L’Espagne a augmenté sa production afin de répondre à la demande de volumes d’exportation, grâce à une amélioration de la productivité et à une transition vers la commercialisation agricole. Cela se traduit par une production sous serre centralisée, optimisée aux fins d’accès au marché régional et de commerce international. Toutefois, ce centre de production dépend principalement du transport routier, ce qui crée des vulnérabilités logistiques.
L’Espagne restera l’un des principaux concurrents du Canada pour ce qui est de l’expansion sur le marché européen si le pays décide d’optimiser son utilisation de l’AECG.
Kazakhstan
Kazakhstan : la croissance
Bien qu’il ne figure pas encore parmi les 50 premiers exportateurs, le Kazakhstan a multiplié par neuf la valeur de ses exportations agricoles et agroalimentaires depuis 2000.
Au cours de la prochaine décennie, si les tendances d’utilisation des terres agricoles du Kazakhstan reflètent celles d’autres puissances agricoles telles que le Brésil, le Canada et les États-Unis, on peut s’attendre à ce que ses pâturages, qui représentent environ les trois quarts de toutes les terres agricoles, soient transformés en marchés de cultures.
Dans le cadre des plans de développement agricole 2021-2030 du ministère de l’Agriculture, le Kazakhstan prévoit stimuler la productivité de sa production de viande et de produits laitiers en augmentant le poids des carcasses et la production de lait par animal en vue d’accroître ses exportations.
Le secteur agricole du Kazakhstan présente un potentiel de croissance important, mais il est sous-développé et sous-financé. À la suite des investissements significatifs réalisés par les institutions financières d’État telles que KazAgroFinance, le Kazakhstan deviendra un pays à surveiller pour les céréales, les oléagineux, le bœuf et le mouton.
Leveraging global strengths to ensure food security at home
Canada’s agriculture and agri-food sector is not just an exporter; it’s a source of high quality, affordable, and nutritious food for a growing domestic population. We produce more than we need, positioning ourselves as a net exporter of agriculture and agri-food products by $32 billion in 2023.35 However, the production mix of an export-oriented sector may not round out a healthy diet for all Canadians.36 A balanced approach is needed.
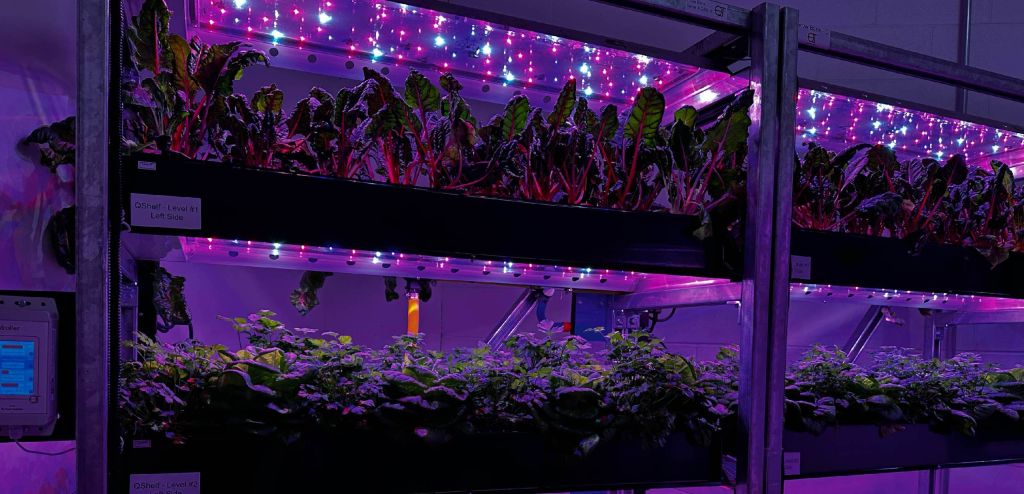
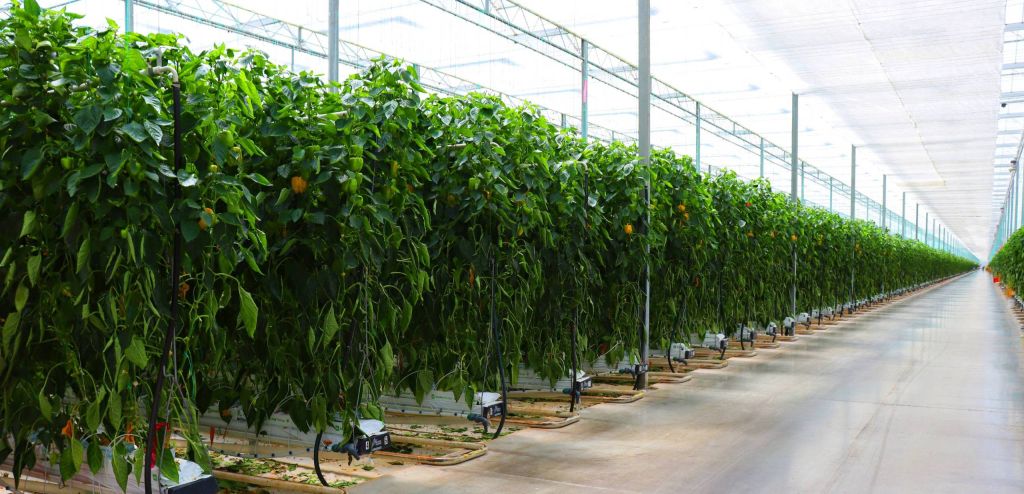
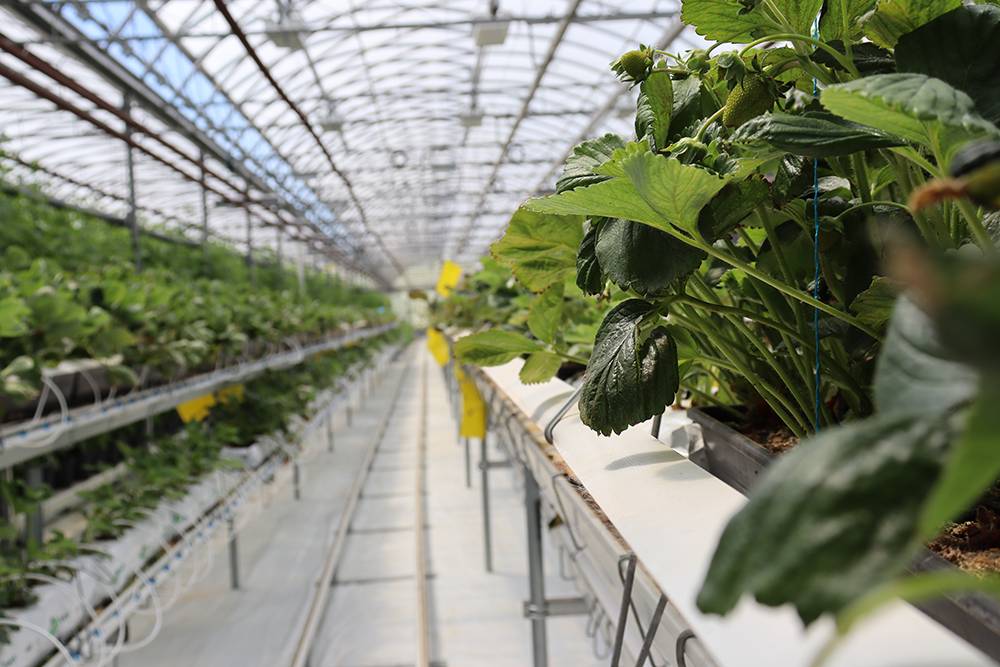
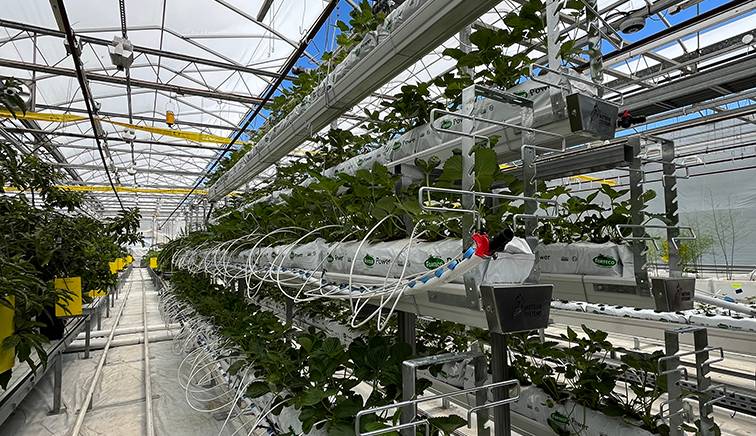
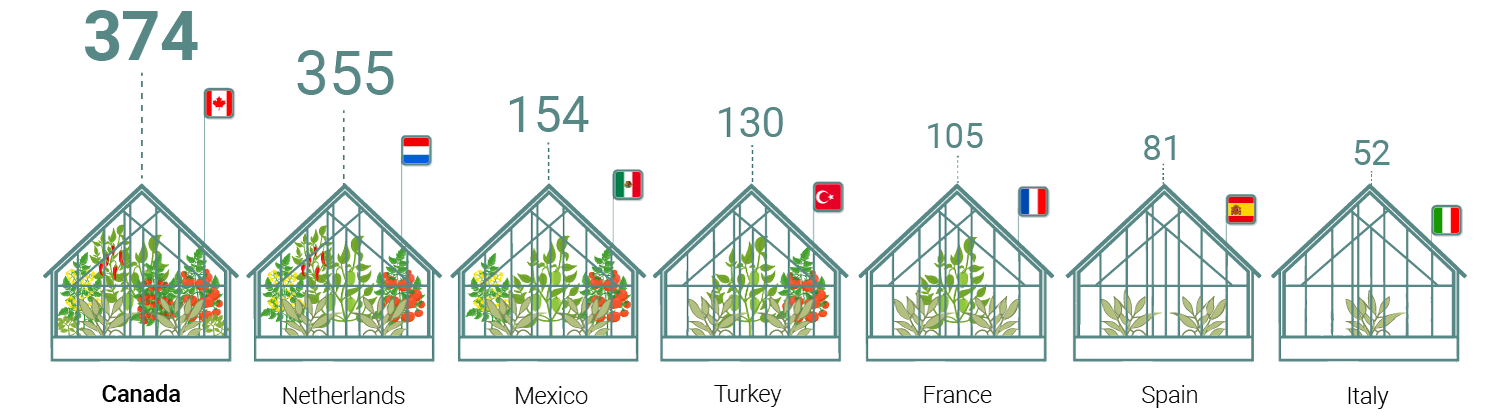
Canada has formed trade relationships with countries that specialize in producing foods such as fruit at a more competitive and productive rate. As a result, Canada runs a production deficit in fruits and vegetables, as well as sugar and confectionary products. Technology can help, in this case through the rise of modern, controlled environment agriculture. Pockets of production in Ontario, Quebec, Alberta and British Columbia have led to greenhouse fruit and vegetable production volumes increasing by roughly five times since 2000.37 This growing industry can play a critical role in closing the production gap, where vegetable production would need to double and fruit production would need to grow by five times to feed domestic demand.38
Canada will need to enable this growth through sufficient utilities, especially water, energy, and waste management. Expanding and decarbonizing Canada’s electricity grids will be essential, and could require provinces to invest nearly $160 billion to double their electricity supply with clean energy. Such investments create ripple effects in decarbonizing Canada’s food system by reducing the carbon intensity of energy used in storage, processing facilities and transportation.
Other areas for growth to meet domestic demand and regain global market share can be found in meat processing as well as fish and seafood production and processing. Meat production nearly doubles Canada’s average consumption rate, while fish and seafood production are just above consumption averages.40,41
These industries have been challenged by high operation costs, volatile commodity prices, labour shortages, and a challenging policy environment for aquaculture. Yet, there is a growing domestic and international demand for sustainable, Canadian-made proteins, which means the efficiencies created through global operations in Canada can help improve the cost and availability for domestic consumers.
Betting on Canada to feed the future may prove to be a safe environmental bet, too. While no country is immune from the negative impact of climate change on crops and animals, yield growth scenarios that account for increasing effects of climate change suggest Canada is projected to increase its role as a global breadbasket of staple crops such as wheat, soybeans, and corn.42 Canada is also well endowed with natural resources, and home to efficient production systems that responsibly use them. Canada’s agriculture water use for agriculture remains low at 11% of total freshwater withdrawal, compared to 67% in Australia and 40% in the United States. 43
Canada’s land use for agriculture also pales in comparison to the United States and Australia, which represents over half of their total land masses, while Canada’s agricultural land covers 6% of the country, underlying the limitations that other agriculture powerhouses face in meeting competing land demands for housing, energy, and food.44,45,46
Five keys to unlocking Canada’s export potential
1. Innovation
We’re a production leader and an innovation commercialization laggard. However, Canada is now also facing a productivity slowdown in agriculture production. Creating room for innovation in efficiency is the next reboot in productivity. Adoption is one area for improvement. Take automated steering for tractors and variable rate technology for fertilizers and seeds, as examples. Adoption rates for both remain low at 27% and 16%, respectively.46 We also need greater connectivity among researchers, start-ups, funders, and companies, preferably within agri-food innovation hubs like the ones grown in the U.S. Mid-West and Netherlands. That will require us to address the widening gap between private and public resourcing, which threatens Canada’s ability to develop partnerships in IP and commercialization. Government spending on agri-food research and development has declined by 9% on average, annually over the past decade. .47
2. Capital
Canada is in the top 10 countries for investments in agri-food technology and innovation.48 We could be in the top five, if annual investments in Canadian-based startups doubled. That could be tougher in a tariff world, which is inherently risky to foreign capital, but the returns on overseas exports could be enough to offset those North American challenges. Further expanding Canada’s agri-food processing sectors will also require upfront investments. Protein Industries Canada estimates we could own 10% of the global market share of plant-based foods by 2035, which would add $25 billion to annual sales. To achieve this ambition, Canada will need 10 to 15 new plant-based food processing facilities and $6 to $9 billion of capital investment for ingredient manufacturing alone.49 Scaling capital in Canada will also require us to beef up the business case, with more competitive approaches to tax and regulation. We can also do more to tell our story and reposition ourselves as a value-add producer, competing on price, quality, and volume. Developing company, region, and industry case studies (see box) that explicitly showcase what in Canada is ripe for growth, can contribute to attracting a new wave of investors.
3. Digital access
Canada needs to fix our 5G gaps. The use of precision agriculture tools highlights the importance of strong wireless connections in rural Canada. These tools rely on app or web-based platforms to improve use of feed, seed, fertilizer, and pesticide, so we can produce more with less. That requires high-speed internet and strong 5G cell reception, which rural Canada is lagging in. Deetken Insights estimates that if all Canadian farmers had access to 5G, it could add between $2.7 billion and $3.5 billion to Canada’s GDP by 2030, through input efficiencies and enhanced automation on farm.50 Canada’s Connectivity Strategy, a national vision for IT infrastructure, has propelled projects across Canada to expand access. Yet, two key agriculture producing provinces, Saskatchewan and Manitoba, have only 50% and 30% rural coverage, respectively, when it comes to 5G.51 Redeploying Canada’s rural connectivity funds to focus on rural and remote 5G access could be the initiative needed to unlock the digital economy for Canadian farmers.
4. Export infrastructure
Turnaround times at Canada’s ports are slower than many large competitors, averaging 2.7 days in 2022 while the United States, Brazil, and Australia, had average turnaround times of 2.1, 1 and 2 days, respectively.52 The Port of Vancouver, Canada’s largest port, has had longstanding infrastructure bottlenecks from the Second Narrows Bridge to the Thornton tunnel, which mechanisms such as the National Trade Corridors Fund or Canada Infrastructure Bank could help transform—if they have transformational funding. Currently, Canada’s roughly $20-billion a year investment on transportation infrastructure lags agriculture competitors such as Australia and the United Kingdom. Keeping up with these economies would require additional investments of between $13-20 billion.53 While ports are our main connection to global markets beyond the U.S., Canada’s rail system is a major domestic connector, and it is challenged with limited routes and rising labour disputes, that too require a rethink for growth. There are smaller opportunities, too, such as container logistics and inland terminals, as simple problems like container storage can clog our ports and rails.
5. Global marketing
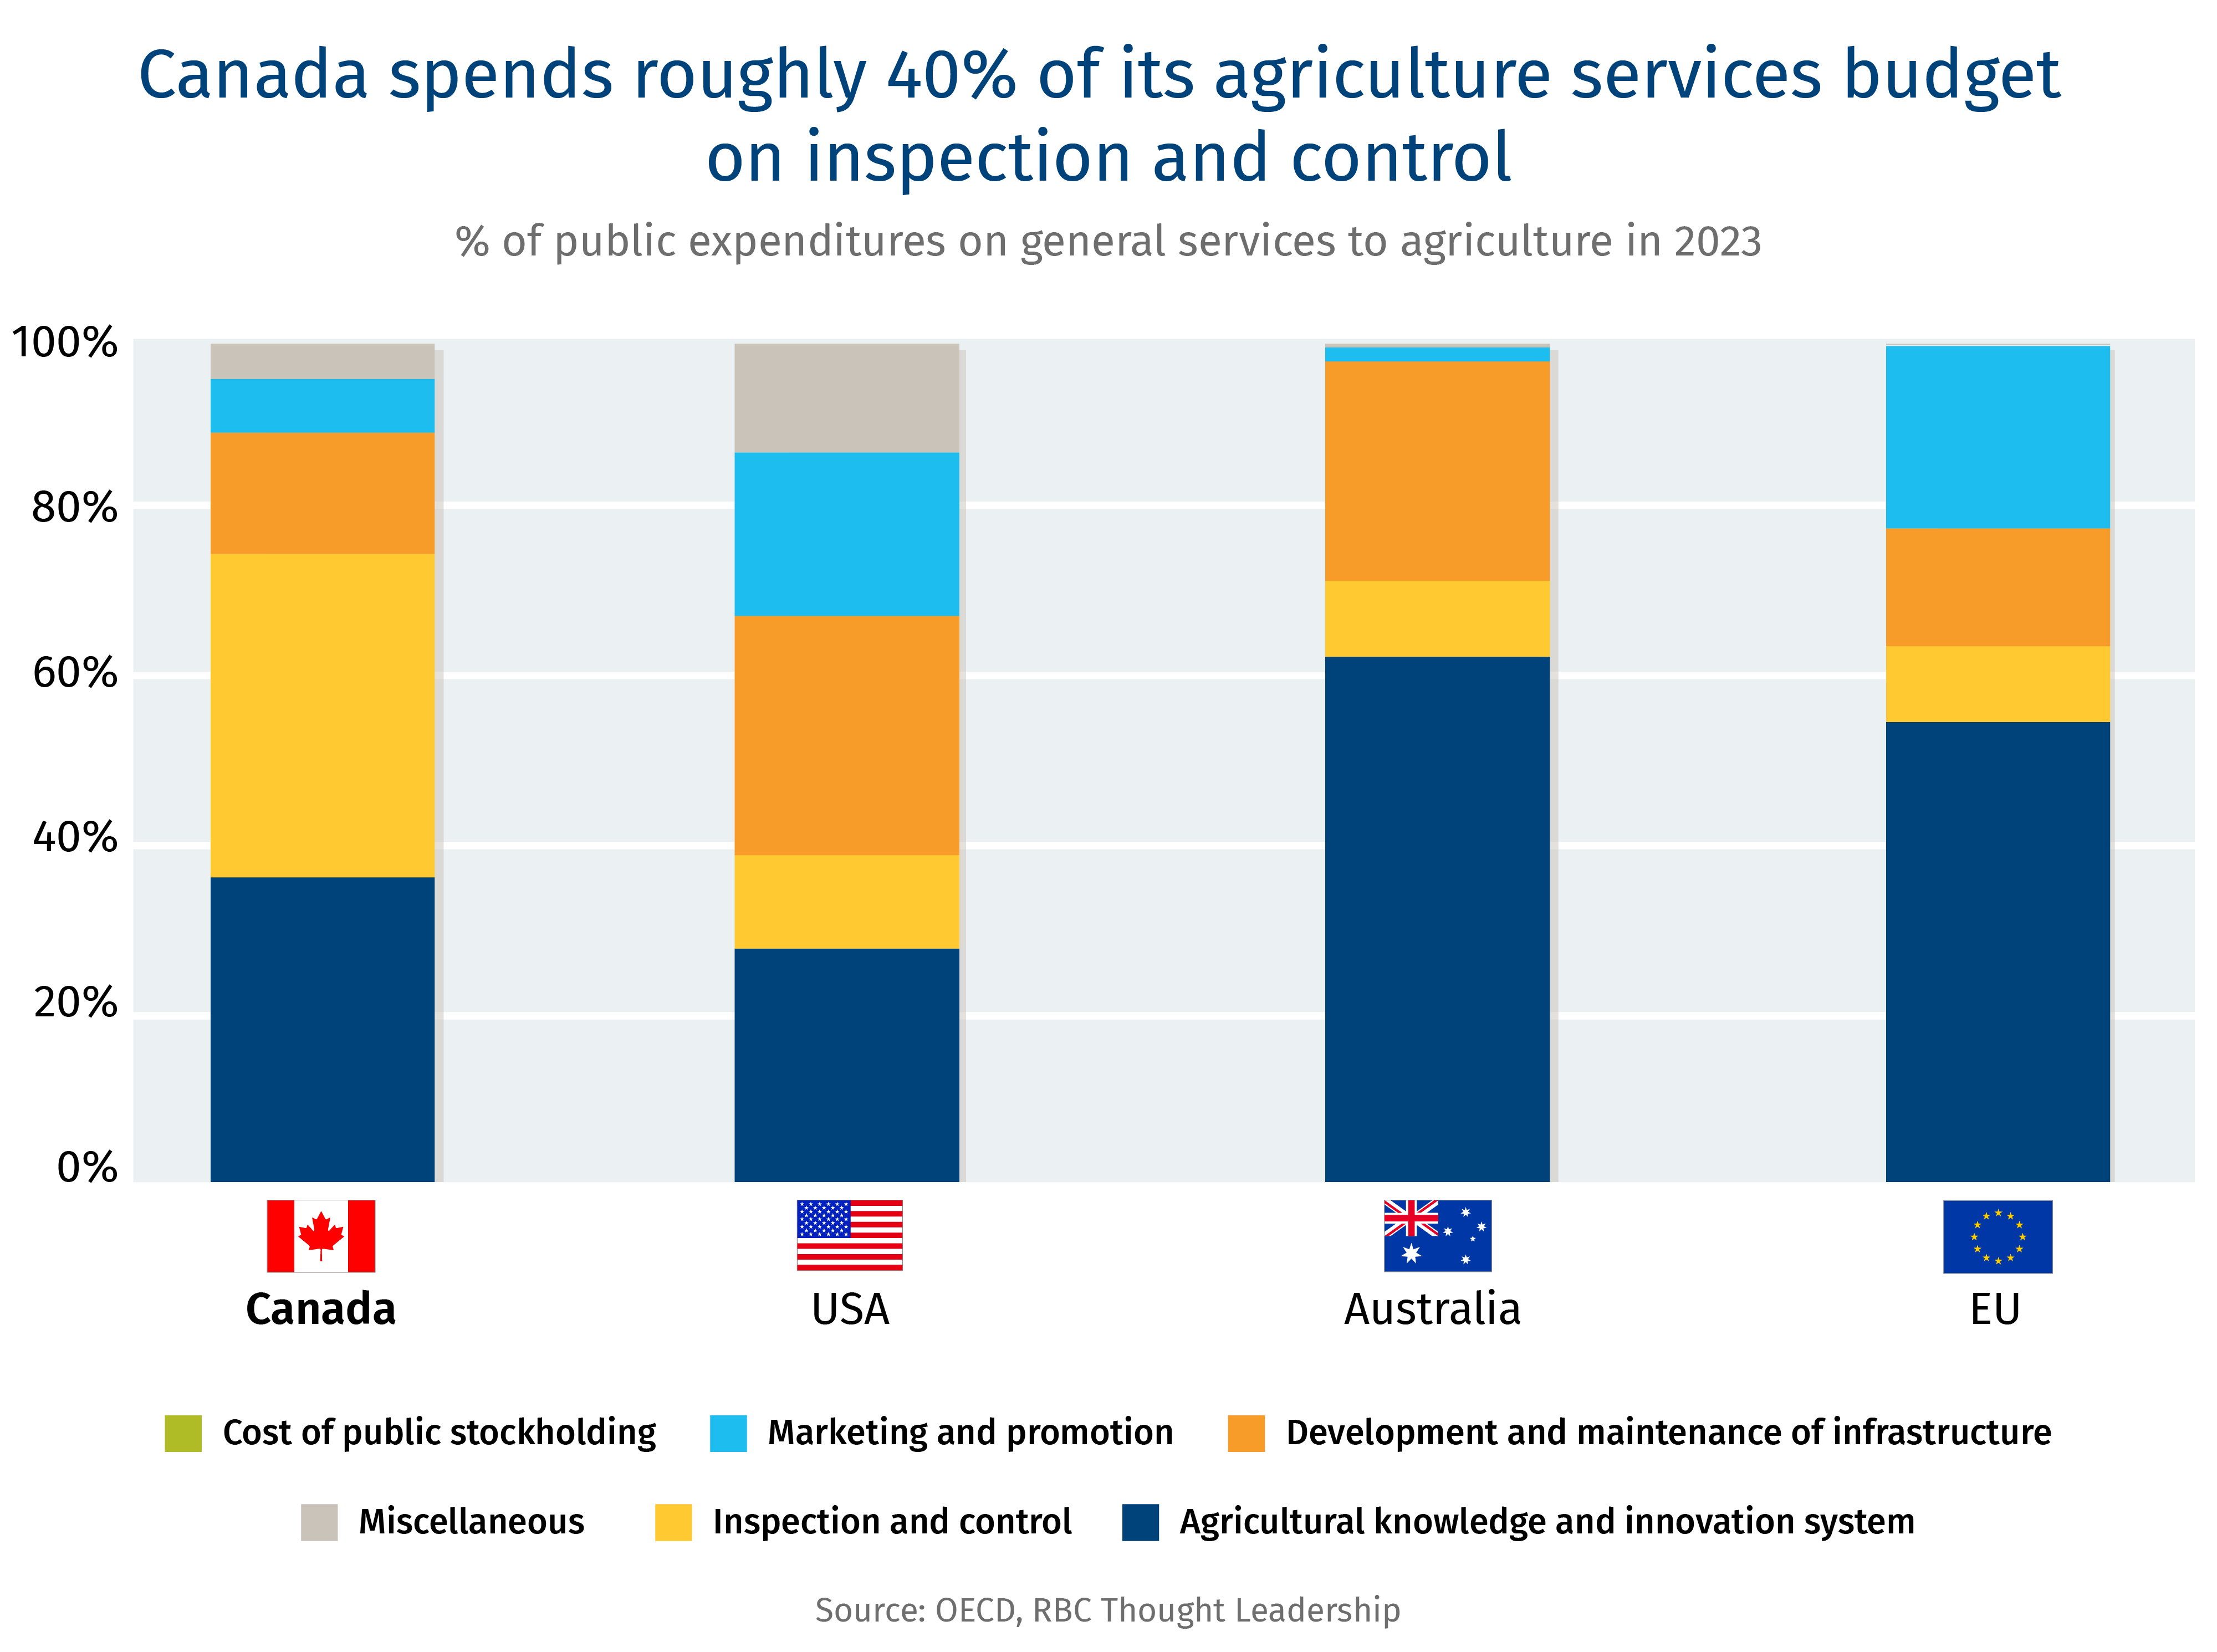
Canada is suffering from a dilution effect in its market development and access approach—with limited resources to boot. The U.S. spends close to 20% of its agriculture support services budget on marketing and promotion, or triple Canada’s share of 6%.54 In a similar vein, gaining market share requires robust inspection and control services that ensure food safety and agriculture production’s protection against new diseases and pests. Canada has a strong reputation, but also must come to grips with a dilemma: even though we allocate 40% of that agriculture support services budget to inspection and control, we still face market access issues and duplicative inspections.55 One approach would be to pick the top five products for export potential and develop priority market assessments, such as Europe for seafood. Pooling public-private resources, the federal government could work with industry associations, companies, and provinces in region-specific, agile taskforces to promote exports and inform regulatory bodies on what’s needed to support growth. A complementary option: position regulatory bodies such as the Canadian Food Inspection Agency to proactively develop standards recognition and harmonization in the identified growth markets.
Canada in 2035
In just 10 years, the world will need to feed close to nine billion people, and many of them will have more income, and appetite, for higher quality foods like the kind Canada is known for. To meet this demand, the world will need to produce 14% more food, feed, and biofuels than we’re delivering today, and do it in a more disruptive trade environment.56
To feed this future, agriculture must also compete with climate change, urban sprawl and rising land use needs from energy production. Moving from short-term reactionary tactics to strategic growth, Canada can use the U.S. tariff threats as a wake-up call to leverage agriculture and agri-food as a driving force for trade diversification while building Canadian self-sufficiency.
Under a high growth scenario, we estimate Canada could return to our position as the world’s 5th largest exporter, regaining our international clout from the early 2000s. In such a scenario, Canada in 2035 would need to expand value added agri-food exports by 50% and grow agriculture commodity exports by 10%.h
If we achieve this growth, we can imagine a Canada in which:
The Atlantic aquaculture industry doubles in production and processing, feeding our European neighbours and the ones just next door;
Alberta, home to 80% of the country’s beef output, advances the resilience of its feedlots and supply chains, contributing to Canada becoming the second largest source of meat in Japan, just behind the U.S., from fourth place today.57,58
Our greenhouse sector, with aspirations of doubling its acres over the next decade, moves Canadians closer to their fresh produce at an affordable price.
Finally, all these products are delivered to consumers via transportation systems with fewer bottlenecks from rail to port and fewer constraints, from on-farm internet to non-tariff trade barriers.
Agriculture is often left off the plate in Canada’s economic strategy discussions. This needs to change if we are to build resilience at home and regain our presence abroad. By acting on these ideas, and others, with precision and speed, the next decade can see a boom in productivity, an unprecedented scale of manufacturing, and a new path for growth through diversified markets. For every part of the country, the opportunity is ripe for growth.
How to be a global champion
AGT Food and Ingredients—The value of processing clusters
Pulses and plant-based product supplier exports to more than 100 countries.
Primary markets: Türkiye, Algeria, Iraq and the U.S.
Growth markets: India, South Africa, Saudi Arabia, and United Arab Emirates.
Export strategy:
Its ability to handle and process high volumes of pulses grown in close proximity to processing facilities in western Canada has boosted its export ambitions.
AGT has an integrated supply chain from farm gate to global distribution, and has expanded its ownership into export-oriented packaged foods and value-added processing infrastructure and bulk and containerized freight handling and transportation.
International business has also been driven by expanding offices and processing capacity in Türkiye, Kazakhstan, United Kingdom, Australia, Europe, U.S., South Africa, and India.
Growth strategy:
Acquisitions and new capacity to expand processing within production clusters have enabled AGT to become a global exporter of value-added pulse and durum wheat food products. It has also positioned AGT to go from a buyer and exporter of commodities to retail products with over 21 facilities across Western Canada.
AGT is investing and engaged in research and development to create novel products and processing systems.
Maple Leaf Food—The value of efficiency
Protein company with products sold in roughly 20 countries.
Primary markets: U.S., China, and Japan.
Growth markets: Philippines, Singapore, and Vietnam.
Export strategy:
Advanced market and supply chain integration with the U.S extends its geographical reach.
Market access and development between Canada and U.S. has also been strengthened through mutual standard recognition on animal welfare, biosecurity, and quality.
The quality of Canadian pork has been well established and enjoys a strong reputation in existing Asian markets.
Setting up offices have helped support market development in Asia. It has enabled MLF to work closely with trade commissioners in Asia for market access and development, and resolving local market issues.
Growth approach:
Recognized portfolio of brands and strong leadership, especially within North American and Asian markets.
Vertically integrated supply chains with a prioritization of reinvesting in the business to expand capacity and improve operational and supply chain efficiencies.
Over the years, MLF has used acquisitions to achieve greater scale but also to acquire major competing or complementary brands.
Highly focused on production efficiencies through automation and developing centres of excellence where processing plants specialize on particular product lines, taking advantage of scale.
McCain—The value of networks
Products are sold in over 160 countries.
Export strengths and approach:
Developed local sales offices in Tokyo and Osaka, and distribution centers throughout Japan to ensure on-time delivery
Close relations between international office and processing facilities to ensure reliable and consistent supply that responds to international customer needs.
In the event of a product shortage due to a force majeure event, such as transportation delays or crop-related issues, they are able to propose an alternative product in a timely manner, since they have production bases in various countries.
Growth approach:
Developed strong, long term relationships with farmers through direct contracts, allowing McCain to be nimble in responding to production and supply chain disruptions and build business resilience.
Invested in regional-specific agriculture resilience to help key supply sheds mitigate and adapt to climate change and other disruptions.
Expanded processing facilities and logistics to existing and emerging agriculture production hotspots. This approach is demonstrated through their recent investment in processing facilities in southern Alberta.
John Stackhouse, Senior Vice-President, Office of the CEO, RBC
Myha Truong-Regan, Head of Research, RBC Climate Action Institute
Yadullah Hussain, Managing Editor, RBC Climate Action Institute
Farhad Panahov, Economist, RBC Climate Action Institute
Caprice Biasoni, Graphic Design Specialist
Shiplu Talukder, Digital Publishing Specialist
Boston Consulting Group
Terence Smith, BCG Centre for Canada’s Future
Keith Halliday, Partner and Associate Director, BCG Global Advantage Practice Area
Arrell Food Institute at the University of Guelph
Evan Fraser, Professor and Director
Amy Standish Assistant Deputy Minister, Policy and Programs, Government of Saskatchewan Brian Innes, Executive Director, Soy Canada Brodie Berrigan, Senior Director of Government Relations and Farm Policy, Canadian Federation of Agriculture Charlie Angelakos, Vice President, Global External Affairs and Sustainability, McCain Foods Limited Craig Klemmer, Manager of Thought Leadership, Farm Credit Canada Cyr Couturier, Marine Biologist & Aquaculture Scientist, Marine Institute of Memorial University Dana Dickerson, Director of Market Development and Sustainability, Grain Farmers of Ontario Darlene McBain, Director of Industry Relations, Farm Credit Canada Dave Carey, Vice-President, Government & Industry Relations, Canadian Canola Growers Association David McInnes Principal, DMci Strategies Deb Stark, Former Deputy Minister, Ontario Ministry of Agriculture, Food and Rural Affairs Erin Gowriluk, President, Canadian Grains Council Greg Northey, Vice President, Corporate Affairs, Pulse Canada Guillaume Lhermie, Professor and Director, The Simpson Centre for Food and Agricultural Policy Ian Ross, President and CEO, Grand Valley Fortifiers Janelle Whitley, Senior Director, Market Access & Trade Policy, Pulse Canada Janice Tranberg, President and CEO, Alberta Cattle Feeders Association Jean-Marc Ruest, Senior Vice-President, Corporate Affairs and General Counsel, Richardson International Limited Jeff Vassart, President, Cargill Limited Canada John Cranfield, Dean and Professor, Ontario Agricultural College at the University of Guelph Kendra Donnelly, Chief Financial Officer, Korova Feeders Kim McConnell, Industry Advocate Kristjan Hebert, President, Hebert Group Kinga Nolan, Policy and Regulatory Affairs, Grain Growers of Canada Kyle Jeworski, President and CEO, Viterra Kyle Scott, Managing Partner, Emmertech Leif Carlson, Director of Market Intelligence and Trade Policy, Cereals Canada Lenore Newman, Professor and Director, Food and Agriculture Institute Simon Fraser University Lorne Hepworth, Board Member, Agricultural Research and Innovation Ontario Michael Harvey, Executive Director, Canadian Agri-Food Trade Alliance Margaret Hudson, President and CEO, Burnbrae Farms Limited Margaret Hughes, Vice President, Sales and Marketing, Avena Foods Mark Walker, Vice President, Markets and Trade, Cereals Canada Martin Scanlon, Dean and Professor, Faculty of Agricultural & Food Sciences, University of Manitoba Matt Korpan, Executive Director of Research and Development, Center for Horticultural Innovation Peter Dhillon, Chairman, Ocean Spray Randall Huffman, Chief Food Safety and Sustainability Officer, Maple Leaf Foods Ray Price, President, Sunterra Richard Lee, Executive Director, Ontario Greenhouse Vegetable Growers Rickey Yada, Dean and Professor, Faculty of Agricultural, Life & Environmental Sciences, University of Alberta Ryder Lee, General Manager, Canadian Cattle Association Sylvanus Afesorgbor, Associate professor, University of Guelph Ted Bilyea, Distinguished Fellow, Canadian Agri-Food Policy Institute Tim Kennedy, Executive Director, Canadian Aquaculture Industry Alliance Tom Rosser, Assistant Deputy Minister, Agriculture and Agri-Food Canada Trevor Tombe, Professor, University of Calgary William Gould, Director of Business Operations, The Progressive Group of Companies Yves Ruel, Associate Executive Director, Chicken Farmers of Canada
UN Comtrade. Trade.
UN Comtrade.
Statistics Canada. Annual Survey of Manufacturing Industries, 2023.
Statistics Canada. Canadian International Merchandise Trade Database.
UN Comtrade.
UN Trade and Development. Revealed Comparative Advantage.
Statistics Canada. Annual Survey of Manufacturing Industries, 2023.
UN Comtrade.
World Bank Group. Aquaculture production (metric tons) – Ecuador.
World Bank Group. Aquaculture production (metric tons) – Ecuador.
OECD and FAO. OECD-FAO Agricultural Outlook 2024-2033, 2024.
Australian Government. Snapshot of agricultural export diversification to ASEAN, 2024.
New Zealand Foreign Affairs and Trade. The ASEAN-Australia-New Zealand Free Trade Area.
Government of Brazil. Historic milestone for Brazilian agribusiness shows leadership in global food security, 2024.
United Nations. Global trade to hit record $33 trillion in 2024, but uncertainties over tariffs loom, 2024.
World Trade Organization Stats. Merchandise export volume change.
Global Trade Alert. Cereals.
Afesorgbor, SK. Trump’s Tariff Threat Could Shake Trade Relations and Upend Agri-Food Trade, 2024.
Government of Canada. Opportunities and Benefits of CETA for Canada’s Fish and Seafood Exporters, 2022.
OECD and FAO.
OECD and FAO.
USDA Economic Research Service. USDA Agricultural Projections to 2034, 2025.
UN Comtrade.
Zalles, V., et al. Near doubling of Brazil’s intensive row crop area since 2000, 2018.
USDA Economic Research Service. International Agriculture Productivity Data.
USDA Economic Research Service. Brazil’s Momentum as a Global Agricultural Supplier Faces Headwinds, 2022.
UN Comtrade.
Australian Government. Agriculture, fisheries, and forestry exports in 2022–23, 2024.
Australian Government – ABARES. Snapshot of Australian Agriculture 2024, 2024.
Invest in Spain. Spain for agri-food industry.
UN Comtrade.
United States International Trade Association. Kazakhstan – Country Commercial Guide, 2022.
Statistics Canada. Table 32-10-0456-01. Production and value of greenhouses fruits and vegetables.
FAO STAT.
RBC Climate Action Institute. Climate Action 2025, 2025. 40FAO STAT.
OECD and FAO.
FAO AQUASTATS. Agricultural water withdrawal as % of total water withdrawal.
AAFC. Overview of Canada’s agriculture and agri-food sector, 2024.
Australian Government – ABARES. Snapshot of Australian Agriculture 2024, 2024.
USDA Economic Research Service. Land Use, Land Value & Tenure – Major Land Uses, 2025.
Statistics Canada. Canada’s farms integrate renewable energy production and technologies toward a future of sustainable and efficient agriculture, 2023.
OECD. Agricultural Policy Monitoring and Evaluation, 2024.
AgFunder. Global AgriFoodTech Investment Report 2024, 2024.
Protein Industries Canada. The Road to $25 Billion, 2022.
Deetken Insights. The socio-economic impacts of 5G, 2022.
Canadian Radio-television and Telecommunications Commission. Current trends – Mobile wireless.
World Bank. Connecting to Compete, 2023.
CANCEA. Canadian Construction Association: Transportation Infrastructure, 2022.
OECD. Agricultural Policy Monitoring and Evaluation, 2024.
OECD. Agricultural Policy Monitoring and Evaluation, 2024.
OECD and FAO.
AAFC. Distribution of slaughtering activity and number of federally inspected plants.
AAFC. Sector Trend Analysis – Meat trends in Japan, 2023.
Estimates are conservative and based on 2023 nominal value.
Trade data is converted from USD to CAD using Bank of Canada’s average annual rates.
Total trade of all goods. This category is inclusive of agriculture and agri-food.
Model estimates a high growth scenario of Canada’s market share growing from 3.7% in 2023 to 4.8% in 2035.
Based on a 3-year moving average.
Scenarios are developed for HS codes 1-24, from 2024 to 2035. Growth in global trade is based on the latest OECD-FAO Agricultural Outlook (projected export tonnage growth at 2023 prices) individually for Cereals, Oil Seeds, Fats, Sugars, Meat and Fish. Global exports in all other categories are assumed to grow at 1% per-year based on OECD-FAO’s projected growth for agricultural commodities overall.
How indoor agriculture can serve as a local food source in northern—and urban—settings
Vertical farming is a form of controlled environment agriculture (CEA), that gives growers more control over the environment they tend their crops in, which can be advantageous in challenging growing conditions.
Indoor vertical farming was set to take off in a big way, but lacklustre investment returns and scaling challenges has limited production.
“There was a big bubble around this industry that has more or less burst over the past four years,” said Dr. Alesandros Glaros, Food and Agriculture Institute, University of the Fraser Valley. “The companies that have weathered the storm are patient and have invested substantially in research and development. They have tried and true technologies, are integrated into strong local and regional supply chains, and are highly collaborative. Now, we can find their vertically grown, competitively priced leafy greens in remote regions as well as major grocery stores.”
There are examples of innovations in the space. British Columbia-based QuantoTech Solutions, a vertically integrated ag-tech company, has developed a growing system that features 8 by 12 feet sheds with shelving units to allow for vertical farming, producing 4.8 between 7.2 tonnes of food per year, including leafy greens, strawberries, and cherry tomatoes. Each unit requires approximately 37.2 to 52 gigajoules of energy per year, which is less than the energy needed to power the average Canadian home1. The mobile units were originally developed for northern and challenging growing conditions, but are also suitable for urban settings.
QuantoTech Solutions’ system features 8 by 12 feet sheds with shelving units to allow for vertical farming.
A food source for northern and remote communities
Northern and remote communities face many barriers in accessing fresh fruits and vegetables, which are often of poor quality and high cost by the time they reach northern communities from production or distribution centers below the 49th parallel. Indoor vertical farms are not capable of addressing northern food insecurity alone or replacing traditional Indigenous food sources, but can contribute to raising the region’s supply of local, fresh vegetables and fruit.
Key considerations for indoor agriculture in northern and remote communities:
1. Investing and scaling. The timescale for return on investment and availability of grants to support upfront and operational costs are critical before growers can invest in starting, or scaling, indoor farming.
2. Energy source and use. Around 178 remote Indigenous and northern communities in Canada rely on generators powered often by diesel fuel as they are not connected to the North American electricity grid and natural gas infrastructure2.
3. Growing yields. Sustaining operations require streamlining access to inputs and improvements in yields. Developing and maintaining access to suppliers and local vertical farming expertise is key.
Building up urban agriculture
The indoor vertical ecosystem can easily be replicated in urban settings, which have their own set of challenges. Connections to agriculture production in large urban areas is increasingly less common as our cities expand and demand rises, placing a high need for commercial scale production with streamlined supply chains. Indoor vertical farms that can be integrated within building developments and retrofits is one pathway to provide urban dwellers with fast access to local produce, as well as potentially contributing to cities and the building sectors’ decarbonization efforts.
Key considerations for indoor agriculture in urban areas:
1. Connecting consumers. Encouraging consumers to get their greens from a local vertical farm will require awareness and ease of access.
2. Making the case. More energy, more space, and more investments are needed to scale indoor vertical farms in or close to urban areas and the return on investment must be there to justify further development.
3. Planning land use. Urban areas are home to intense competition for land. Throwing food production into the mix should be strategically aligned to city planning, collaborative with municipalities, and meet local needs.
Indoor vertical farming could evolve as a mainstream source of food across Canada, if it improves the business case in scaling production. But for now, its strength is in meeting niche, local market demands.
Lisa Ashton is Agriculture Policy Lead at RBC Climate Action Institute.
Statistics Canada. (2024). Household energy consumption, Canada and provinces.
Canada Energy Regulator. (2023). Market Snapshot: Clean Energy Projects in Remote Indigenous and Northern Communities.
Key findings
Canada’s greenhouse sector is a hotbed for growth. Greenhouses specializing in fruits and vegetables in Canada have increased in farm gate value for the 11th consecutive year, up 9.2% to $2.5 billion in 2023–doubling in size from a decade ago.1
Infrastructure limitations could stunt future growth. Greenhouse production in Ontario is expected to more than double in acreage over the next 10 years, but the industry faces key barriers in accessing energy, water, waste management, and labour2. The Windsor-Essex and Chatham area peak demand is projected to rise from 500 megawatt (MW) in 2023 to approximately 2,100 MW by 2035, driven primarily by growth in advanced and electric vehicle battery manufacturing and greenhouses.3
Canada’s global greenhouse strengths lie in productivity and land-use efficiency. The country’s greenhouse production boasts the highest yields per area of land among top greenhouse nations. Canada produces 4.6 times more per area of land than Spain, is slightly more productive than the Netherlands, and 2.6 times more than Mexico4,5. The challenge over the next decade for Canada will be to continue to lead on land-use efficiency, while scaling production to meet domestic and trade demands.
A key market for export growth is the western United States. Greenhouse vegetables account for 39% of Canada’s fresh produce exports, 99.5% of which are U.S.-bound. Canadian greenhouse fruit and vegetable products are consumed in the east from New York to Florida. Canada could also tap into the U.S. Midwest’s 68-million-strong market, if it can build relationships, branding, and cold chain logistics.
Greenhouses must solve their energy trilemma—of demand, emissions, and bills—to expand. Energy costs for Canadian greenhouses have surged 55% between 2013 and 2023, while natural gas-sourced power is driving the industry’s carbon footprint.6,7 Reducing natural gas demand and the green premium for alternatives including renewable natural gas, hydrogen, and clean electricity would enable Canadian greenhouses to thrive in a low carbon economy.
Rows of strawberry plants inside Center for Horticultural Innovation, Leamington, ON
(From left to right) Linda Nuhn, RBC; Lisa Ashton, RBC; Aaron Coristine, OGVG; Matt Korpan, CFHI; Peter Quiring, NFF; John Stackhouse; Gary Toupin, RBC.
Banana trees inside Center for Horticultural Innovation, Leamington, ON
Table of fresh produce grown at the Center for Horticultural Innovation, Leamington, ON
Sticky surface to detect location of bugs, Center for Horticultural Innovation, Leamington, ON
Opening the doors to the possibilities
Globally, population growth is expected to rise to 9.7 billion in 2050, with food demand rising around 56% by 2050 from 2010 levels8,9. Meeting future demand is a daunting task amid rising food insecurity. In Canada, more than 20% of households experience food insecurity, while food prices in stores have increased 21.6% from February 2021 to February 2024 due to several factors, including poor growing conditions, supply chain issues, and high input costs10. These factors present a challenge for the agriculture sector to innovate and advance climate resilient, efficient systems that bring more of the food produced to people’s plates at an affordable price.
Canada’s greenhouses are well positioned to help meet the challenge because of their high land use and input efficiency, potential to shorten supply chains for Canadians, and a strong history of growth and innovation.
Between 2013 and 2023, greenhouses specialized in vegetable and fruit production have grown each year11:
103 %
Value of product
36 %
Harvested volume
12 %
Greenhouse operations
Doubling down on these achievements over the next decade would require overcoming energy, water, and waste infrastructure challenges, while addressing regulatory constraints, labour shortages, and shortcomings in supply chains.
Greenhouses’ innovation advantage is growing in controlled environments. Enclosed spaces mean operators can design dynamic systems of lighting, fertigation, and heating to optimize plant growth and improve efficiency of resource use. For example, greenhouse operators can adopt low-tech innovations such as horizontal curtains to keep heat closer to plants, and high-tech innovations in early genetic testing to combat disease and pests that risk wiping out an entire crop’s growing cycle. Controlled environment agriculture also presents an opportunity to innovate in climate adaptation. By growing fruits and vegetables in enclosed structures and in controlled growing mediums, production can be more resilient to extreme weather events, changes in precipitation, and seasonal shifts, safeguarding a consistent supply of food. With climate change already disrupting supply and markets, there are economic costs to inaction—there is no time to create a false dilemma between choosing climate action or food supply12. Instead, food production and supply chains can advance their efforts in converging economic, production, and climate goals.
Canadian Greenhouses energy use is primarily powered by natural gas, which means high energy use equates to high greenhouse gas (GHG) emissions13. Canada needs to expand clean and renewable energy options, while also bringing down bills and reducing energy consumption to help the sector successfully decarbonize. Options in development include renewable natural gas (RNG) production from agriculture biowaste and neighbouring landfills, investments in regionalized hydrogen production, and exploring deployment of industrial sized electric heat pumps.
Disruptions and volatility in markets are to be expected from now until 2050, but so too is rising demand for fruits and vegetables produced in Canada. North America’s population is estimated to steadily grow during this period, and as incomes rise, consumer preferences are likely to shift to selecting more nutritious foods like fruits and vegetables for health reasons and complementary measures such as sugar taxes. Supply needs to be available to meet changing tastes, but projections suggest that the land used for fruits and vegetable production in North America will shrink over the next decade14. These multifaced issues present new growth challenges for Canada’s greenhouse sector.
What is CEA?
Controlled environment agriculture (CEA) is a continuum of growing systems from low tech to high tech that allows growers to have more control over the environment that crops are grown in.
CEA growing infrastructure
Glass or poly greenhouse:
Enclosed structure made from glass, polycarbonate, or
polyethylene.
Low-tech plastic hoop house:
Plastic film tunnel-shaped structure that are often low-tech with limited climate control systems.
Indoor vertical farm:
Enclosed room such as warehouses with stacked growing units that often use artificial lighting and soilless growing mediums.
Other indoor farm:
Enclosed, opaque structures such as retrofitted buildings using different growing systems, from aeroponics to deep-water culture.
CEA growing medium
Hydroponics:
Plants are grown in water-based mineral nutrient solutions.
Aeroponics:
Plants are grown by suspending their roots, receiving nutrients through misted solutions.
Aquaponics:
Plants are grown in water in a symbiotic environment with aquatic organisms.
Soil-based:
Plants are grown in soil.
A glimpse into current Canadian greenhouse production
A regionalized approach to greenhouse growth
In Canada, there are 920 greenhouses specializing in fruits and vegetables, spanning more than 5,000 acres15. These greenhouses produce more than 800,000 tonnes of tomatoes, cucumbers, peppers, lettuce, strawberries, and other produce, and are mainly made of glass, polycarbonate, or polyethylene, with different growing mediums depending on the crop16. Canada is also home to greenhouse production for flowers and cannabis. There are more than 1,500 operations growing flowers and plants generating a farm gate value of $2.1 billion in 202317. This report is focused on fruit and vegetable greenhouse production given Canada’s opportunity and challenge ahead to expand agri-food production and trade, while decarbonizing and adapting our food system to climate change.
Two-thirds of greenhouse production of fruits and vegetables in Canada takes place in Ontario and is mostly concentrated in Essex County in the province’s southwest. Leamington, Ontario, or the “Sun Parlour” of Canada, is in Essex County and home to North America’s largest concentration of greenhouses growing fruits and vegetables.
Essex County benefits from warmer temperatures, long sunny days, a Great Lakes-induced microclimate that creates ideal growing conditions, and is under an hour away from the U.S. border. The region has also benefitted from family farms that have invested locally and innovated in greenhouse construction, research, and cogeneration of energy and heat, making it a unique greenhouse hub. For example, the Center for Horticultural Innovation in Leamington trials the production of fruits and vegetables and new technologies such as bug-zapping drones to identify what can be scaled in Canadian greenhouses, keeping the industry moving forward. Ontario’s broader greenhouse sector is also supported through a variety of means including innovation funds such as the Greenhouse Competitiveness and Innovation Initiative (GCII), energy efficiency incentives, numerous research projects under the Ontario Agri-Food Research Innovation Alliance, and energy expansion projects underway to support regional growth.
Canada: A Greenhouse Powerhouse
Source: Statistics Canada
British Columbia, Quebec, and Alberta follow in production with smaller slices of the pie, but each have a growing greenhouse sector, in part, because of strategic regional development.
Quebec is actioning its ‘2020-2025 Greenhouse Growth Strategy’ through mechanisms such as rebates on energy consumption to double the size of the province’s greenhouse operations to approximately 620 acres by 2025.
Alberta is scaling innovation in agri-tech in greenhouses through research on novel strawberry and tomato seed varieties and efficiencies in lighting and energy. There is also support in the province to develop cross sector collaborations between the energy and greenhouse sectors to install transparent solar panels within greenhouses and facilitate the use of waste heat and CO2 from the production of natural gas to feed plant growth.
British Columbia is leveraging agriculture technology to advance its greenhouse sector through the creation of the B.C. Centre for Agritech Innovation at Simon Fraser University—part of the StrongerBC Economic Plan.
Canada’s greenhouse vegetables account for 39% of all fresh produce exports, valued at over $1.4 billion. Ontario is responsible for 88% of this export value, predominantly to the U.S. (99.5%), but also to Japan, France, and Taiwan18 .
The U.S.’s demand for fresh fruits and vegetables exceeds its production capacity, making it a key market for Canada to expand exports. For example, greenhouse tomatoes represent around 65% of the U.S.’s total fresh tomato import volume and value, and make up a significant chunk of its domestic consumption19. Canada is second to Mexico in U.S. imports of greenhouse tomatoes by some distance. Building upon innovation and energy solutions, Canada could market its products as high-tech and low-carbon to capitalize on consumers’ rising preference for sustainable products20.
Growing conditions, costs, and regulations
Delivering on domestic and export demands requires highly efficient and productive growing systems.
In Ontario, the top producers of greenhouse tomatoes, cucumbers, and peppers had gross margins of approximately 80 to 90% between 2017 and 2021, growing in greenhouses sized at approximate 29, 117 and 49 acres on average, respectively21.
Natural and artificial lighting, CO2, heat, water, nitrogen, phosphorus, and companion plants all contribute to a dynamic growing system for greenhouse fruits and vegetables. The balance across inputs varies depending on the produce. Cucumbers are mostly made up of water and therefore require substantial amounts of water to grow. In greenhouses, water is recirculated, and cucumbers’ water needs are approximately 800 to 1,200 litres per square metre per growing season. The exact amount of water needed depends on different factors, including the light source used. Inputs for tomatoes can slightly vary depending on the variety, but the outputs highlight the key differences. For example, a beefsteak tomato requires similar lighting, water, energy, CO2, and fertilizer to cherry tomatoes, yet beefsteak yields are more than double of the cherry variety22.
Greenhouses use energy, primarily from natural gas, for heating, lighting, and CO2 production. Natural gas is often used to heat water using boilers, which is pumped into greenhouses via piping that runs along the ground like a grid network and serves a dual purpose in creating tracks that harvesters can move along like a train to pick the produce. The flue gas from the boilers is often scrubbed and converted into CO2 for plant food.
Natural gas, electricity, heating oils, and other types of fuels are rising in cost for Canadian greenhouse operators, and have increased by 55% from 2013 to 2023, to $406 million23. Energy use in greenhouses can also be costly for the environment with the use of natural gas often the main source of emissions in a greenhouse’s carbon footprint24. Some greenhouse operations have developed co-generation energy and heat facilities that power production in greenhouses and is integrated in the electric grid to help optimize efficiencies and meet peak energy demands. For example, Leamington-based Under Sun Acres operates four combined heat and power gas engines adjacent to their greenhouse used for pepper production. The engines supply the Ontario electricity grid with 13 MW of electricity, and the waste heat recovered from the engine exhaust and jacket is utilized to heat the greenhouse25.
Co-generation engine at Under Sun Acres, Leamington, ON
Greenhouse’s role in energy production can help meet regional demands, such as the Windsor-Essex and Chatham area’s projected rise from 500 MW peak demand in 2023 to approximately 2,100 MW by 2035, primarily driven by greenhouses, advanced manufacturing, and electric vehicle battery production.
Land is also a hot commodity, but efficiency per area of land relative to field production is a keystone in greenhouse’s sustainability story, freeing up land for other uses. In Canada, greenhouse tomatoes, peppers, cucumbers, lettuce, and strawberries together produce around 8.5 times more per area of land compared to Canadian field production, demonstrating strong productivity. However, yields over the past decade have plateaued26,27. Innovations underway to surpass historic yields include dynamic lighting systems, reconfiguring growing infrastructure to optimize space and light, and genetics to overcome stagnation.
Pyramid growing system at the Center for Horticultural Innovation, Leamington, ON
Labour is necessary but costly, accounting for 29% of Canada’s greenhouse operating expenses28. Farmer 4.0 highlights that greenhouses have far less returns on labour expenditure relative to other agriculture sectors such as beef. While the harvesting process remains primarily human-powered, promising innovations such as conveyer belt harvesters and robotics transporting and packaging in warehouses, can cut the time it takes produce to reach store shelves.
Yellow peppers at Under Sun Acres, Leamington, ON
Greenhouses have benefitted from government and industry support, but their policy and regulatory environment can also be an impediment. Controlled environment agriculture is often caught up in a no-man’s land of regulations, where it does not fit neatly into agriculture or industrial categories for development and access to resources. It can also take years to get approval for new projects. Canadian greenhouses face higher taxes and barriers in accessing affordable energy relative to some of their U.S. counterparts, hurting their competitiveness. The sector also comes up against regulatory barriers in accessing sufficient water, leading operators to choose between a few options, including making large upfront investments to build irrigation ponds and storm water collection systems, paying hefty development charges, or enduring lengthy processes to obtain easements and permits to access water.
The Big 5
Canadian fruit and vegetable greenhouses are highly specialized. The five big staples in Canadian greenhouse production include:
Tomatoes: Tomatoes are the king of greenhouse production in Canada, covering more than 1,800 acres, producing around 315,000 tonnes and $869 million in farm gate value29.
Cucumbers: Cucumbers represent the largest share of Canadian greenhouse vegetable exports at 34% of the value30.
Peppers: With nearly 170,000 tonnes, produced in 2023, peppers are the third largest greenhouse product in volume and value, but second in land use31.
Lettuce: Lettuce is a distant fourth in greenhouse production, led by Quebec. There is an opportunity to boost domestic production as lettuce represents the highest share of field vegetables imported into Canada by value at 18%, with the U.S. and Mexico combined accounting for around 99% of imports32.
Strawberries: Strawberries are the star fruit in greenhouse production, but currently account for only 3% of Canadian fruit and vegetable space33. This household favourite has runway to grow as Canadian greenhouse operators continue to modify their approach to protect strawberries from pest and diseases.
Five to watch
Canadian tastes are evolving and diversifying and Canada’s access to highly consumed items such as bananas and coffee could become more challenging over time amid concerns about climate change, supply chain disruptions, and geopolitical shifts. This context creates opportunities to innovate in the types of commodities grown in Canada.
Berries beyond strawberries: Raspberries and blueberries are among the top five fruit imports by value in Canada, presenting a large domestic demand for greenhouses to meet if production of these delicate, high-value products can be mastered34.
Spinach: Canada is a net importer of spinach, but efforts are underway to improve yield in greenhouses, speed up and automate the cultivation process, and improve cold chain logistics35.
Bananas: Bananas are the largest fruit import into Canada by volume, and have experienced global yield increases since the 1960s. But the next 50 years may not be as fruitful, opening an opportunity for greenhouses to grow bananas36,37.
Coffee: While it may be hard to imagine Canadian coffee production, research is underway to explore development of greenhouse coffee beans and address the multifaceted issues causing cocoa bean shortages and soaring prices38.
Okra: Okra is a key ingredient in many international cuisines and is steadily climbing year-over-year as a vegetable imported into Canada. Currently representing 1% of vegetable import value, it has grown more than 50% from 201839.
Canada leads on land use efficiency
Canada’s strength in greenhouse vegetable and fruit production relative to its international competitors lies in its productivity per acre. Canada produces 4.6 times more per area of land than Spain, is slightly more productive than the Netherlands, and 2.6 times more than Mexico40,41,42.
Productivity per area of land
Estimated yield per hectare (tonnes)
*Global comparison of top greenhouse producing nations in 2022. Estimates include combined annual greenhouse production of tomatoes, cucumbers, peppers, lettuce, and strawberries.
Source: Statistics Canada, Government of Mexico, EuroStat.
These high-producing regions have their own strengths, thanks to a variety of factors including the technology they’ve adopted, geographical location, and climatic conditions. While Canada can’t compete with Mexico’s heat—at least not in the near-term—, it can learn many lessons from its competitors.
Climatic conditions
Labour availability
Proximity and access to North American markets
Mexico has access to a large and productive labour force that will be challenging to replicate in Canada. Canadian greenhouse operators are actively exploring approaches to integrate the use of artificial intelligence (AI) in greenhouse operations to centralize data and optimize growing conditions in real-time. The use of AI and other efficiency disruptive technologies are not expected to replace humans, but can improve Canada’s competitiveness. Complementary to a productive labour force and favourable climatic growing conditions, Mexico has also benefitted from open and free trade with the U.S. supported earlier by the North American Free Trade Agreement (NAFTA) and now the Canada-United States-Mexico Agreement (CUSMA). Simultaneously, Mexico fostered investments in large scale greenhouse facilities, improving its competitiveness overtime in providing fresh produce year-round that can reliably fulfill the U.S. demand. However, a growing trade imbalance between the U.S. and Mexico on fresh fruits and vegetables means there is pressure within the U.S. to explore legislative options that support its fresh produce industry43.
Proximity and access to European markets
Regional concentration
Climatic conditions
Spain’s ability to scale centralized greenhouse production within a short period of time and optimize regional market access and trade is certainly a model to learn from. Centralization of production has enabled Spain to emerge as a greenhouse exporting leader. The southeast city of Almeria accounts for 72% of greenhouse vegetables in the country, spanning 98,000 acres—the largest concentration of greenhouses anywhere in the world44. Spurred from strategic development and a lack of land use planning, Almeria is a centralized hub market that accounts for more than 80% of Spain’s greenhouse vegetable exports to the European Union45. However, Almeria’s expansive network of greenhouses has created negative externalities for the environment and those working and living within the region, such as depletion and salinization of water supply and even changes to the microclimate of the region46. Mitigating negative impacts on local communities, pollution, and the workforce from expanding highly concentrated areas of greenhouse production requires an inclusive and strategic lens to planning and development.
Investment in decarbonization
Land-use efficiency
High-skilled labour matches hi-tech industry
The Netherlands has a head start over Canada in navigating the complex landscape of producing more on less land, while mitigating GHG emissions. The country has limited land availability and has set GHG targets specifically for the greenhouse sector of 1Mt CO2 eq reduction by 2030 from 2016 levels, primarily from reducing emissions from energy47. The Netherlands’ target is coupled with enabling mechanisms such as the Energy Efficiency in Greenhouse Horticulture scheme, Green Label greenhouse certification, and demonstration projects to promote knowledge development and exchange. Packaging GHG targets with mechanisms designed to support the sector to grow and innovate while transitioning to a low-carbon system is a model that could be replicated by governments in Canada through initiatives such as the Sustainable Agriculture Strategy.
Climatic conditions
Labour availability
Proximity and access to North American markets
Mexico has access to a large and productive labour force that will be challenging to replicate in Canada. Canadian greenhouse operators are actively exploring approaches to integrate the use of artificial intelligence (AI) in greenhouse operations to centralize data and optimize growing conditions in real-time. The use of AI and other efficiency disruptive technologies are not expected to replace humans, but can improve Canada’s competitiveness. Complementary to a productive labour force and favourable climatic growing conditions, Mexico has also benefitted from open and free trade with the U.S. supported earlier by the North American Free Trade Agreement (NAFTA) and now the Canada-United States-Mexico Agreement (CUSMA). Simultaneously, Mexico fostered investments in large scale greenhouse facilities, improving its competitiveness overtime in providing fresh produce year-round that can reliably fulfill the U.S. demand. However, a growing trade imbalance between the U.S. and Mexico on fresh fruits and vegetables means there is pressure within the U.S. to explore legislative options that support its fresh produce industry43.
Proximity and access to European markets
Regional concentration
Climatic conditions
Spain’s ability to scale centralized greenhouse production within a short period of time and optimize regional market access and trade is certainly a model to learn from. Centralization of production has enabled Spain to emerge as a greenhouse exporting leader. The southeast city of Almeria accounts for 72% of greenhouse vegetables in the country, spanning 98,000 acres—the largest concentration of greenhouses anywhere in the world44. Spurred from strategic development and a lack of land use planning, Almeria is a centralized hub market that accounts for more than 80% of Spain’s greenhouse vegetable exports to the European Union45. However, Almeria’s expansive network of greenhouses has created negative externalities for the environment and those working and living within the region, such as depletion and salinization of water supply and even changes to the microclimate of the region46. Mitigating negative impacts on local communities, pollution, and the workforce from expanding highly concentrated areas of greenhouse production requires an inclusive and strategic lens to planning and development.
Investment in decarbonization
Land-use efficiency
High-skilled labour matches hi-tech industry
The Netherlands has a head start over Canada in navigating the complex landscape of producing more on less land, while mitigating GHG emissions. The country has limited land availability and has set GHG targets specifically for the greenhouse sector of 1Mt CO2 eq reduction by 2030 from 2016 levels, primarily from reducing emissions from energy47. The Netherlands’ target is coupled with enabling mechanisms such as the Energy Efficiency in Greenhouse Horticulture scheme, Green Label greenhouse certification, and demonstration projects to promote knowledge development and exchange. Packaging GHG targets with mechanisms designed to support the sector to grow and innovate while transitioning to a low-carbon system is a model that could be replicated by governments in Canada through initiatives such as the Sustainable Agriculture Strategy.
What Canadian greenhouses need to grow
Canada’s greenhouse sector is a success story in growth and productivity, but it’s now time to consider steps that can sustain and expand the sector. A pan-Canadian greenhouse growth strategy that maps out production, trade, value, and GHG targets could enable the sector to still experience year-over-year growth by 2035 and beyond. In conjunction with mapping the possible, considering infrastructure, skills, policy, investment, and research needs are essential to address the challenges the sector will need to navigate.
Energy: Address the sector’s trilemma
Natural gas is the primary energy source powering the sector, but continued use could challenge Canada’s GHG reduction targets. Reducing production carbon footprints would require greenhouses to scale alternative energy sources such as RNG, electric powered heat pumps, and hydrogen. RNG makes up only 0.36% of natural gas distribution in Canada, but has the potential to halve the carbon intensity of gas use relative to natural gas, depending on the type of feedstock (e.g., manure) used48 49 50. However, green premiums for such alternatives are high. For example, in Ontario RNG is cheaper than electricity, but five times more expensive than natural gas51. Creating awareness and financial mechanisms that appropriately compensate farmers and greenhouse operators for biowaste suitable for RNG production is vital to ensure Canada builds a consistent supply of feedstock for biodigesters.
Fully electric systems are also being explored. But operators considering switching to electric heat pumps to improve energy efficiency and reduce their carbon footprint, must also consider the source of electricity. Nationally, GHGs associated with public electricity and heat production are down 56% as of 2022 from 2005, which is Canada’s baseline year for its 2030 GHG emissions target52. However, the level of GHGs associated with electricity substantially differs between provinces as the power sources vary between fossil fuels and renewables, equating to different carbon intensities. In 2021, Alberta electricity generation’s carbon intensity was 510 times more than Quebec53. This variability emphasizes the need for regionalized strategies and targeted commitments and action to clean grid expansion and enable industrial processes to decarbonize.
Waste: Design circular and low-carbon systems
Natural gas is the primary energy source powering the sector, but continued use could challenge Canada’s GHG reduction targets. A steady and consistent supply of feedstock is required to scale RNG. Greenhouses produce biowaste that could be used as a feedstock for RNG production, but would likely need to be supplemented with other waste to make supply consistent as greenhouse waste dips during growing seasons and peaks when they end. Due to biosecurity concerns and plastic tags and twine in greenhouse biowaste, the safest and common option is to dispose of the biowaste at a landfill. Close to Canada’s greenhouse hub, Enbridge is developing an RNG project at Waste Connections of Canada’s Ridge Landfill in Chatham-Kent, which is expected to offset 110,000 CO2eq tonnes from the landfill and produce 1.591 petajoules per year54.
Landfills like Ridge Landfill are at capacity or expanding to meet waste disposal demands. To alleviate waste disposal pressure and complement landfill RNG production, agriculture biodigester hub- and- spoke models could present new revenue streams within highly productive agriculture regions, collecting farm biowaste from multiple agriculture systems, from crop to livestock to greenhouses. That would create circularity and promote rural access to RNG.
Land: Produce more on less
The increasing cost and competition for land among housing, retail, agriculture, and industry, especially within densely populated regions such as the Windsor and Montreal Corridor, has strained land resources. Canadian greenhouses have demonstrated their global leadership in productivity per area of land, but innovations that lead to leaps in yield are needed to maintain Canada’s global lead. Producing more with less is one of the agriculture sector’s biggest challenges. Greenhouses’ contribution to addressing this challenge for growth, should be more explicitly included and supported through sector-wide sustainability policy, especially the forthcoming federal Sustainable Agriculture Strategy.
Water: Conserve an increasingly precious resource
Like land, water access is also being pinched in some regions for greenhouse operators. Development charges introduced by municipalities on new developments using public water in Chatham-Kent, Ontario, highlight the changing landscape. Investments in rural infrastructure is needed from different levels of government given the rising demand for food production and the competing pressures and rising costs of natural resources. Alignment across municipalities and provincial infrastructure development plans and growth targets for the sector could help rural Canada address future shortcomings.
Light: Consider community in rural development
Greenhouses can emit bright lights around the clock, which can be a nuisance to rural residents. Municipalities in regions such as Leamington that have a high concentration of greenhouses have regulations that require operators to mitigate light pollution by using curtains or turning lights off in the evening. Ensuring greenhouse operators comply with local regulations and expansion plans consider the implications for community well-being is critical to its sustainable growth and ability to attract high-skilled labour.
Skills: Rebrand Canadian agriculture to attract diverse talent
Advancements in automation in greenhouses can result in greater efficiency and create demand for more high-skilled jobs. But is Canada ready to fill them? The sector is already struggling to address its labour shortage, with one in every three agriculture jobs expected to be vacant by 2030 without significant action55. Convincing more Canadians to move to rural regions is increasingly challenging with rural population growth 15 times slower than in urban areas56. Further, recent policies that impact foreign students’ pathways to stay in Canada can shrink enrollment in post-secondary programs, further limiting access to high-skilled individuals. As these challenges mount, greenhouse operators continue to rely heavily on temporary foreign workers from Mexico and Central America. Agriculture needs to rebrand to attract job seekers and promote itself as a place for highly skilled, tech-driven, and ambitious individuals that want to make a positive impact in Canada and globally.
Regulation and Policy: Modernize for a more competitive world
Becoming a global center for sustainable and efficient greenhouse production would require exploring the policies and regulations that leave Canada at a disadvantage compared to global competitors. A key place to start is by identifying and modernizing regulations that put greenhouses and other forms of CEA in regulatory no-man’s land and delay development.
Market Development: Develop a blueprint for tapping into new markets
A blueprint for greenhouse fruit and vegetable exports could help stakeholders chart a course on possible actions Canada needs to expand. Targeting the U.S. Midwest is a key expansion opportunity and could serve as a foundation of a trade blueprint. Co-led industry and government trade promotion missions can serve as means to collect information on cold chain logistic needs, size up the market opportunity, build relationships and a Canadian brand. Expansion to in new areas should also consider climate impacts of extending refrigeration and food miles, as well as key competitors in the region such as California’s field production.
Trade: Create a made-in-Canada carbon calculator
The greenhouse sector is primed for a made-in-Canada carbon intensity calculator. Not knowing the carbon intensity of greenhouse production is a blind spot for Canadian climate policy and for the industry in developing solutions and marketing its sustainability progress. Governments have a role in investing in and collaborating on the development of user-friendly tools for Canadian greenhouse operators to identify, understand, and reduce their carbon footprint. Calculating the carbon intensity of products is increasingly important to meet market demands, overcome trade barriers, and empower the industry to make informed decisions on new developments and retrofits.
Research: Coordinate and scale Canadian innovations
Canada is not only a leader in greenhouse productivity but also in innovation. Yet, funding programs are fragmented, and knowledge translation is siloed. These challenges come from Canada operating on a reactive model, whereby industry and universities might work collaboratively with individual operators on projects to address a specific issue, but lack overarching alignment on research priorities, funding, and goals. This patchwork presents an opportunity for an umbrella research framework to bring projects and stakeholders together to advance research in a targeted and coherent fashion. Stakeholders could agree upon research priorities such as automation, genetics and breed, Net Zero goals, and agronomy, which can then be used to facilitate coordination and partnerships across relatable projects. A research framework with priorities, committed funds, and timebound objectives can also ensure research institutions are better aware of their relative speed of travel, aligning industry needs and research projects.
The next 10 years
Greenhouses can emerge as a pillar of Canada’s agri-food growth and sustainability ambitions over the next decade and towards 2050. The sector is set to double in acreage over the next 10 years, deliver more diversity of products, and improve yields. The real challenge for Canadian greenhouses in meeting demands in growing markets and overcoming rising resource constraints will be developing infrastructure that spurs growth and decarbonization, and enables rural communities to thrive.
Dias et al. (2017). Life cycle perspectives on the sustainability of Ontario greenhouse. tomato production: Benchmarking and improvement opportunities. Journal of Cleaner Production.
United Nations. (2022). World population to reach 8 billion this year, as growth rate slows.
Van Dijk et al. (2021). A meta-analysis of projected global food demand and population at risk of hunger for the period 2010–2050. Nature Food.
Statistics Canada. (2024c). Consumer Price Index, February 2024.
Statistics Canada. (2024a).
Deloitte. (2022). The turning point: A new economic climate in the United States.
Statistics Canada. (2024b).
Organisation for Economic Cooperation and Development (OECD). (2022). OECD-FAO Agricultural Outlook 2022-2031
Statistics Canada. (2024a).
Statistics Canada. (2024a).
Statistics Canada. (2024d). Estimates of specialized greenhouse operations, greenhouse area, and months of operation.
Agriculture and Agri-Food Canada (AAFC). (2022a). Statistical Overview of the Canadian Greenhouse Vegetable and Mushroom Industry.
United States Department of Agriculture (USDA). (2024). Vegetables and Pulses Outlook: April 2024.
McKinsey & Company. (2023). Consumers care about sustainability—and back it up with their wallets.
Open Government. (2024). Ontario farm financial analysis data.


 EN
EN