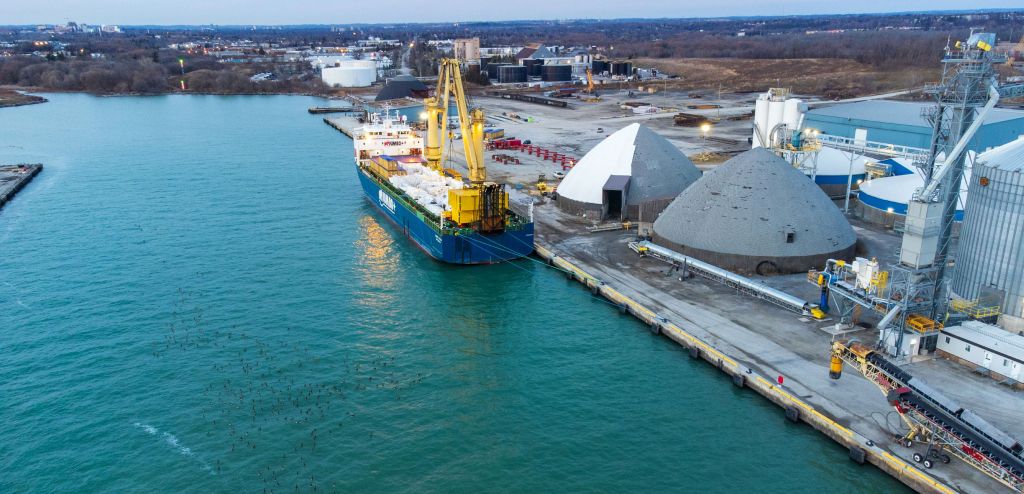
Despite recent crop and export volume hitting records, a key risk to the Canadian grain sector is its ability to move its products to overseas markets efficiently and reliably. Infrastructure—particularly rail networks and port terminals—isn’t keeping pace with the growth of bulk commodities like wheat and canola. The risks of disruption leaves money on the table for farmers and limits investment and business opportunities—all while Canada seeks to diversify and expand its trade.

Targeted infrastructure investments can mitigate the risks of disruption and congestion, but that requires agriculture to receive the same focus as other critical sectors in the nation’s conversation about competitiveness and growth. 

Export Development Canada notes that the country’s infrastructure investment trails many OECD peers, and the ratio of infrastructure investments to trade volumes has been falling.1 Canada has an overall infrastructure deficit ranging from between $110 billion to $270 billion,2 and investments for railways and seaports needed by 2070 are estimated at $284 billion and $110 billion, respectively.3

  • The agriculture and agri-food sector contributes more than $150 billion to GDP and supports 2.3 million jobs. It is export-dependent, sending more than $100 billion in agriculture products to international markets, making it the 9th largest globally.4

  • The ranking follows a decades-long story of crop productivity gains, both in efficiency and absolute terms. Since 2000, Canadian wheat production has grown by an annual average of 3.9%, and canola yields by annual average 3.4%, meaning farmers are getting more output from the same area of land.5


  • The U.S. accounts for more than 60% of Canada’s agri-food exports1. As Canada looks to become less reliant on a single customer across all sectors, more agri-food export sales will have to come from overseas markets in Asia and Europe, with commodities primarily shipping through the west coast.

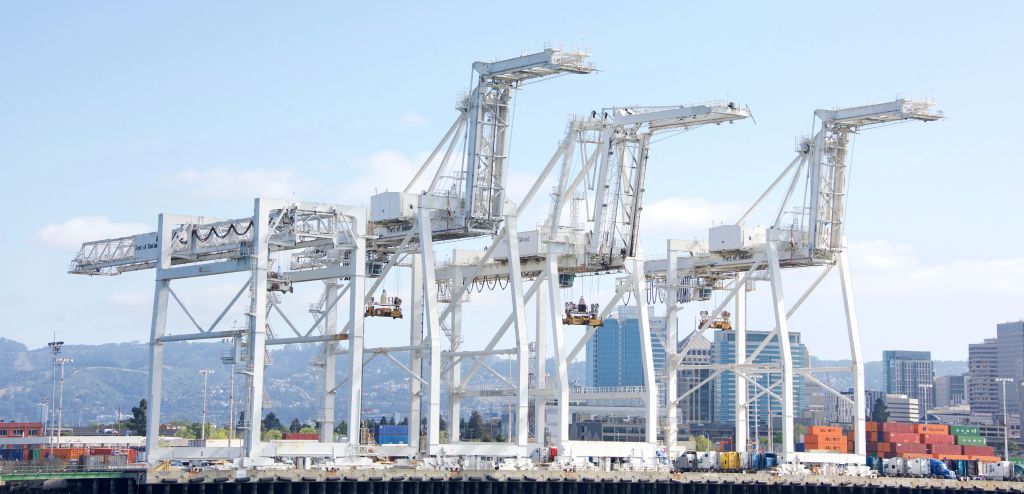
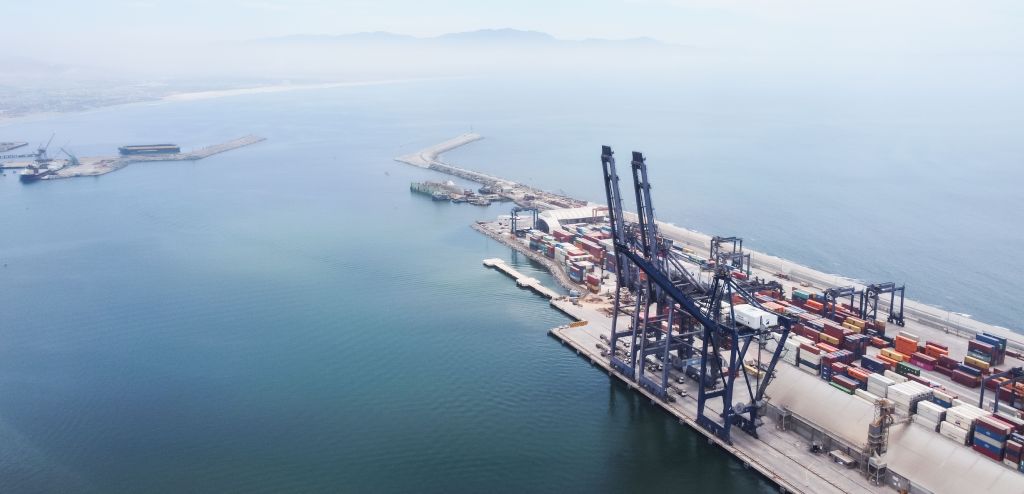
  • The Port of Vancouver moved a record 170 million metric tons of cargo in 2025, 30 million of which were bulk grains. Prince Rupert is also a growing western alternative corridor, handling 26 million metric tons of goods in 2025, up 14% from the year prior.6

Canada’s port and rail network is strained with several bottlenecks, with a history of disruptions:  

  • The 57-year-old Second Narrows Rail Bridge is the crossing for 50% of the country’s grain production that moves through the port, and nearly a third of all cargo. It is the key rail path to the North Shore terminal for servicing grains, potash, and coal. In February 2026, the bridge was locked in its down position due to a mechanical problem, which halted ships access to the inlet for four days.  
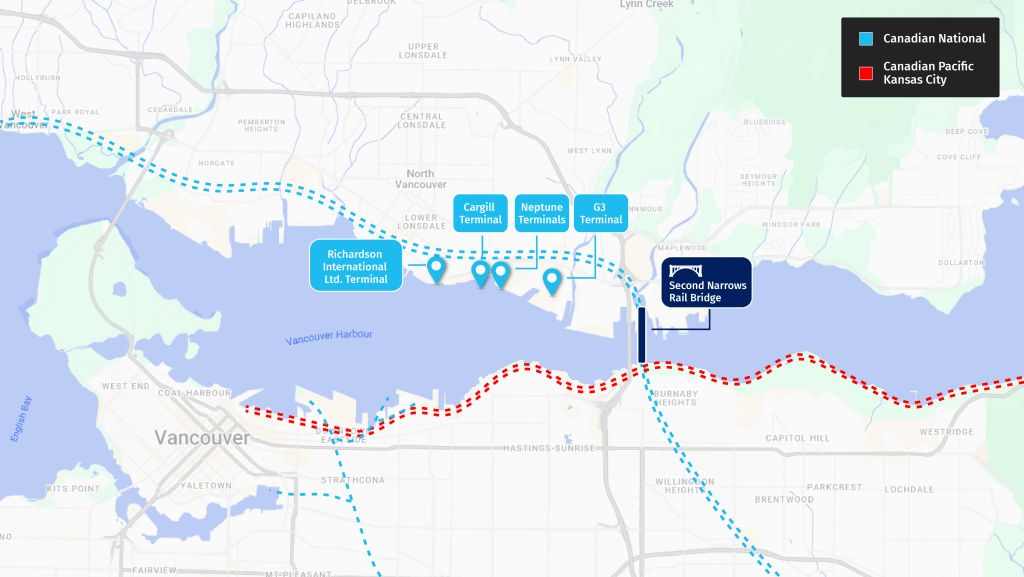
    Second Narrows Rail Bridge: Critical chokepoint connecting shipments to the Port of Vancouver's North Shore terminals operated by G3, Cargill, and Richards, as well as Neptune potash and coal terminals

    Figure 2. Second Narrows Rail Bridge: Critical chokepoint connecting shipments to the Port of Vancouver’s North Shore terminals operated by G3, Cargill, and Richards, as well as Neptune potash and coal terminals

  • U.S. ports offer alternative export terminals for some commodities, particularly potash, for several reasons—favourable labour conditions and less port congestion among them. This is leading some Canadian businesses to consider large terminal investments on U.S. shores, rather than Canada. Bulk Canadian grain has no such relief for overseas markets and moves almost exclusively through Canadian ports, creating vulnerabilities at the country’s critical choke points. 

  • Labour issues can also come into play. In 2024, a four-day Grain Workers Union strike cost the sector an estimated $35 million per day in stalled export shipments.7 These vulnerabilities lead to lower profits for farmers and more hesitation from international buyers.  

  • If a significant disruption shuts down either Canadian National Railway Company (CN) or Canadian Pacific Kansas City (CPKC) railways for a single week, the estimated economic damage to the grain industry from lost sales, contract penalties and other costs could reach $250 million8.

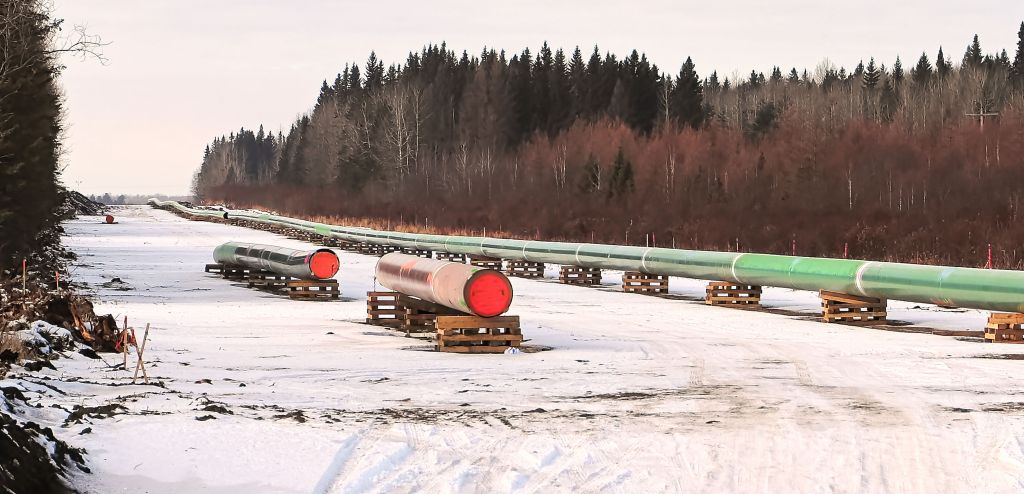
  • The federal-government owned Trans Mountain Expansion Pipeline shows how new infrastructure investments in one sector can relieve pressure for another. When the oil pipeline capacity grew to 890,000 barrels per day, Canadian crude-by-rail dropped to the lowest levels since 2012,9 freeing up capacity for Western grains, pulses, and oilseeds, and other commodities. 

  • Investments like DP’s World’s Port Authority Rail Yard project ⁠at the Fraser Surrey Terminal in Surrey, British Columbia, aim to improve handling capacity and efficiency for agricultural exports. The newly announced Canada-British Columbia Cooperative Prosperity Agreement includes $10 billion in federal funding to upgrade the Roberts Bank Terminal 2 in Delta, B.C., along with other potential investments at the Prince Rupert port, further north of the province. (For more on this topic, listen to the Disruptors podcast discussing the Roberts Bank Terminal 2 expansion). 

  • Other efficiency enhancements underway at the Port of Vancouver include the port’s new Active Vessel Traffic Management Program (AVTM) and a centralized scheduling system, which coordinate bridge lifts and vessel movements with train scheduling and reduce delays10. Improving methods for loading grain in the rain, which can halt loading between 30-60 days a year, can also increase port turnaround times. 

Recent years have shown where Canada’s transport system is fragile. The rail and port infrastructure decisions made over the next few years will influence how gains in productivity translate into stronger export growth, and whether the country’s supply chains stay anchored in Canada. Addressing these acute risks should be core to Canada’s nation-building conversation, and large capital investments are needed alongside supply chain efficiency improvements. Farmers have done their part to boost production—the systems moving the output need to keep up. 

As debate continues over the costs of building Alberta’s proposed West Coast Oil Pipeline (WCOP), there is a question of how Canadian heavy crude can compete with the Persian Gulf and ever-rising Venezuelan grades that already serve the Asian market. There are several key elements that need to hold for the economics of the proposed pipeline to work—and none are guaranteed.

A Canadian barrel costs roughly twice what a Gulf barrel costs to land at the same refinery—the arithmetic of being 1,200 kilometres from tidewater. On delivered cost alone, any case for the pipeline must explain what offsets a gap that wide.

A Competitive Oil Market

Heavy sour crude delivered to Northeast Asia (C$/per barrel)

WCSArab HeavyMerey
Delivered costs (C$/b)(CA)(Gulf)(VZ)
Field to tidewater$9-$11$2-$3$4-$6
Freight to NE Asia$4-$6$3-$4$4-$5
Delivered, all-in cost$13-$17$5-$7$8-$11

Notes: Persian Gulf and Venezuelan field-to-tidewater costs are RBC Thought Leadership estimates. Western Canadian Select (WCS) costs are modelled off Trans Mountain’s shipping costs to China from its Westridge Marine Terminal.  Freight rates are mid-cycle estimates.

The new pipeline does not need to follow the same path that unfolded for the Trans Mountain Expansion Project (TMX), i.e., cost overruns that were part passed onto shippers.

Pipeline Economics

West Coast Oil Pipeline (WCOP) vs. Trans Mountain (TMX) financial metrics

WCOPWCOPTMX
Pipeline Metrics (C$)LowHighActual
Capacity, 000 bpd1,0001,000890
Capital cost, $ billion$35.2$43.7$35.3
Capital cost, $ per bpd$35,200$43,700$59,831
Pipeline toll, $/bTBDTBD$9-$11
Freight to Asia, $/b$2-$3$2-$3$4-$6

Notes: The TMX toll reflects the revised rates as disclosed in the July 7 submission to the Canada Energy Regulator ($9.20-$11.05 per barrel). The TMX capital cost per barrel is calculated based on expansion volumes only (590,000 bpd). Freight rates are mid-cycle (normalized). All dollar figures are quoted in Canadian dollars.

The West Coast Oil Pipeline’s transportation costs should hopefully be less expensive than TMX, given the use of a larger line along a ‘de-risked’ corridor, and loading supertankers (Very Large Crude Carriers) directly rather than the mid-sized Aframaxes. The challenge would be to keep the project on budget. The $35-$44 billion estimated price tag for the project excludes escalation and financing—key concerns from a competitiveness standpoint.

Western Canadian Select (WCS) trades well under global benchmarks, much of it due to captivity (as it’s one and only market is the U.S.) rather than quality. While a cheaper price improves competitiveness (buyers get a similar barrel for less cost), it is less than ideal for producers and getting oil to tidewater lets the barrel escape this structural disadvantage. The Alberta government estimates WCOP could narrow the price gap between WCS and the U.S. benchmark West Texas Intermediate by up to US$3 per barrel. For reference, WCS has historically traded at a US$10-15 discount to WTI, but has at times gone in excess of US$20 per barrel.

Buyers are hoping Canadian crude is more reliable. Cheap Persian Gulf barrels carry a Strait of Hormuz risk, while Venezuelan barrels are dependent upon an extended economic reconstruction. Canada’s oil carries neither risk, with Asian buyers willing to pay for that security.

Producer commitments are less a question of Asian demand—TMX’s fill rate suggests the demand is clearly there, but cost overrun concerns need to be alleviated to ensure the West Coast project’s competitiveness.

The trade case rests on several conditions: the project is built on time and on budget, with a discount that is more structural in nature rather than subject to periodic events, and a reliability premium outlast recent disruptions. If these conditions hold, the prize is significant: roughly $20 billion in incremental annual exports (based on 1 million barrels per day at 90% utilization, and a WCS price of $60 per barrel), along with a potential US$3-per-barrel tightening in a spread across future bitumen production of between 4.5 and 5 million barrels per day by 2035, worth about $5 billion annually. Whether Canada should make this bet with public money is a fiscal judgment, particularly given the country’s recent history with pipeline development, but one that seems increasingly likely with each passing day.

–By Shaz Merwat, Energy Policy Lead

RBC brought together more than 500 business, government and policy leaders last month for the U.S.-Canada Summit, in partnership with the Eurasia Group. Ministers, governors, ambassadors, economists, investors—and an astronaut—gathered in one room to talk about the future of the world’s most prosperous relationship.

Donald Trump threatens to cut off trade to Spain

  • The U.S. President issued the threat over the European country’s refusal to increase defence spending to 5% of GDP by 2035. The U.S. administration is now preparing a list of Spanish goods to potentially embargo.

Canada tells the UAE it’s not ready for an inflow of cash

  • The federal government’s Major Projects Office told an official UAE delegation that it was too soon to inject billions of dollars into Canada, as projects are still in early stages. Prime Minister Mark Carney landed a $70 billion investment commitment from the UAE last year, but that capital has yet to be deployed.

Brussels launches probe into imports of Chinese duck

  • The European Commission has launched an anti-dumping investigation targeting Chinese Pekin duck, the breed used to make the iconic Peking duck dish. The latest dispute highlights growing trade tensions between the EU and China.

Global trade and economic groups warn of uncertainty

  • The heads of major global organizations—the International Energy Agency (IEA), International Monetary Fund (IMF), World Bank Group (WBG) and World Trade Organization (WTO)—met to discuss the impact of the war in the Middle East. While they noted that the global economy has been “broadly resilient,” they warned that uncertainty remains high and that the impacts of the war may linger.

U.S. trade deficit widens, as does Canada’s surplus

  • The U.S. trade deficit increased sharply in May, ballooning to a 14-month high despite tariffs on imports. Canada, meanwhile, saw its trade surplus widen to a four-year high in May, with exports of metals and energy increasing during the war in the Middle East.

U.S. President Donald Trump’s refusal to renew the Canada-United States-Mexico (CUSMA) agreement by the July 1st deadline came as no surprise. But it did usher in a new era for the agreement, one that will include more talks—and even more uncertainty.

What does the no deal by the deadline really mean?

  • For starters, the deal is not dead: The agreement will require annual reviews for the next decade. So little changes in the near term, as tariff carve outs for Canadian and Mexican goods that comply with CUSMA remain in place. If, however, the three parties do not reach an extension agreement by 2036, the deal expires.

  • Will the U.S. withdraw before then? Trump has threatened to do so. But he would need to provide six-months written notice—and, according to the U.S. Senate’s finance committee, requires approval from Congress. As our colleagues in RBC Economics pointed out in their latest report, “We continue to view outright termination of CUSMA as unlikely if economic reasoning holds. Exporters/importers on both sides of the border have a strong incentive to maintain the deal.”

  • What about side deals? The U.S. is expected to push for separate “protocols” with Canada and Mexico. Canada-U.S. Trade Minister Dominic LeBlanc said his government is open to this path.

The roadblocks:

The U.S. has a long list of irritants, outlined in the 2026 National Trade Estimate report released by the U.S. Trade Representative (USTR) earlier this year. That includes a few often-cited issues—Canada’s supply management system; a lack of market access for American wine, beer and spirits; and the federal government’s Buy Canadian policy.

But that’s not all:

  • Improved access to Alberta’s power market: The USTR believes there’s been little progress in improving points of access to Alberta’s energy market for Montana energy producers, and that equally priced power generated in Montana is being deprioritized to benefit Alberta power producers.

  • Aircraft regulatory approvals take too long: The U.S. said stakeholders raised concerns about the regulatory process and timelines associated with aircraft validation in Canada.

  • ‘Cumbersome’ seed regulations: Canada’s system for importing of seeds, claims the USTR, is “slow and cumbersome and disadvantages U.S. seed and grain exports to Canada.”

  • A lack of IP protection: The USTR put Canada on its Watch List for intellectual property protection and enforcement. It also flagged the poor enforcement of counterfeit or pirated goods at the border and within Canada as a concern, referring specifically to the Pacific Mall in Toronto.

What’s next:

  • Negotiations will continue through the summer: The U.S. is meeting with Mexico the week of July 20 for a third round of bilateral negotiations. Mexico may be willing to make concessions, as Claudia Sheinbaum’s government has made the U.S. its top trade priority. Washington and Ottawa have yet to start negotiations.

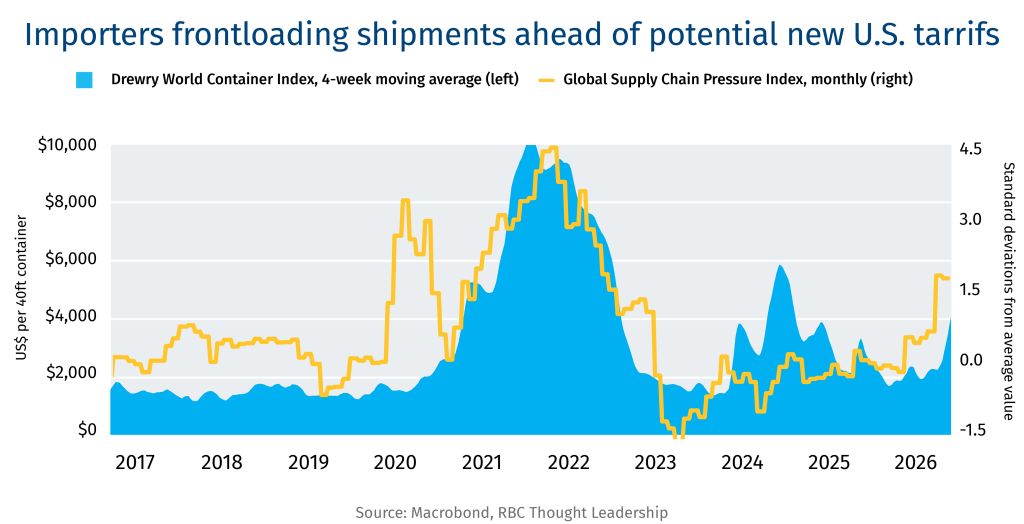
  • Another deadline looms: Section 122 tariffs will expire on July 24 unless Congress extends them, which is unlikely. It’s expected that the Trump administration will instead introduce a new set of tariffs. That’s already spurred an increase in shipping—and shipping rates—as businesses try to get ahead of a fresh batch of tariffs.

    Importers frontloaidng shipments ahead of potential new U.S. tarrifs
  • Investment uncertainty will dominate: Although the agreement is still in place, the annual reviews will prolong the business uncertainty that is already weighing on investment. Without clarity, businesses are likely to hold off on making critical long-term investment decisions. As Mexico’s economic minister Marcelo Ebrard recently said, “if you drag us into a constant review process, you’re going to choke off investment.”

The urgency to feed 10 billion people by 2050 has long been a central concern in agri-food research and policy. But with fertility rates down and global populations beginning to stabilize, a new S&P Global Energy study reframes the long-term question for the ag sector: what if supply outpaces demand?

For certain crop commodities, the rate of demand growth is predicted to slow through 2050, with feed crops especially exposed as growth in per capita meat consumption decelerates toward 0.1% annually.

Meanwhile, crop yields and food production continue to increase. That story rings true for Canada, which has boosted its yields and overall production of most crops considerably since the turn of the millennium. For instance, between 2000 and 2012 annual wheat production did not exceed 30 million tonnes, but had reached nearly 40 million in 2025.

Type of cropAverage annual yield growth (percent), 2000-2025
Canola (rapeseed)3.4
Corn for grain2.1
Wheat, all types3.0
Barley3.3

Source: Statistics Canada. Table 32-10-0359-01  Estimated areas, yield, production, average farm price and total farm value of principal field crops, in metric and imperial units

If such annual yield increases continue from 2026 to 2050 — and seeded acres remain constant —wheat and canola output would grow by tens of million tonnes.

Although an absolute reduction in food consumption is not expected, when slowing population growth contrasts with continued gains in ag outputs, a gap could pose structural challenges for the export market’s long-term health and profitability. Rising demand for biofuels and alternative markets may take some of that surplus, but Canada will need to continue enhancing its efficiency while working to differentiate itself from other major crop exporting countries. Emphasizing the quality of Canada’s exports and its dependability as a trade partner can help preserve its reputation as a preferred supplier.


Contributors: Alicja Siekierska, Farhad Panahov, Wilson Fink

Also in this edition: 10 numbers that define Brexit’s impact on the U.K. 10 years later 

Expertise, not electrons, could be Canada’s critical energy export 

  • Ottawa’s electricity trade debate keeps circling east-west interties and cross-border electricity flows, but Canadian expertise could be an understated export asset. One such example, called out during Canada’s National Electricity Summit in Ottawa this week, was Manitoba Hydro International (revived in 2024 by the provincial utility following a three-year closure), which started selling Canadian utility expertise to more than 120 clients around the world in 1998. 

Canada needs to remove barriers to trade and to investment 

  • A big takeaway from a C.D. Howe Institute roundtable this week was that while trade diversification is important, lowering barriers to foreign investment is just as urgent. Holistically reforming the country’s corporate income tax system was one of the ideas that was floated.  

Next week, North America will cross a threshold in the Canada-U.S.-Mexico trade relationship.  

It’s not a cliff, but it will start a new chapter in what has been the world’s most successful trade pact. 

To assess what may come next, RBC’s John Stackhouse joined a Brookings Institution virtual roundtable this week, with policy thinkers from all three countries. One thing seemed certain: no matter how a revised CUSMA looks, the spirit of North American trade is likely to bring more elbows and fewer handshakes. 

Some other takeaways: 

1. There will be a deal: “Reason for optimism” was a refrain, although the costs of that deal will be felt in all three countries. So, too, is timing, especially if negotiations continue after the U.S. mid-terms and into a more fractious Washington.  

2. Get used to tariffs: Beyond the July 1 trigger for a CUSMA review, the current regime of Section 122 tariffs will expire on July 24, when we should expect the Trump administration to create another regime. Canadians need to think through a range of tariffs that could follow, from a “heavy hand” option of 15-25% tariffs (unlikely), to a variation of the status quo, which could carry greater border measures on digital trade. A safe bet is some form of “market access” price, perhaps in the 5% range, with plenty of exemptions. 

3. Side letters will be key: The general agreement may stay largely in place, with a host of side agreements that don’t require legislation. That can be good news, as such letters can be changed more easily than a full agreement. But that risk can also apply to safeguards that Canada and Mexico may seek in side deals.  

4. Mexico is willing to make concessions: Claudia Sheinbaum’s government—more overtly than Canada—has made the U.S. its top trade priority, and is adopting policies to align with Washington’s asks. That could include stricter rules of origin for the auto sector. Mexico is also interested in a broader framework, to address border, energy and food security  issues as well as trade. 

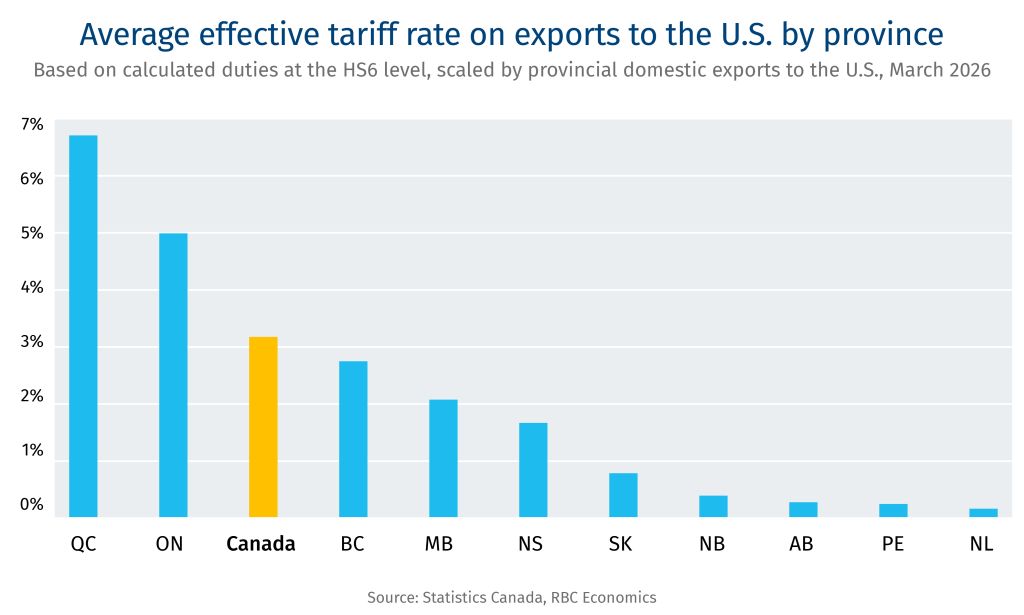
5. Canada needs to manage internal divisions: There’s no single Canadian economy when it comes to trade. The current 232 tariffs cover 36-37% of Canadian exports to the U.S.—but 58% for Ontario and 55% for Quebec. The Maritimes, Saskatchewan and Alberta face hits of less than 10%. Canadian opinion has also hardened against a deal at any cost, in part because Canadian trust in U.S. commitments has declined.  

6. Uncertainty is hurting investment and growth: In all three countries, businesses are hedging the borders, diversifying production to get ahead of new tariff and non-tariff measures. For Canada, there also may be some investments taking place to serve non-U.S. export markets, notably Europe and China.  

This week marked the 10-year anniversary of the referendum that resulted in the United Kingdom leaving the European Union. A decade after the seismic vote, the ramifications are still being calculated and realized. 

  •  14% – The decline in U.K.’s exports of goods to the EU in 2025 compared to 2019, before the two partners signed a new trade deal. During the same period, U.K. exports to non-EU countries were down 8%.   

  • 28% – The jump in U.K.’s services exports to the EU compared to 2019. Exports to non-EU countries were up 26% from 2019. However, the Centre for European Reform estimates that service exports are still 7% lower than they would have been if the U.K. had stayed in the EU. 

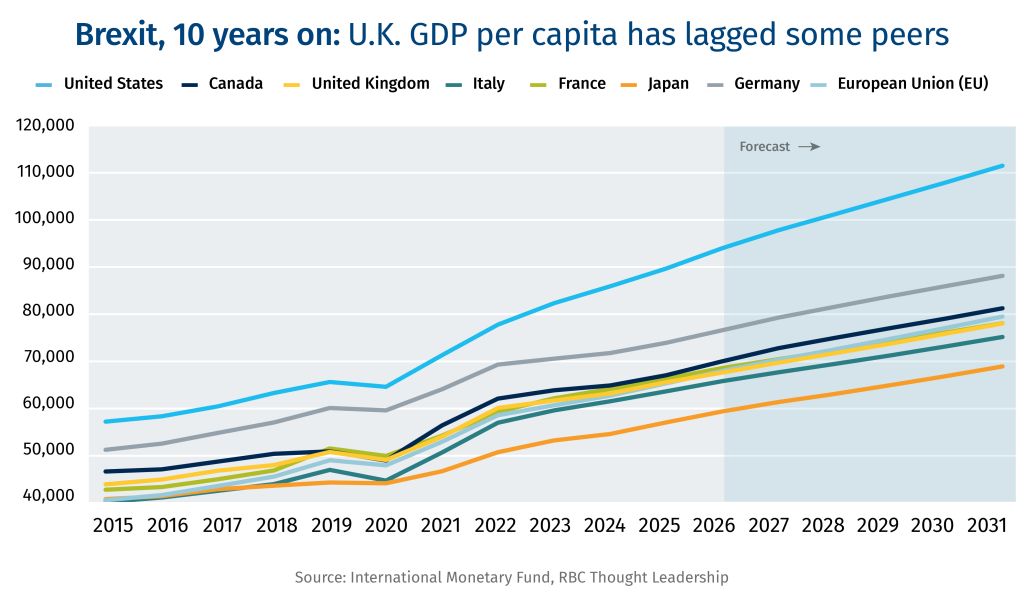
  • ↓  6-8% – The decline in the U.K.’s GDP growth by the end of 2025 due to Brexit, according to a study from the National Bureau of Economic Research.  


    Brexit, 10 years on: U.K. GDP per capita has lagged some peers

  •   5-10% – The U.K.’s GDP per capita growth was between 5% and 10% less than other similar countries between Brexit and the end of 2025, NBER also estimates.

  • ↓  13% – The decline in the U.K. business investment. Another study suggested U.K. firms invest just 11.1% cent of GDP, with only Canada lower in the G7.

  • 16% – The share of businesses reporting that Brexit was an important source of uncertainty as of Sept. 2025. It was as high as 40% shortly after the U.K. left the EU. 

  • 39 – The number of trade deals Britain has signed covering 72 countries since Brexit. Still, while the U.K.’s trading relationship with the EU fundamentally changed post-Brexit, the bloc remains the U.K’s largest trading partner.  


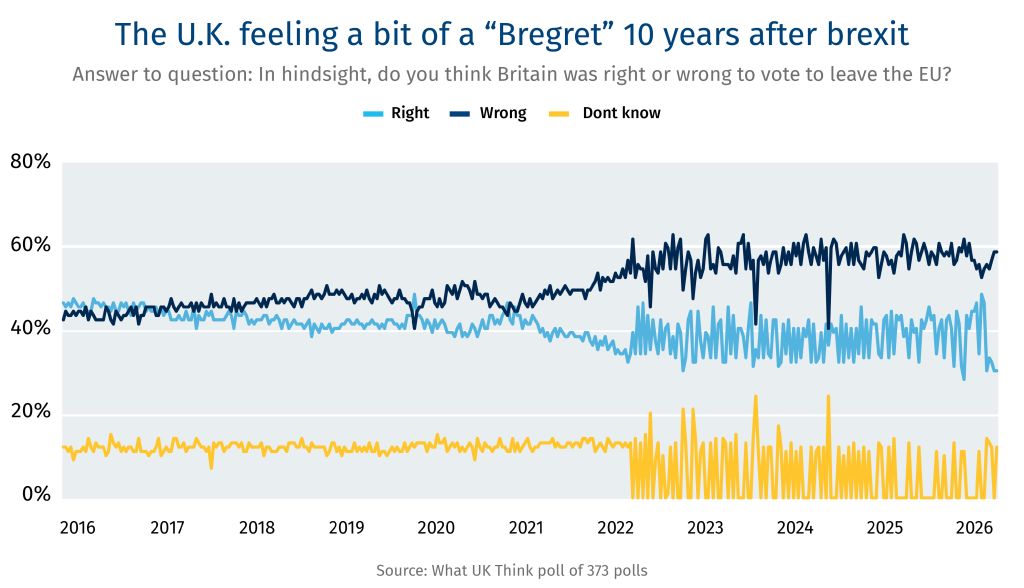
    The U.K. feeling a bit of "Bregret" 10 years after Brexit - chart

  • 57% – Of respondents said Britain was wrong to leave the EU in a recent poll.  

  • 41% – The EU accounted for 41% of the U.K.’s exports, and 50% of the U.K.’s imports.  

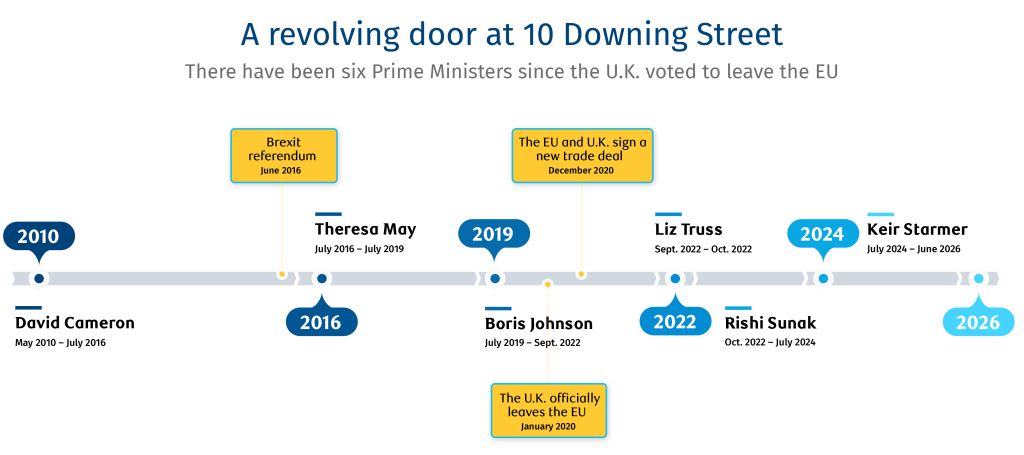
  • – The number of Prime Ministers the U.K. has had since the referendum. Former Greater Manchester major Andy Burnham is expected to become the seventh PM since Brexit. 


    A revolving door at 10 downing street

U.S.-Mexico trade talks have worsened over security issues  

  • While talks between the U.S. and Mexico appear to be progressing, impasses have surfaced over security concerns, particularly extraterritorial U.S. operations to combat drug cartels.  

Chinese EVs remain a major irritant for the U.S. in trade talks with Canada 

  • It was no mistake that Prime Minister Mark Carney used his moment with President Donald Trump at the G7 Summit to explain the cap on the deal. Behind closed doors, a group of American policymakers remain highly concerned about the entry of China into strategic areas of the North American economy.  

Government continues to align foreign and trade policies 

  • Foreign Minister Anita Anand will take Türkiye’s foreign minister to a nuclear SMR facility in Darlington next week. Another sign that energy is increasingly a pillar of foreign policy.  

How energy markets could shape up post-Hormuz 

While hostilities between Iran and the U.S. appear to be subsiding, the re-opening of the Strait of Hormuz will continue to shape trade flows in the days, months, and years ahead. 

Why it matters—an MoU is signed, but the Strait isn’t solved 

The Washington-Tehran memorandum of understanding guarantees toll-free passage for 60 days only, followed by negotiations with Oman to define the future administration of the waterway. 

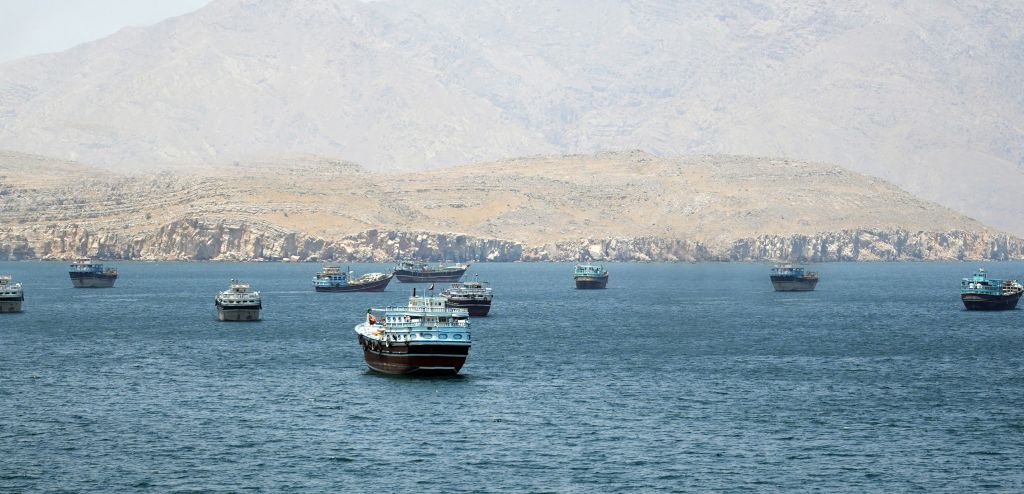
The Red Sea serves as a cautionary tale. In July 2024, a deal was struck with the Houthis, and Bab el-Mandeb Strait traffic—in the Arabian Peninsula—has not returned to early 2024 levels. Reopening of the Hormuz will be a difficult logistical process regardless of when it starts; with more than 500 vessels stranded in the Persian Gulf, mines to clear, and insurers to convince. Peak Hormuz flows may be behind us. “The vase is broken,” said IEA Executive Director Fatih Birol. “Now all actors know that the Strait of Hormuz was closed once and it can be shut down again.” 

By the numbers — resilience, and its limits 

The oil market proved more resilient than most forecasts. Brent peaked at roughly US$126 per barrel—a significant shock, but far below the US$200 worst-case scenarios circulated at the height of the crisis.  

The reason was adaptation, with a parallel logistics system emerging in real time. 

  • U.S. crude exports surged to more than 6 million barrels per day (bpd) 

  • Dark-tanker transits climbed to roughly 3 million bpd by early June, with cargoes shuttled by ship-to-ship transfer in the Gulf of Oman  

  • Alternative Saudi and UAE pipelines absorbed what they could, which was meaningful even though short of pre-crisis Hormuz volumes 

  • Kpler estimates more than 90 million barrels of non-Iranian crude and a further 70 million barrels of Iranian crude are now waiting to leave the region—a significant near-term overhang as the Strait reopens. 

But even resilience has a limit, and it is grade. Asian refiners, built for heavy sour Middle Eastern crude, spent the quarter force-feeding light sweet American barrels as a stopgap. The Hormuz gap was more around heavy oil and LNG shipments. 

The bigger picture—buyers won’t unlearn concentration risk 

Concerns are shifting to a near-term supply glut as trapped Gulf barrels flood the market. The IEA expects a significant crude overhang by 2027 if peace holds. Still, a key learning is that oil markets remain remarkably resilient. When the system was under genuine stress, it adapted through shadow infrastructure, bypass routing, and emergency substitution. Some of this was ad-hoc, but some was planned years, if not decades, ago (such as Chinese strategic reserves, and the Saudi East-West pipeline).  

These themes were discussed at RBC’s Global Energy, Power and Infrastructure Conference in New York this month, where access to global markets was the biggest topic among Canadian producers and importers—with buyers in Asia, and one in Germany cited as anchors for Canadian LNG projects in both the Atlantic and Pacific basins. Importing nations are chasing supply security and portfolio diversification, with a willingness to sew up new contracts running well ahead of the industry’s willingness to sanction new supply. 

Bottom line — a ceasefire changes the headline, not the lesson 

Canada, with one proposed cross-border crude pipeline targeting a mid-2027 final investment decision, TMX volumes already moving west, and West Coast LNG coming online, has meaningful volumes in the near to mid-term. The market will watch the Strait, but the next generation of trade will come from future agreements, which could increasingly include Canada. 

Shaz Merwat, Energy Policy Lead 

New research out of Purdue University illustrates the benefits to food prices of the trade deal now known as the United States-Canada-Mexico agreement and the costs if its dismantled. The USMCA Affordability Study: The Effect of North American Trade on U.S. Food Prices aims to quantify the effect of North American free trade agreements on U.S. food prices, and outlines a scenario where NAFTA was not implemented and historical tariff rates remained fixed. It concludes: 

  • For every percentage point in reduced tariff rates, there was a cumulative food price reduction of 2.8% over a 10-year period.  

  • Food prices were 12% lower by 2014 than they would have been in the no-NAFTA scenario, saving average households at the time approximately US$500 a year. 

  • Reversing the trade agreements would unwind those gains. And since U.S. agri-food imports from Canada and Mexico have grown significantly since the studied period, American consumers could be hit with much higher grocery bills at a time when budgets are already strained.  

Following the tariff reductions, key U.S. export commodities such as wheat, corn, and beef products did not see a rise in domestic prices that stronger export demand would normally predict. This is suggestive of how interconnected the North American food supply chains have become. 

Food affordability is already weighing heavily on household budgets in Canada and the U.S. New tariffs or trade restrictions emerging out of the upcoming negotiations could undo decades of food supply chain integrations and deepen pressure on consumers. 

Wilson Fink, Agriculture Policy Lead 

On the hunt for domestic investment, Mélanie Joly was in China this week pressing Chinese automakers to build in Canada, not just sell. Shoring up investment in Canada’s battered auto industry is necessary, but there are multiple crises on the horizon.   

Trapped between two auto giants 

Canada is in a tight squeeze in CUSMA negotiations. Section 232 tariffs aim to make Canadian assembly too expensive, threatening one of Canada’s largest export industries unless removed. Meanwhile, China eyes Canada as its North American beachhead—BYD already secured quota approval, with Chery and Geely racing for their slice of the 49,000-unit imports. 

The dynamics are stark: China wants Canadian consumers, America wants Canadian assembly jobs. Canada’s 125,000-strong auto workforce is caught in the crosshairs. 

But here’s what everyone’s missing in this tug-of-war: while Canada struggles to secure its share of North American assembly, rising vehicle prices are pushing more consumers out of the new vehicle market altogether, compressing demand while the global auto industry is facing over-capacity issues.  

The affordability trap no one’s watching

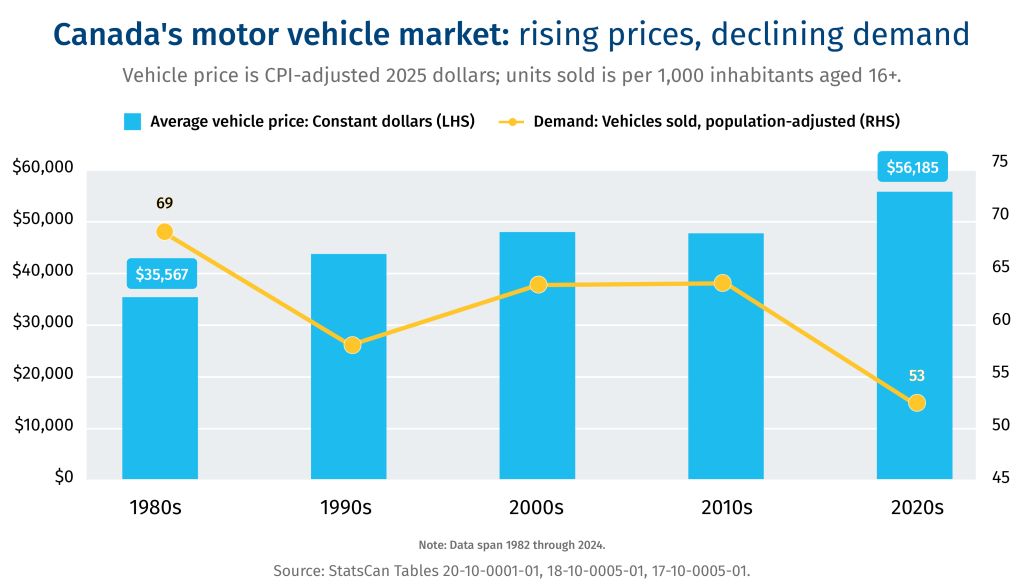
Canada's motor vehicle market: rising prices, declining demand

Vehicle prices have structural headwinds that make tariffs particularly dangerous. SUVs and pickups, which are more expensive than sedans and compact vehicles, already dominate sales. Ever-more tech features also pump up the price tag. When we layer tariffs on vehicles, steel, and aluminum, affordability doesn’t just suffer—it tanks. 

The Canadian numbers illustrate the trend: 1.92 million new vehicles sold in 2024, down 160,000 units from 2017 despite 4.3 million more driving-age residents in Canada. Population-adjusted sales have collapsed more than 20% since the 1980s while average vehicle prices have cruised 60% higher after inflation.  

The pattern repeats stateside—there are 20 million more Americans today than 10 years ago, but vehicle sales fell from 17.4 million units in 2015 to 16.4 million in 2025. As the price of vehicles rise, buyers will be pushed into the resale market.  

Bottom line 

Higher prices don’t just hurt consumers—they kill the very jobs these policies aim to protect. Fewer purchases mean reduced demand, worsening oversupply, and ultimately eliminating assembly positions across North America.  

(For more on North America’s auto industry, read our latest report: Steering Through Uncertainty

Jordan Brennan, Managing Director, RBC Thought Leadership

Also in this edition: Breaking down six under-the-radar trade themes and a deep dive on four strategically significant industries that could drive U.S.-Canada relationship going forward

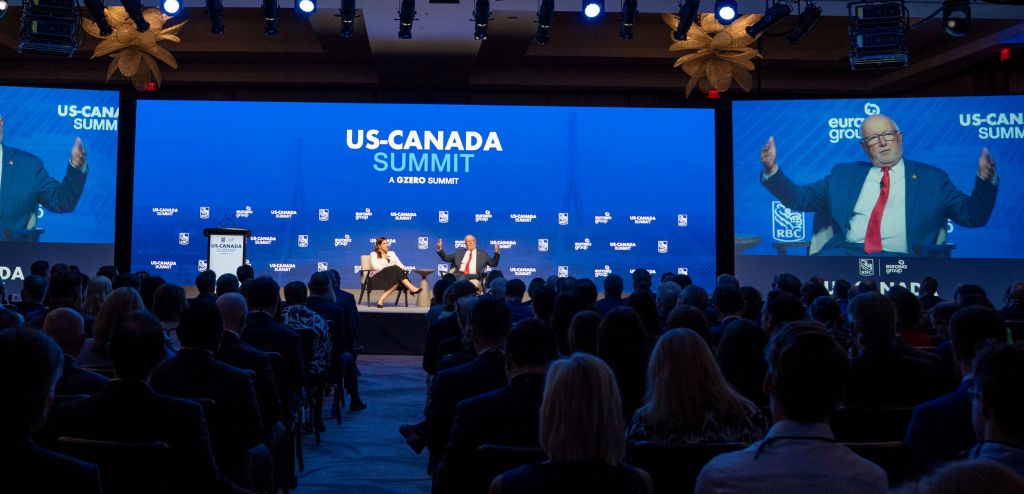
With the CUSMA deadline looming and rhetoric heating up (“We don’t need anything Canada has,” President Donald Trump told reporters earlier this week) more than 300 senior business and government leaders from both sides of the border gathered in Toronto for the RBC and Eurasia Group’s US-Canada Summit.

Here are some highlights:

  • Robert Lighthizer, the 18th United States Trade Representative, argued why 50 years of trade deficits left the U.S. no choice but to impose tariffs. And why, despite not being the worst offender, Canada was a target. In a democratic political system, a government doesn’t have years to address an issue, he said. It needs to act quickly. As for where things go with tariffs from here, Lighthizer didn’t mince words: “Nobody here has a grandchild in whose lifetime America is going to be free trade.”

  • Regardless, it’s up to Canada to put on its “sales hat” said Pete Hoekstra. Though the U.S. Ambassador to Canada said potash is about the only thing the U.S. needs from Canada, the U.S. is open to offers. Hoekstra pointed to autos and oil, and even offered some points to help make Canada’s case: the countries have similar pay scales, labour standards, and a thoroughly integrated ecosystem.

  • “America First doesn’t mean America Alone,” said Mark Wiseman, Canada’s Ambassador to the U.S., who added that Canadians are not always good at reminding Americans about the importance of Canada. Remind them of what exactly? For starters: Canada is the largest buyer of U.S. cars, outside the U.S. The No. 1 export market for 30 states. And in the top 3 for almost every state. And Canadians, on per capita basis, buy 40x more American goods than the EU, China and India.

  • Dominic LeBlanc, Minister for Canada-U.S. Trade, noted that the Canadian government has put some proposals forward to the Trump administration—but is also building a Canadian economy that is strong and resilient. Canada is not an “idle spectator.”

  • Wiseman, along with Michael Sabia, the Clerk of the Privy Council and Secretary to the Cabinet, were clear that the government’s diversification efforts do not equate to decoupling from its largest trade partner. It’s ‘and’ not ‘or’. A stronger Canada, they both noted, is a stronger partner for the U.S.

  • Hoekstra didn’t disagree, noting that if Canada is a rich country, maybe a few of those dollars could flow south—maybe to Michigan (“in the summer”), Florida and Arizona. He also joked about Kentucky bourbon, which has been removed by several provinces amid the trade war: “If you need some, I’ll see that you get some.”

After decades of economic co-operation comes a trade shock from the U.S. side. In a report in the runup to the U.S.-Canada Summit, Frances Donald, Senior Vice President and Chief Economist at RBC Economics, notes that the bruised U.S.-Canada ties have uncovered several under-the-radar trade themes. Here are a few worth highlighting:

  • Global trade growth rate doubled without the U.S. Rather than break the global economy, the rest of the world is re-orienting around the U.S. market.

  • The year of Canada’s trade divergence. Higher gold prices helped Canada boost exports to other markets, even as shipments to the U.S. fell 6% in 2025.

  • Canadians have taken economic protection into their own hands. Cutting U.S. travel, boycotting American-made liquor, and seeking out domestic products showed Canadian resolve.

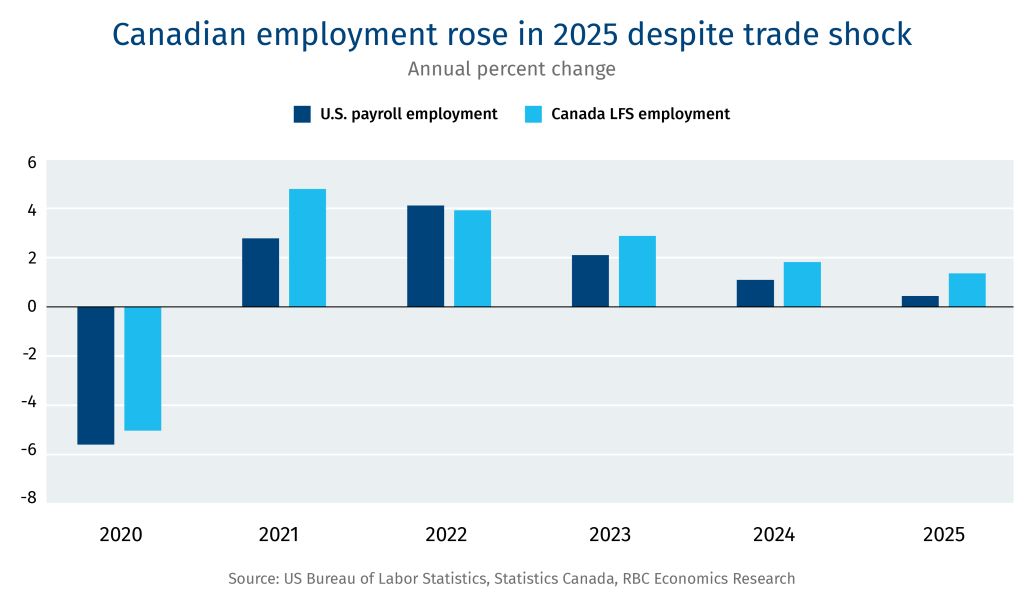
  • Canada added more jobs than the U.S. in 2025. While 68% of Canadian exports are headed for the U.S., only 12% of jobs are dependent on U.S. demand.

Canadian employment rose in 2025 despite trade shock. Annual percent change.

Read Frances Donald’s full briefing here.

It’s the world’s largest bilateral trade relationship—but it’s now under strain. Jordan Brennan, RBC Thought Leadership’s Managing Director, identified four strategically significant industries, which could drive U.S.-Canada relationship going forward.

Auto Manufacturing: Build on the already-integrated nature of the industry by harnessing Canadian clean power, aluminum, and critical minerals with American capital markets, OEM headquarters, and consumer demand.

Critical Minerals: Tie Canadian geology and mining with American financing and manufacturing demand, to deepen supply chain resilience and dependence on China-controlled minerals.

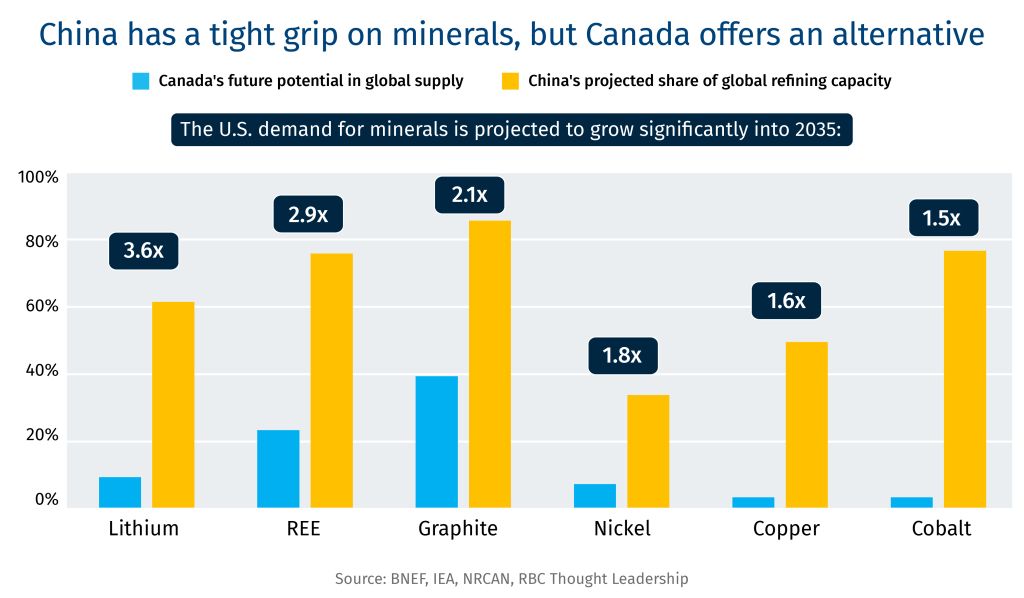
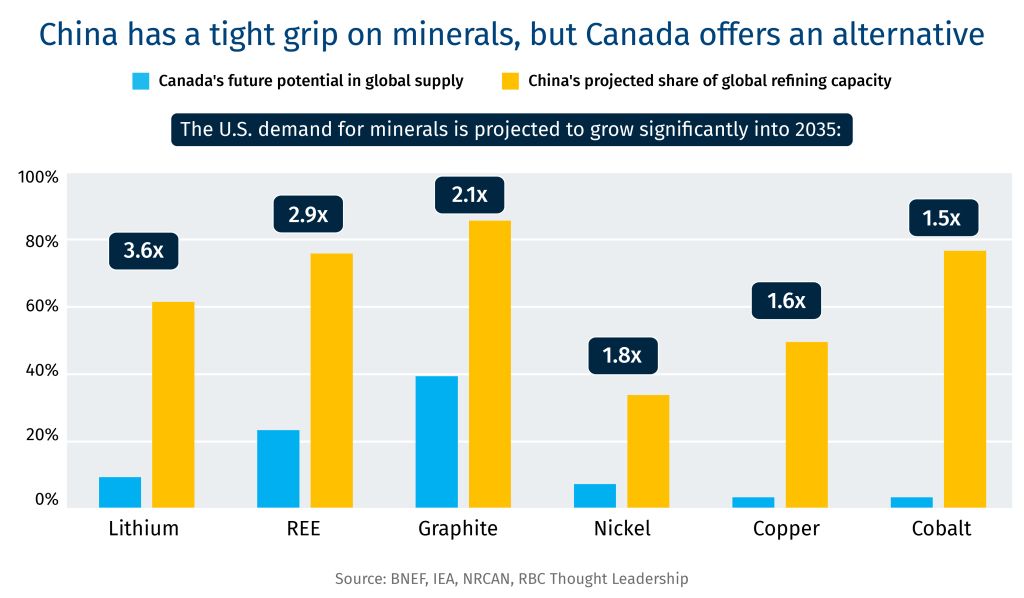
China has a tight grip on minerals, but Canada offers and alternative. The U.S. demand for minerals is projected to grow significantly into 2035.

Oil and Gas: Match Canada’s significant oil and gas resources, pipeline infrastructure, and tidewater access with U.S. refining capacity and capital markets to deliver affordable energy domestically—and to the world.

Defence: Combine American capital depth, technological sophistication, and R&D expenditure, with Canada’s geographic depth and world-class capabilities in sensors, avionics, satellite technology, and training and simulation to surveil and defend the continent.

Read Jordan Brennan’s full briefing here.

It’s more than a year into the historic U.S.-Canada trade shock, and the two economies suddenly find themselves at another nexus—the future of CUSMA, and a next chapter where precedents don’t necessarily hold. 

In some ways, it’s a moment of relief. What initially seemed like a monumental disruptive trade shock became a watered-down version of threats, and a growing list of exemptions for traded goods for many trading partners. Canada’s list has been the largest, thanks mostly to CUSMA, which makes about 90% of exports to the U.S. tariff-free. As a result, the trade schism between the two countries has been quite narrow, albeit deep.  

But there’s also hesitation. The U.S.-Canada ties seem to be bruised, not broken, but the outcome of the trade negotiations remains far from certain, and adjustments to this new relationship are still in play. Trade-related jobs have still bled on both sides of the border, and Americans are beginning to see the rise in tariff-related inflation. 

The trade war has turned out to be a slow leak—a disruption and transformation in slow motion. Slow leaks buy time to maneuver, but they can also produce some complacency. And they have a way of revealing cracks in the foundation that had been papered over before. This trade shock has uncovered under-the-radar stories about global trade, and the U.S.-Canada trade relationship. Here are six worth highlighting:  

  1. Global trade growth doubled without the U.S. 

    A big Liberation Day concern was that mass tariffs would spark a global recession, given the U.S.’s importance in the world economy. Instead, global trade, excluding the U.S., doubled, growing 4.4% year-over-year.

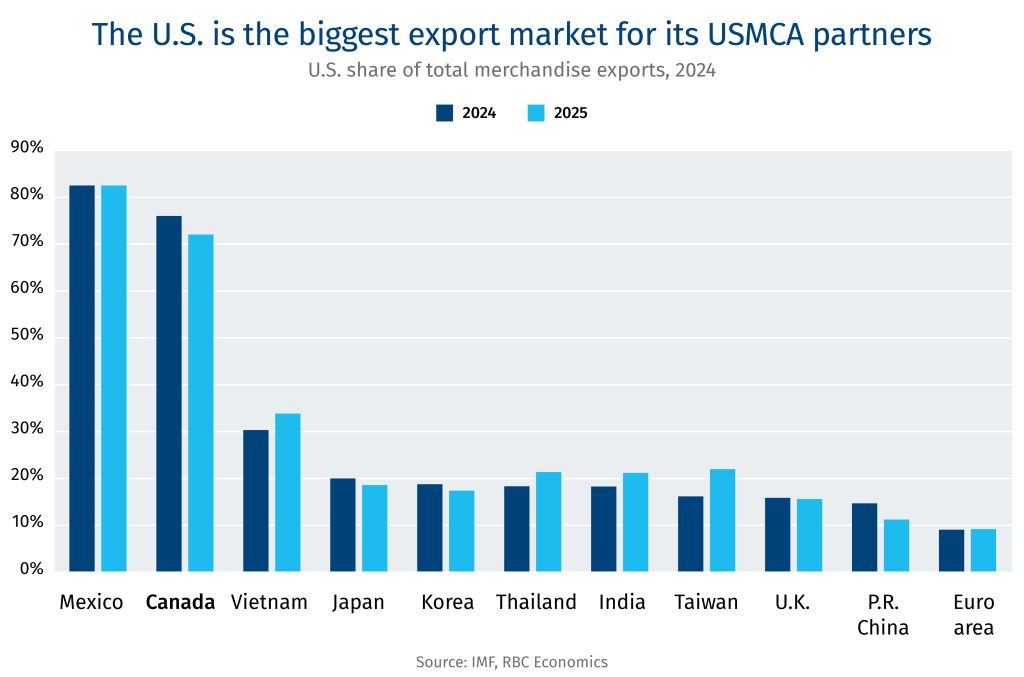
    A North American centric view of the world would, perhaps, have missed that outside of Mexico and Canada, American trade partners are far less exposed to the U.S. consumer market. Prior to 2025 tariffs, exports to the U.S. ranged from 30% in Vietnam to 15% in China, and 9% for the Euro area.

    Indeed, rather than break the global economy, the rest of the world is adapting to re-orient around the U.S. market. In a world focused on trade leverage, the jump in trade amongst global partners would suggest the U.S., perhaps, has less than initially appears. 

  2. The year of Canada’s trade divergence 

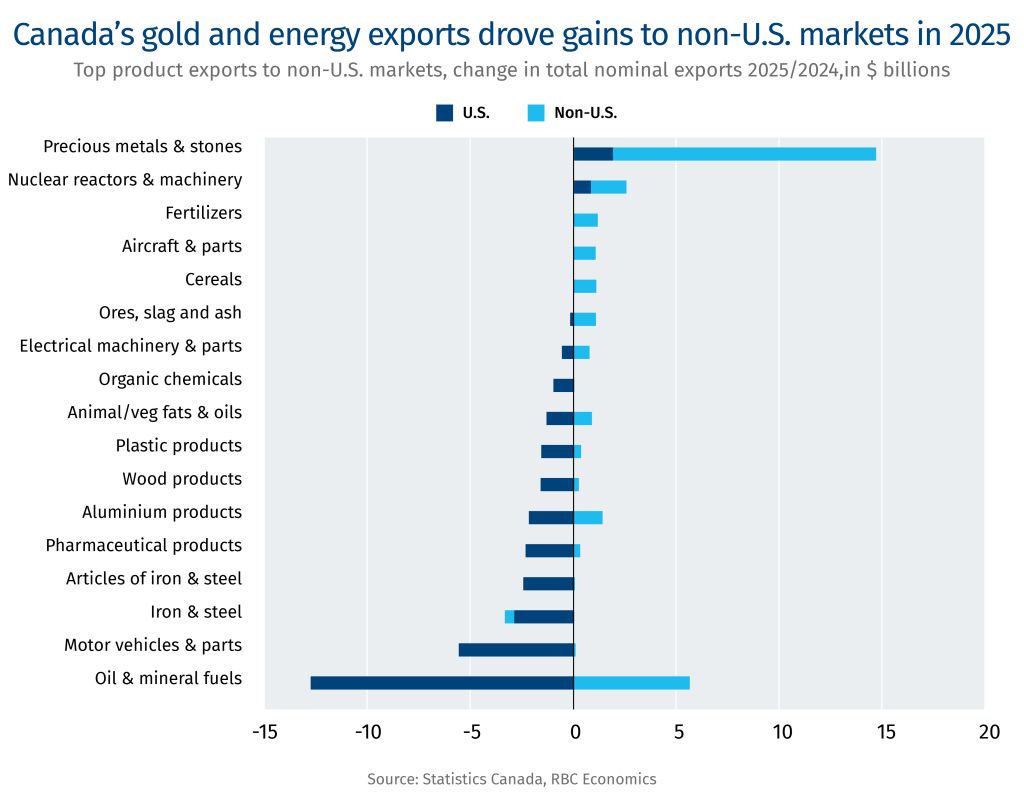
    Canada also re-oriented trade away from the U.S. in 2025—the U.S. share of total Canadian exports went from 76% in the fourth quarter of 2024 to 68% in the same period in 2025. While exports to the U.S. fell 6% year-over-year, or by about $35 billion, this was offset by a hefty $29 billion increase in exports to the rest of the world.

    Diversification didn’t come from finding new buyers for tariffed products. The increase, instead, came thanks to a surge in gold prices, which rose more than 60% in 2025. The result: gold exports to the U.K. alone spiked by $17 billion, or 76%, last year, making gold Canada’s second-largest export after crude oil. This significantly cushioned declines in other goods. 

    Gold also provided a big lift to the Canadian stock market, boosting Canadians’ financial wealth. The gold rally accounted for an estimated third of the TSX’s 28% gain and was the biggest driver behind the index outperforming the S&P 500 last year.  

  3. The U.S.-Canada trade war has been more narrowly impactful 

    Coupled with the energy shock, the trade shock is creating more distinct regionalization across Canada with some provinces and local economies disproportionately bearing the brunt of the breakdown. Though, none have been entirely immune.   

    Thanks to CUSMA, a narrower subset of industries, and therefore geographies, experienced the bulk of the trade shock. While the trade war became a national fixation, it hit manufacturing-heavy provinces of Quebec and Ontario the hardest. Steel, motor vehicles and parts saw the largest export losses, creating particularly acute challenges for regions like southwestern Ontario. Cities like Windsor, Ont., saw unemployment rates rise as high as 11.1%, while the national average peaked at 7.1%.  

    Outside of Ontario and parts of Quebec, the rest of Canada—particularly energy and agricultural-producing provinces—felt minimal direct impacts from the trade war. They benefitted from having very little trade being exposed to U.S. tariffs, and greater overall trade diversification. B.C., for instance, didn’t find itself at the heart of the conversation in 2025, but is likely to feel some pain in 2026 from the knock-on effects of lumber duties, which jumped in October 2025.  

    Coupled with the energy shock, the trade shock is creating broader economic divergence across the country, with several implications worth exploring for policymakers at all levels of government.   

  4. The U.S. trade deficit was redistributed 

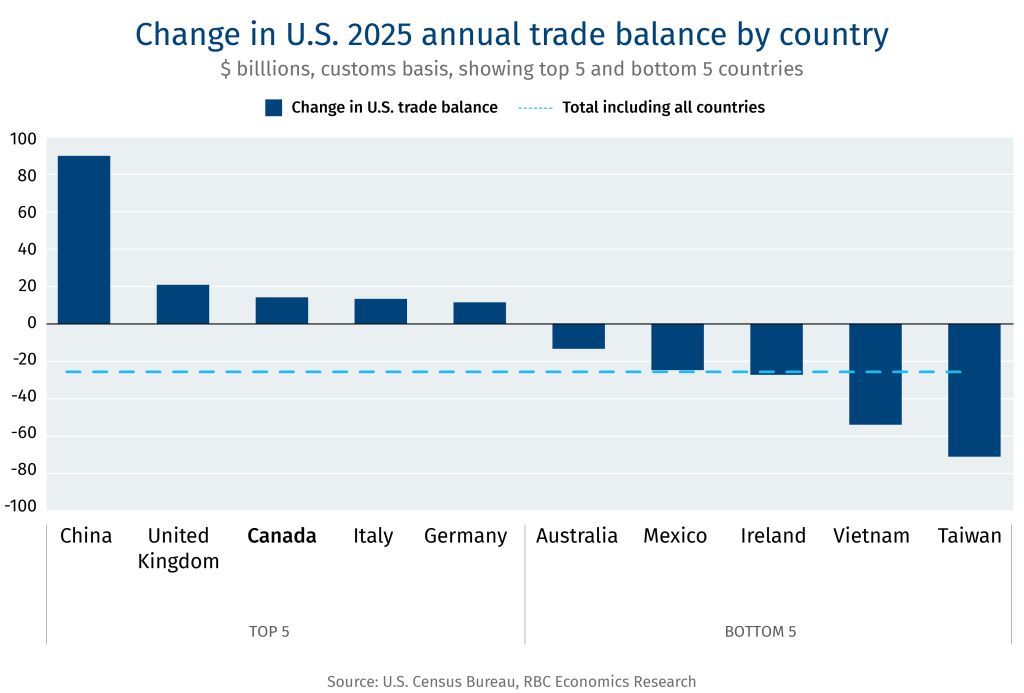
    Tariffs were justified by the U.S. administration, in part, as a method to reduce the U.S. trade deficit. One year on, however, the deficit has moved in the wrong direction. Overall, the goods and services deficit widened by US$47 billion in 2025 compared to 2024. The goods trade deficit alone hit a record US$1.26 trillion in 2025.  

    Beneath the surface lies a clear trade policy shift: While the total deficit grew, its mix changed meaningfully. Tariffs successfully reduced imports from primary targets (especially China), while ramping up from other Asian countries, including Vietnam, Taiwan, India, Thailand, and Malaysia. 

    Some other targets, including Mexico, saw exports to the U.S. rise. The U.S. deficit with Mexico grew significantly by US$25 billion despite being subject to 25-35% tariffs at various points in 2025, but with significant exemptions. Some trade goals are a poor match for deeply integrated manufacturing supply chains. 

    Ultimately, the geography shifted substantially, but the aggregate scale of trade did not.  

  5. Canadians have taken economic protection, and damage, into their own hands

    Retaliatory measures were put in place by governments, but Canadians took the trade war personally, particularly with travel. And, it had an impact on Canada, and a key sector in the U.S. 

    Limited retaliatory measures from the Canadian government minimized the impact of the trade war on consumer prices at home, but consumer behaviour, especially in travel, still changed

    The federal government’s initial tariff retaliation only covered about a third of U.S. imports before being repealed by September, except those on steel, aluminum, and autos. This kept consumer prices down and gave the Bank of Canada flexibility to further lower interest rates. Meanwhile, provincial governments have exercised product boycotts, notably around American-made liquor, while federal and provincial governments now have “Buy Canada” procurement policies. 

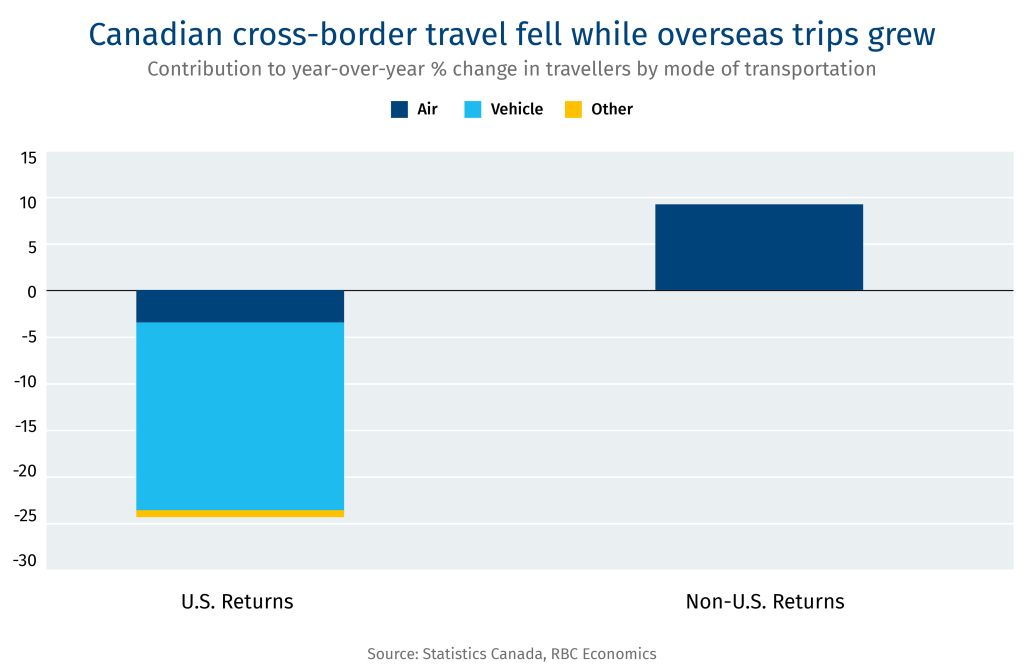
    Still, the country responded in less official, more targeted ways. Travel is the most notable example. Canadian returns from the U.S. shrank 25% year-over-year in 2025.

    Instead, travel to the rest of the world was up 9.2% compared to 2024. And Canadians spent more at home with a 2.7% bump in domestic tourism, raising spending to 11% above its pre-pandemic average. This has been a positive driver for increased domestic consumption. 

  6. Canada added more jobs than the U.S. in 2025 as both sides suffered from the shock 

    Jobs data tells a surprising story. Canada’s Labour Force Survey showed 211,000 jobs were added in 2025, up 1%. Meanwhile, the American Nonfarm Payroll survey showed a 116,000 increase, a 0.07% bump to the employed number. 

    What’s even more interesting is what happened beneath the surface. In the U.S., about 275,000 jobs were lost last year in trade-exposed sectors, including manufacturing, wholesale, retail, transportation and warehousing, and temporary help services. Out of all trade-exposed sectors, transportation and warehousing were hit the hardest with the magnitude of job losses reminiscent of COVID era cuts. Nearly 430,000 jobs were added on net in all other sectors combined.  

    In Canada, jobs dependent on U.S. demand fell by 2%. The silver lining, at least for Canada, is that while the country’s exports (~68%) are heavily dependent on the U.S., only ~12% of jobs are dependent on U.S. demand, helping to stem the bleeding from the trade shock.  

    The bottom line: Workers in both economies have suffered and would benefit from improving trade relations over deterioration.  

Canada and the United States are bound by the world’s largest bilateral trade relationship—one now under unprecedented strain. In what follows, we focus on four strategically significant industries: critical minerals, energy, automotive, and defence, which sit at the intersection of that relationship. We explore how deepened strategic alignment can enhance North American security, competitiveness, and resilience—and how that could be achieved.

The Challenge: The Canada-U.S. auto trade is under pressure on several fronts

  • U.S. Section 232 tariffs introduced friction at precisely the moment the industry needed continental coordination.

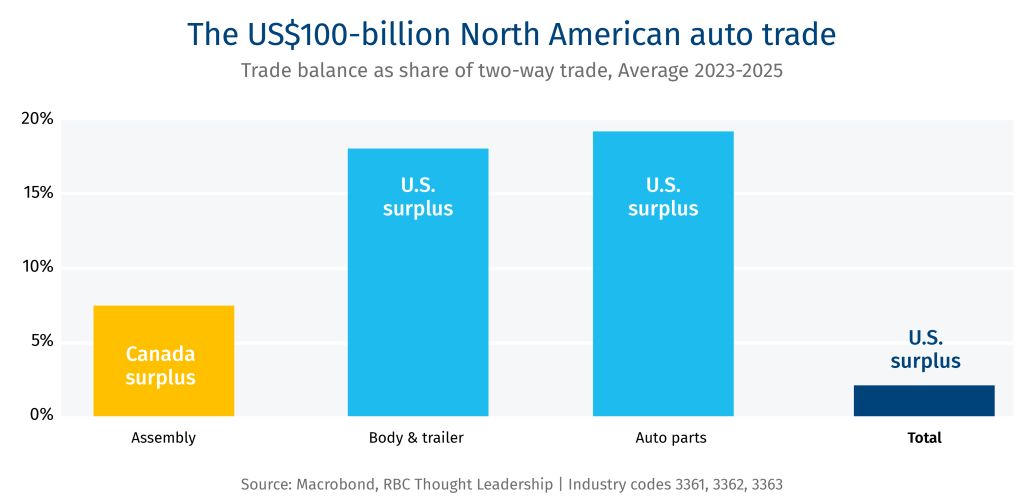
  • The deep structural threat to the US$100-billion Canada-U.S. auto trade is China, which produced 33 million vehicles in 2025—more than a third of the global total. China’s rising dominance is underwritten by scale, superior technology, development speed, and vehicle affordability. 

  • Four other mega forces compound that challenge:

    • Electrification is stalling in North America, even as Chinese-led propulsion electrification is accelerating everywhere else;

    • Vehicles are becoming software-defined platforms, with value increasingly concentrated in chips, sensors, and software rather than mechanical hardware;

    • Industry 4.0 is transforming manufacturing operations and reducing labour demand;

    • Market maturity, as slowing population dynamics and the rise of shared mobility platforms are changing ownership patterns among urban consumers.1

Collective Strengths

  • The U.S. brings the scale, capital, and market demand. American manufacturing expertise, R&D infrastructure, and domestic policy levers shape where investment flows across the North American system.

  • Canada brings complementary assets: award-winning assembly plants, global calibre parts-makers (e.g., Magna, Linamar), and a tech cluster with capabilities in sensors, AI, lightweight materials, and autonomy. BlackBerry QNX software, for instance, is already embedded in more than 250 million vehicles worldwide.2

    The US$100-billion North American auto trade. Trade balance as share of two-way trade, Average 2023-2025.
  • Both countries have strengths in AI and autonomy, but trail China in battery chemistry, primary extraction and refinement of battery elements, and the manufacturing scale that drives efficiency.

  • Canada’s power grid is clean and more competitively priced than comparable auto jurisdictions like Michigan and Ohio. This is becoming more strategically significant as electrification, onboard computing, and autonomous systems raise the power load per vehicle.

  • Canada’s critical minerals are a hedge against dependence on China. The mining and refining of copper, cobalt, lithium, and graphite would strengthen integrated battery, EV, and smart car supply chains. From mine to finished vehicle, the entire value chain can be completed within North America—much of it within a day’s drive to assembly plants.

  • Batteries are expensive and dangerous to transport (owing to their chemical composition), which makes Canada’s rail, Great Lakes shipping, and cross-border trucking a competitive advantage.

The Obstacles

  • Tariff uncertainty is the most immediate obstacle to growth and innovation. For Canada, the threat is existential. More than 90% of Canadian vehicles are shipped to the U.S. Even with a relatively low effective tariff rate, plant margins would be compressed, changing the calculus for investment committees in Detroit and Tokyo.

  • For the U.S., retaliatory tariffs are damaging but not fatal. Canada’s consumer market is large and lucrative—on a per capita basis, Canadians buy more vehicles than any other country. save the U.S. Canada is not only the largest export market for U.S. vehicles—it’s larger than the next 10 countries combined.

  • Relocating assembly within the U.S. would make vehicles more expensive for American consumers. Canadian aluminum is produced using clean, low-cost hydro and nuclear power and is a critical input for lightweighting vehicles. The Ford F-Series is North America’s top selling vehicle and contains some 850 pounds of aluminum. Canada supplies more than half of the total U.S. aluminum consumption. Reshoring production with tariffed aluminum could cost U.S. auto consumers US$1 to US$2 billion.3 Vehicle affordability has already deteriorated on both sides of the border. The average transaction price for a new vehicle now exceeds $50,000 in the U.S. and $60,000 in Canada, putting new vehicles out of reach for many consumers.4 The result is an aging vehicle fleet, as households stretch replacement cycles or exit the market entirely. Tariffs, onshoring mandates, and the cost premium associated with electrification threaten to compound the affordability challenge.

  • The EV retreat is stranding capital without solving the competitiveness problem. Detroit automakers US$53 billion in write-downs reflects a genuine misread of consumer behaviour and policy stability.5 Industry forecasters project North American vehicle production will remain below the 2016 record of 18 million light vehicles through the end of the decade.6 The pivot back to ICE and hybrid platforms buys time, but Chinese OEMs continue to build technological and scale advantages on the platforms—electrified, software-defined—that will dominate the coming decades.

The Path Forward

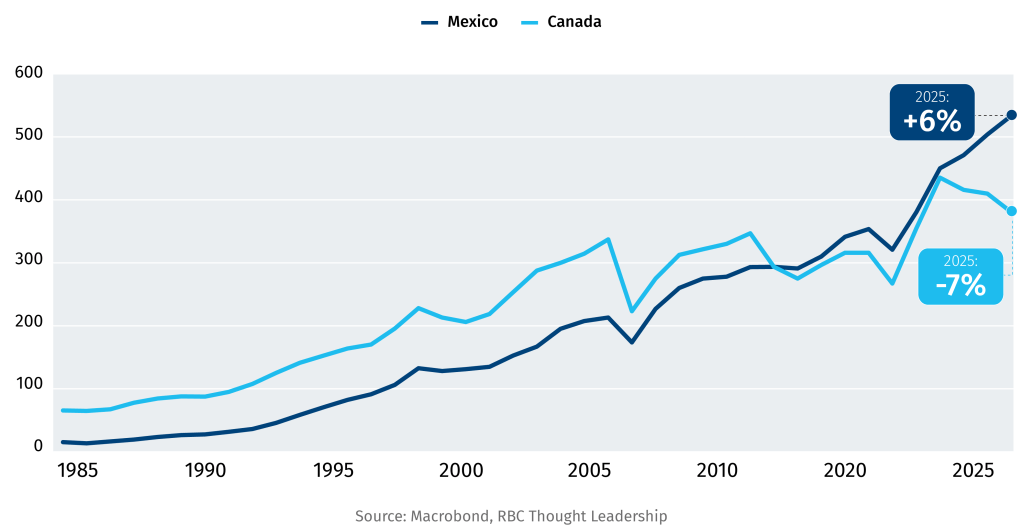
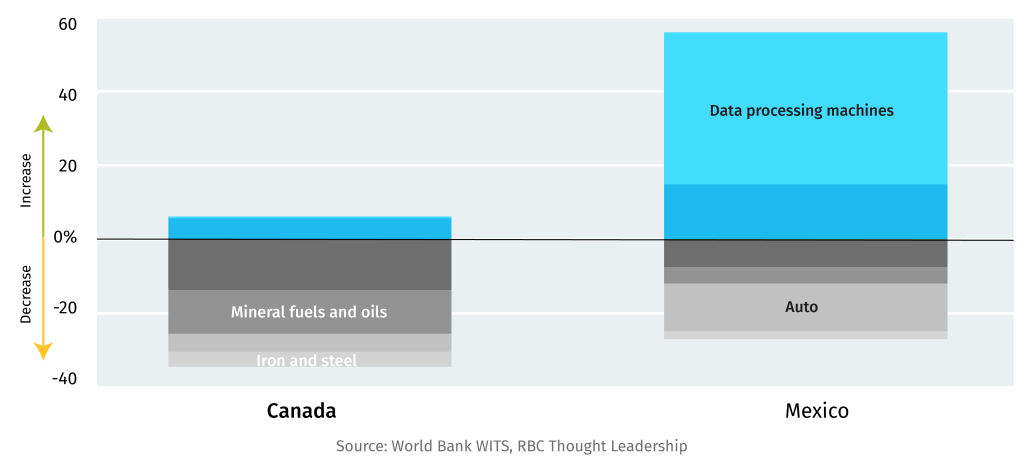
  • Trade Policy Reforms. Washington’s goal—repatriating manufacturing—reflects a legitimate industrial concern, but the production the U.S. seeks to recover did not migrate to Canada. Since 2000, both Canada (-1.7 million units) and the U.S. (-2.6M units) saw assembly volumes shrink as the continental assembly footprint migrated to Mexico (+2.2M units). Canada, the U.S., and Mexico could align and strengthen the Rules of Origin and reform Most Favoured National tariff policy, which would incent global OEMs to locate production within the bloc, while jointly levying tariffs on EVs, parts, steel and aluminum from outside the bloc—hedging Chinese dumping. Reforms to the Labour Value Content provisions such as raising the content share and the wage rate would help rebalance investment and production within the bloc, which has long been biased toward Mexico.7

  • Critical Minerals Auto Pact. Cooperation on an end-to-end supply chain would tie Canada’s world-class geology and mining expertise with American capital markets industrial demand. In exchange for duty-free access to the U.S. market, Ottawa and the provinces could formalize free trade for steel, aluminum, and copper, and off-take agreements, stockpiling arrangements, and price floors for cobalt, lithium, graphite, and rare earths—commercially de-risking private investment and converting Canada’s processing infrastructure into implicit U.S. supply chain security with no net new capital cost to either government. Extraction and refinement could utilize Canada’s vast capabilities in clean power.

  • Cooperation in Skills and Research. North American OEMs are pivoting toward extended-range electric vehicles (EREVs) and hybrids as the bridge between ICE and full electrification. Co-investment in testing facilities, SR&ED reform to cover autonomy, connectivity, and cybersecurity mandates, and immigration reform to attract engineering and AI talent would deepen the skills density needed to compete with China.

The Potential Outcome: Canada and the U.S. could be better prepared for an electrified, autonomous, and increasingly software-defined auto future by building on a bilateral partnership that ties Canadian aluminum, clean power, critical minerals, and advanced manufacturing capability to American capital markets, OEM headquarters, and consumer demand. Preserving market access for both parties could help keep vehicle prices competitive for consumers while excluding Chinese content from continental supply chains.

The Challenge: China’s Structural Dominance

  • Chinese dominance in the refining and manufacture of critical minerals is the most direct threat to industrial sovereignty in North America. China dominates processing for 19 of the 20 most critical minerals, commanding, on average, 70% of market share. For tech and battery materials like gallium, graphite, and rare earths, its share exceeds 90%.8

  • Questions about the weaponization of supply chain dependence are no longer theoretical. China imposed export controls on gallium, germanium, rare earths, and battery chain technologies during the height of trade tensions with the U.S. In 2025, Ford shut down its Chicago assembly plant for one week following China’s rare earth export restrictions. The U.S. Geological Survey estimates that a 30% supply disruption of gallium could reduce U.S. output by US$600 billion—2% of U.S. GDP.9

Collective Strengths

  • The continental response—who mines, who refines, and who captures the downstream value—will shape North American industrial and defence competitiveness through 2040.

  • Canada and the U.S. are already each other’s largest minerals trading partner—approximately $150 billion in bilateral minerals trade annually.10 Canada is the top source for U.S. critical mineral imports, supplying 20%.11 But the current system is fractured: Canada mines, China refines, and the U.S. manufactures. Closing the gap is the defining industrial policy challenge of the coming decade.

  • Canada has world-class geology across cobalt, copper, gallium, germanium, graphite, lithium, nickel, tungsten and rare earths, with a seven-fold supply potential by 2040.12 Canada also has mature or developing refining infrastructure, including Anglo Teck’s Trail Operation (germanium), Neo Performance Materials’ Rare Earth Metals Facility (gallium), the Sudbury corridor (copper, nickel, cobalt), and the Bécancour mineral processing ecosystem, which connects Quebec’s mines with processing plants and downstream battery manufacturing.

    China has a tight grip on minerals, but Canada offers an alternative. The U.S. demand for minerals is projected to grow significantly into 2035.
  • Canada has clean, affordable power and abundant water. The U.S. has manufacturing scale, dominant capital markets, and the political will to strengthen supply chains.

The Obstacles

  • China has access to nearly unlimited, state-subsidized capital to finance mines and processing plants.

  • The talent and R&D gap with China has widened. China has 39 university degree programs to train engineers and technologists in critical minerals—Canada has none.13

  • For many critical minerals, North American demand is too thin to anchor the market. In 2024, the U.S. accounted for less than 2% of rare earth consumption—far below the threshold needed to make offtake agreements commercially viable.

  • Investment cycles in mining are long. In a world where capital is flowing into short-cycle AI, attracting investment into the refining of low-volume minerals is economically challenging.

  • High labour and environmental standards are strategic advantages in the long run, but they generate permitting timelines that extend well beyond those in China. Processing facilities face additional environmental impact assessments.

  • Supply chains will form around demand, not supply, but most demand will come from renewables and EVs, not defence. Battery chemistry is evolving rapidly, and with it, mineral intensity. Until recently, cobalt was considered essential. Lithium iron phosphate chemistry has since displaced it as the dominant cell technology. Sodium-ion and solid-state could similarly disrupt lithium demand.

  • Canada cannot pursue a strategy across all 34 critical minerals simultaneously. Capital, talent, permitting bandwidth, and infrastructure are finite. A more credible strategy would concentrate investment in minerals where Canada has refining infrastructure already in place and where Canada’s clean power advantage is most decisive. The strategy could also be geared toward minerals with demand that is technology-path-independent and is supported by multiple end uses beyond EV batteries.

  • While states have a role to play in creating and supporting markets, regulatory capture by a few anchor firms is a threat to the public good.

The Path Forward

  • Canada’s supply infrastructure and U.S. demand architecture are symbiotic. A formal Critical Minerals Partnership would tie Canadian geology, clean power, and mining expertise with American capital markets and North American manufacturing demand in a pairing that no other allied combination could match.

  • Long-term demand for critical minerals is expected to be strong. The IEA projects demand growth to 2040 for copper (30%), cobalt (50%), graphite (130%), lithium (350%), nickel (70%), and magnet rare earth elements (65%), driven by renewable energy, EV adoption, grid battery storage, and electricity network expansion. Defence layers on top of these, reinforcing the strategic case to build these supply chains now. Demand aggregation across the U.S., Canada, the European Union, the U.K., Australia, India, Japan and Korea could expand the market beyond 2.5 billion people.14

  • Project Vault works better with Canada. Canada’s federal strategy targets the same six minerals—lithium, graphite, nickel, cobalt, copper, and rare earths—mirroring Project Vault’s key focus areas. Ontario’s $500 million Critical Minerals Processing Fund is building the midstream refining capacity that U.S. OEMs need as a Vault counterparty. Explicit Canadian rules-of-origin eligibility under Vault—so that minerals refined at these facilities qualify as U.S. domestic supply—would convert existing Canadian processing facilities into implicit U.S. industrial capability with no net new capital cost to either government.

  • Allied demand aggregation works better if the U.S.-Canada bilateral partnership is the foundation. The Forum on Resource Geostrategic Engagement (FORGE) could be recast along NATO-like lines, wherein allies commit to procuring refined minerals from other allies as part of their NATO spending targets.15

  • China’s price manipulation is the shared threat that makes bilateral price stabilization essential. Use of a contract-for-difference (CFD), price floors, and volume guarantees could be applied bilaterally to Canadian processors, which would insulate North America’s supply chains against Chinese price manipulation.

  • Sustained investments in R&D, processing chemistry, and engineering talent are needed. Joint investment, shared technical training programs, and co-location of processing and end-use manufacturing could help build the skills density that neither country could develop on its own.16

The Potential Outcome: A North American supply chain could lead to reduced dependence on Chinese refining, tying Canadian geology and mining with American financing and manufacturing demand, deepening supply chain resilience and strategic capabilities simultaneously.

The Challenge: Security, Affordability, and Optionality

  • In 2024, Canada exported $170 billion worth of hydrocarbons to the U.S.—crude oil, natural gas, natural gas liquids, and refined products—accounting for 22% of Canadian exports. Canada supplies more than 60% of U.S. crude oil imports and virtually all natural gas imports. Two-way energy trade sits at $215 billion, underpinned by over 100 transboundary pipelines and transmission lines.17

  • Three imperatives define the relationship:

    • Energy security and sovereignty: Canada’s export dependence on a single buyer exposes both countries to disruption risk—political, logistical, or geopolitical. For oil, future demand growth is in Asia. For natural gas, demand growth is both Asian and North American.

    • Consumer affordability: Energy price volatility, whether caused by conflict in the Persian Gulf, tariff friction, or infrastructure constraints, passes through to households and industry on both sides of the border.

    • Value Maximization: The WCS-WTI price differential—historically US$10-25 per barrel—represents a structural transfer of value from Canadian producers to American refiners, driven by Alberta’s landlocked geography and insufficient export optionality.18

  • The crisis in the Persian Gulf has tightened heavy crude markets, elevated prices, and sharply illustrated the vulnerability of relying on politically unstable supply. The U.S. and Asian allies are assessing alternatives. Canada is the obvious answer.

Collective Strengths

  • Canada is the world’s fourth-largest oil producer, pumping 5.8 million barrels per day. The oilsands are a distinctive asset: long-lived, capital-intensive, and—unlike U.S. shale—resilient to short-cycle price volatility. U.S. crude production is plateauing: the EIA’s long-run reference case projects peak production in 2030, followed by decline in the 2030s. As the shale boom recedes, Canadian imports become more strategically important.19

  • North American heavy crude demand is structural. U.S. Midwest and Gulf Coast refineries are configured to process heavy, sour Canadian bitumen—the same configuration increasingly common in India and China. U.S. refineries with heavy conversion capacity will require a replacement source. Venezuelan production remains constrained by security, risk, and infrastructure. Canada is the only proximate heavy supplier at scale.20

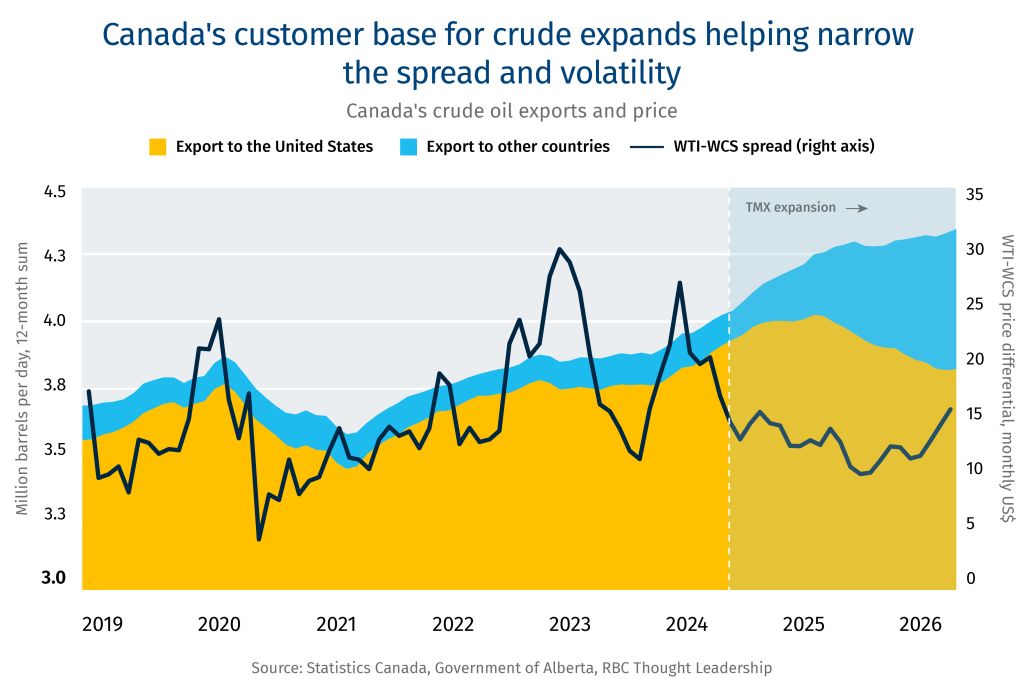
  • The Trans Mountain Expansion (TMX) has begun to transform Canada’s strategic position. Since it came online in 2024, TMX has tripled capacity to 890,000 bpd to tidewater. The WCS-WTI discount narrowed and stabilized from nearly US$30 per barrel in 2022 to approximately US$10 by 2025. Each additional barrel shipped to Asia rather than into the continental market compresses the differential, improving producer netbacks.21

    Canada's customer base for crude expands helping narrow the spread and volatility. Canada's crude oil exports and price.
  • On natural gas, Canada’s Montney formation in northeastern British Columbia is one of the largest natural gas resource plays in the world, and LNG Canada’s Kitimat facility, which shipped its first cargo on in June 2025, has opened Canada’s first large-scale Pacific LNG export route.

The Obstacles

  • Oil prices: low and volatile prices challenge greenfield expansion and pipeline infrastructure; high prices trigger demand destruction and accelerate the energy transition. Sustained greenfield expansion will require policy stability and expanded export infrastructure.

  • Greenfield investment in the oilsands is limited. Growth from existing facilities is achievable but requires a policy environment that fosters growth and does not disadvantage Canada relative to other jurisdictions. A resolution of the Gulf crisis—returning Saudi, Iraqi, and potentially Iranian heavy sour supply to the market—would loosen the premium that currently benefits Canadian barrels in Asia. Venezuelan production, if rehabilitated under a U.S. policy shift, would compete more directly with Canadian heavy than U.S. shale.22

  • On gas, substitution is a constraint that does not apply to oil. Asian buyers can switch from LNG to coal, nuclear, or renewables. LNG Canada’s competitive position in Asia depends on carbon policy coherence, shipping costs relative to Qatari and Australian exporters, and whether Canadian gas can price below coal.

  • The Pathways Alliance—Canada’s five largest oilsands producers—has committed $16.5 billion for carbon capture and sequestration through 2030. The tension between energy security and climate policy has led to policy volatility on emission management, which compounds the technical and financial challenges associated with CCS projects.

The Path Forward

  • Optionality benefits both countries. The strategic logic for oil and gas runs in opposite directions, and both countries’ energy policy could reflect that asymmetry. For Canadian oil, diversification into Asia is the value-maximizing move: every additional barrel shipped via TMX to Asian buyers narrows the WCS-WTI discount and increases netbacks for Canadian producers. Pushing more heavy oil into the continental U.S. market has the opposite effect. For natural gas, the calculus is reversed: AI-driven electricity demand has elevated Henry Hub pricing, making the U.S. a premium gas market. LNG Canada’s Pacific route remains strategically important for Canada’s long-run diversification. The U.S., likewise, could continue to seek optionality for its refineries, securing Canadian supply while finding new import sources.

  • A formal Energy Security Partnership. One with harmonized pipeline permitting and regulatory timelines, joint strategic reserve coordination, bilateral CCS and methane abatement collaboration, and a common framework for infrastructure investment that treats Canadian production as implicit U.S. supply security without requiring government capital from either side. This could be expanded to include the G7 and NATO allies.

  • Oil is a market that works. The continental oil and gas system—hundreds of pipelines, integrated refining, established commercial flows—functions efficiently when policy does not distort it. Tariffs on Canadian energy raise prices for U.S. consumers, widen the WCS discount, and reduce producer revenue without repatriating any production. The U.S. refining system—particularly the heavy conversion capacity—was built for Canadian oil. Disrupting that relationship would require billions in retooling at U.S. refineries or sourcing heavier barrels from less stable suppliers.

  • Gas is complementary, not competing. Henry Hub natural gas prices have spiked with AI-driven electricity consumption in the U.S., making gas sales to the U.S. market economically attractive for Canadian producers. The Montney gas basin and U.S. demand growth reinforce each other. Investment in Montney production infrastructure by U.S. and Canadian investors alike expands the continental gas supply that both countries need for power generation, industrial use, and LNG export.  

The Potential Outcome: A bilateral energy partnership could link Canada’s world-class oil and gas resources, pipeline infrastructure, and Pacific tidewater access with U.S. refining capacity, capital markets, and continental demand to deliver affordable, secure energy to consumers while expanding strategic optionality in global markets for both.

The Challenge: Heightened threat environment, fraying alliances

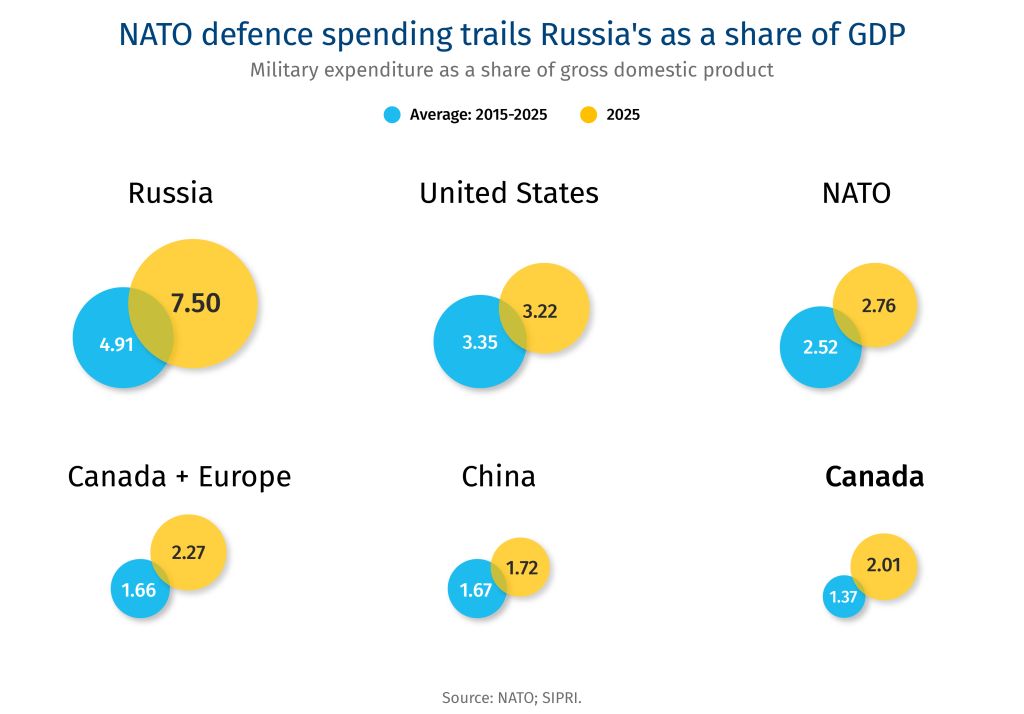
  • World military expenditure reached US$2.9 trillion in 2025—the ninth consecutive annual increase. The U.S., China and Russia accounted for roughly half of that—unchanged from 2000. However, the relative share changed dramatically: in 2000, Russia and China combined to spend a tenth of U.S. expenditure; today, they spend more than half that of the U.S.23

  • Russia’s invasion of Ukraine broke the security calculus for Europe. NATO responded with a historic commitment: at the 2025 Hague Summit, all 32 allies met the 2% GDP target for the first time since the 2014 Wales pledge. And NATO Allies agreed to a new benchmark of 5% of GDP by 2035.24

  • Russian and Chinese exercises and probes around the Arctic illustrate the rising threat level for North America.25 The Canada–U.S. defence partnership faces four frictions:

    • Defence Expenditure: Canada increased its military spending by nearly 70% from 2022 to 2025—hitting the 2% NATO target for the first time since the 1980s.26 Despite pledging to reach 5% of GDP by 2035, Canada has yet to produce a roadmap Washington finds convincing, prompting the U.S. to suspend the Permanent Joint Board on Defence.27

    • F-35 Procurement: Canada’s review of the program comes amid deepening trade tensions. The U.S. frames the delay not merely as a procurement decision but as a test of whether Canada intends to remain operationally relevant in an era of fifth-generation air and missile defence. The trade tensions also call into question whether Canada will continue to buy the most sophisticated U.S. hardware. 

    • The Golden Dome: Designed to provide continental defence, the Congressional Budget Office has pegged the cost at US$1.2 trillion over 20 years.28 Canada’s role remains undetermined.

      NATO defence spending trails Russia's as a share of GDP. Military expenditure as a share of gross domestic product.

Collective Strengths

  • In addition to unmatched platform scale, capital depth, and technological sophistication, the U.S. possesses a dynamic defence innovation economy, R&D density, and an advanced defence industrial base.

  • Canada brings world-class capabilities in domains critical to modern defence, including avionics, aircraft maintenance repair and overhaul, marine sensors, electronic warfare, UAV’s, and training and simulation—all of which are designated as priority sovereign capabilities in Ottawa’s Defence Industrial Strategy (DIS).29 In space, Canada has a six-decade legacy spanning Earth observation, satellite communications, and positioning-navigation-and-timing systems. Canada contributes heavily to the early-warning capabilities via the northern radar networks and operates a portion of the North Warning System (NWS), and maintains Forward Operating Locations in the Arctic.30 Nearly half of Canadian defence output is exported, with 70% to U.S. and Five Eyes partners, underscoring deep interconnection into global markets.31

The Obstacles

  • Over 90% of Canadian defence firms are SMEs. The absence of large defence primes depresses capital formation, posing challenges to the ambition to scale up Canada’s industrial base. Canada’s venture capital pool—roughly $12 billion—is less than 5% of the U.S. equivalent. Collateral assets in defence (specialized facilities, restricted IP) are often illiquid, with persistent mismatch between up-front investment requirements and revenue timing.32

  • Protectionist procurement policies: Both Canada and the U.S. are pushing to buy domestically, increasing trade frictions. For Canada, directing contracts to domestic firms where industrial capacity does not yet exist at scale could increase costs and extend timelines. Outside of space, ocean, and some aircraft, the target of 70% Canadian content in defence acquisitions by 2035 (up from ~40% today) requires building industrial infrastructure that cannot be created quickly.

  • Arctic sovereignty is another tension. Russia and China pose threats to the Arctic, and despite American pressure to invest in Arctic defence, the region remains exposed (current investments in Arctic defence notwithstanding).

  • The U.S.’s defence industrial base is production-constrained, not merely capital-constrained. The conflict in Ukraine and Iran have exposed munitions stockpile gaps while ‘Buy American’ provisions and export controls have restricted supply chain integration with allies.33

The Path Forward

  • Develop distinct but interoperable industrial bases. Canada has set itself on a clear, distinct path to diversify its defence industry from the U.S. and develop its own sovereign manufacturing capacity. This will create divergent capabilities and more Canadian autonomy. However, it will be important for key capabilities, particularly those important to joint commands, to maintain technological and operational interoperability for the long-term functioning of North America’s defence framework.

  • Deepen in areas of mutual operational necessity. NORAD modernization is foundational. Canada’s ~$40 billion, 20-year investment—over-the-horizon radar (including the $6.5 billion Arctic system being co-developed with Australia), space-based surveillance, command and control, and northern infrastructure—signals deep commitment to the partnership. Canada could negotiate its participation in a future Golden Dome: Canadian sensors, Arctic radar infrastructure, and airspace access are genuine contributions that warrant cost-sharing terms, Canadian IP rights over jointly developed systems, and a defined Canadian role in intercept decision-making.34

  • Explore cooperation on space and drone technology. Recent conflicts demonstrate that uncrewed systems are redefining warfare. At the same time, space is a strategic domain that’s increasingly contested. Ukraine has become the “Silicon Valley” of defence innovation and recent NATO exercises have shown the effectiveness of these capabilities against outdated militaries. This phase of rearmament will not take the same form as previous ones. Canada must update its military equipment and infrastructure writ large, and the U.S. is facing depleted stockpiles and asymmetric threats. Therefore, both must re-prioritize what defence technology they need to develop and procure, creating opportunities for collaboration to avoid duplication in areas of shared security interests.

  • Deepen partnership on critical minerals. Canada’s geology, if twinned with refining capacity, could hedge reliance on adversarial powers. Formalizing supply agreements for NATO’s defence-critical minerals—with off-take arrangements, price stabilization mechanisms, and Rules of Origin eligibility that treat Canadian-refined inputs as U.S. domestic supply—would strengthen both countries’ industrial resilience.

  • Diversify on platforms and partnerships. Canada’s $530 million European Space Agency investment, its participation in the European Union’s SAFE initiative, and its emerging bilateral arrangement with Australia reflects Ottawa’s efforts to diversify its defence industrial base. European partners will expect access to Canadian procurement as the price of access to European markets.

The Potential Outcome: The Canada–U.S. defence relationship has historically rested on an implicit bargain: Canada provides geographic depth, on the ground, under the ocean, on the ocean, in the air and in space; the U.S. provides an umbrella of security and protection, reinforced by unmatched platform scale, capital depth, technological sophistication, and R&D expenditure. Ensuring that bargain holds requires Canada to close the gap between financial commitment and operational credibility—delivering on NORAD modernization, resolving the F-35 decision , and building a genuinely capable domestic industrial base. For the U.S., a more reliable long-term partner will be secured by respecting Canadian sovereignty.

Acknowledgments

The authors would like to thank the external experts consulted for this report, some of whom are listed below.

Peter Dawe, BDC

Steve Carlisle, General Motors (Retired)

Robert Johnston, University of Calgary

Frank McKenna, TD Securities and former Canadian Ambassador to the United States

Michael Robinet, S&P Global Mobility

[1] Brennan, J. 2026. Steering Through Uncertainty: Four Future Paths for Canada’s Auto Industry. Toronto: RBC Thought Leadership.

[2] Brennan (2026), Steering Through Uncertainty.

[3] Canada exports ~US$11 billion in aluminum to the U.S., with more than one-third demanded by the transportation sector. At tariff rate at 50%, the impact on auto assembly alone could exceed $1 billion. When auto parts are layered in, the tariff cost moves higher. For economic analysis of tariffed Canadian aluminium, see Aluminum Association. 2025. Powering Up American Aluminum: A Roadmap for Next Generation Supply Chain Resilience. Arlington, VA: The Aluminum Association; Business Data Lab. 2025. How to Undermine U.S. Manufacturing: Debunking Aluminum Tariff Myths. Ottawa: Business Data Lab.; and Livingston, Brian. 2025. Canada’s Aluminum Production and US Tariffs. Intelligence Memos. Toronto: C.D. Howe Institute. September 2.

[4] Brennan (2006). Steering Through Uncertainty.

[5] Markman, J. 2026. ‘How Legacy Automakers Torched $53 Billion on EVs They’ll Never Sell’, Forbes, February 9.

[6] Robinet, M. 2026. New Automotive Geo-economics. S&P Global Mobility. Presented at PMA, May 2026.

[7] See Helper, S. and T. Tucker. 2026. ‘Challenges and Opportunities for the North American Auto Industry in the 2026 USMCA Renegotiation’, March 4. Washington: Brookings Institution; U.S. International Trade Commission. 2025. USMCA Automotive Rules of Origin: Economic Impact and Operation, 2025 Report. Publication no. 5642. Washington: USITC.

[8] IEA. 2025. Global Critical Minerals Outlook. Paris: International Energy Agency.

[9] Baskaran includes this claim in her testimony to the House Natural Resources Subcommittee—a claim we have not been able to independently verify. See: Baskaran, G. 2026. ‘Unleashing America’s Mineral Potential: The Critical Minerals Commodity Supply Chain’, Testimony before the House of Natural Resources Subcommittee on Oversight and Investigations. Washington: Centre for Strategic & International Studies.   

[10] Natural Resources Canada. 2025. Canada-U.S. Minerals Data Dashboard.

[11] Baskaran, G. 2025. ‘Canadian Tariffs Will Undermine U.S. Minerals Security’, Center for Strategic & International Studies, January 29.

[12] Merwat, S. 2026. Mine & Refine: Bridging Canada’s Critical Minerals Capital Gap. Toronto: RBC Thought Leadership.

[13] Merwat, S. 2025. The New Great Game: How the face for critical minerals is shaping tech supremacy. Toronto: RBC Thought Leadership.

[14] See Baskaran (2026).

[15] See Baskaran (2026) for a suite of policy recommendations which integrate extraction, processing, refining, and manufacturing with demand anchors.

[16] Merwat, S. 2026. Critical Minerals Processing: The West’s refining challenge and the technologies closing the gap. Toronto: RBC Thought Leadership.

[17] Canada Energy Regulator. 2025. Market Snapshot: Overview of 2024 Canada-US Energy Trade. Available online at: https://www.cer-rec.gc.ca/en/data-analysis/energy-markets/market-snapshots/2025/market-snapshot-overview-of-2024-canada-us-energy-trade.html

[18] Part of the differential reflects quality and transportation cost, but another part is derived from insufficient export diversification. See Alberta Energy Regulator. 2025. Alberta Energy Outlook ST98. Calgary: Government of Alberta.

[19] Energy Information Administration. 2026. Annual Energy Outlook. Washington: U.S. Department of Energy.

[20] Merwat, S. 2026. Six charts that analyze Canadian-U.S. oil ties amid new geopolitical developments in oil markets. Toronto: RBC Thought Leadership.

[21] Johnston, R. 2026. ‘Asia’s Oil Demand Outlook and Geopolitics’, Presented to PwC Canada/School of Public Policy Asia Oil Outlook, May 7.

[22] See the Oil Sands Alliance’s explainer on the Pathways Project: https://oilsandsalliance.ca/pathways-project/.

[23] Author’s calculations based on data from SIPRI Military Expenditures Database (constant 2024 $USD). 

[24] NATO. 2025. Defence Expenditures and NATO’s 5% Commitment. Brussels: North Atlantic Treaty Organization. Available at: https://www.nato.int/en/what-we-do/introduction-to-nato/defence-expenditures-and-natos-5-commitment.

[25] Bingen, K.A. 2026. ‘Orbits of Influence: Emerging Threats to U.S. Space Security and Foreign Policy Implications’. Statement before the House Foreign Affairs Subcommittee on Europe. Washington: Center for Strategic and International Studies, April 29.

[26] NATO data indicates that Canadian defence spending rose from US$26 billion in 2022 to US$44 billion in 2025—an increase of 69% (using current prices and exchange rates). SIRPI data indicates that Canada spent 2.06% of GDP on defence in 1987. 

[27] Some interpret the suspension of the PJBD as a response to Canada’s decision to review the F-35 program (and not as a response to Canada’s planned military expenditures, despite advertisements to the contrary).

[28] May 2026 report from the Congressional Budget Office: https://www.cbo.gov/system/files/2026-05/62379-golden-dome.pdf.

[29] Department of National Defence. 2026. Canada’s Defence Industrial Strategy: Security, Sovereignty and Prosperity. Ottawa: Government of Canada.

[30] See NORAD Backgrounder: https://www.canada.ca/en/department-national-defence/news/2022/06/north-american-aerospace-defense-command-norad.html

[31] See Canada’s (2026) Defence Industrial Strategy.

[32] Ashcroft, T. 2026. Frontline Investments: How to Advance Defence Finance in Canada. Toronto: RBC Thought Leadership.

[33] See reporting from the Associated Press, ‘US Will Need Years to Replenish Stockpiles of Advanced Weapons Used in Iran War, New Analysis Finds’, May 27. Available online at: https://www.usnews.com/news/business/articles/2026-05-27/us-will-need-years-to-replenish-stockpiles-of-advanced-weapons-used-in-iran-war-new-analysis-finds

[34] Department of National Defence. 2025. Fact Sheet: Funding for Continental Defence and NORAD Modernization. Ottawa: Government of Canada. Available at: https://www.canada.ca/en/department-national-defence/services/operations/allies-partners/norad/facesheet-funding-norad-modernization.html.

While the U.S. and Mexico were kicking off bilateral talks on CUSMA (and announced two more sets of meetings in June and July, without a mention of Canada), Prime Minister Mark Carney was in New York making the country’s case to a business audience.

As the U.S. pivots to bilateral talks in its effort to reshape North American trade dynamics, we examine how Canada and Mexico have fared as the U.S. squeezed both with tariffs and other economic pressures.

Mexico’s exports to the U.S. soared, Canada’s slipped in 2025

Annual U.S. imports from Canada and Mexico, billion US$

  • Despite one of the lowest effective tariff rates of ~3-4%, thanks to CUSMA shielding ~90% of Canadian exports, the U.S. imported nearly US$30 billion less goods from Canada—the second largest drop among U.S. trading partners behind only China.

  • Canada’s loss was almost identical to Mexico’s gain. It remains America’s largest import source and has extended its lead on the rest of the pack.

  • Both Canada and Mexico were at the epicenter of the tariff war, yet the divergence came down to the product mix, and new emerging trends, such as AI.

    Tariff-hit sectors squeezed both countries, but AI lifted Mexico

    Change in imports compared to 2024 by product categories, billion US$

  • Canada’s losses were broad-based. U.S. purchases from Canada fell across product categories that accounted for 84% of all imports from Canada. Lower oil volumes along with soft oil prices in 2025 accounted for a third of the drop in imports, with auto, steel and aluminum extending the decline by nearly as much.

  • Like Canada, Mexico reeled from the Section 232 tariffs. The U.S. imported US$13 billion less in auto and parts from Mexico, accounting for half of the decline.

  • The AI boom, however, lifted Mexico’s trade balance. The U.S. imported US$250 billion data processing units last year—almost double what it bought a year earlier—and Mexico was the single largest seller, supplying a third of that.

  • Data processing machines climbed to the top of the Mexico’s export ladder displacing passenger cars. Mexico’s share in global supply has doubled over the past two years, now supplying 18% of the US$550 billion global imports, and rapidly catching up to China and Taiwan.

    Manufacturing sector remained soft throughout 2025

    Manufacturing Purchasing Managers’ Index (PMI)

  • Canada’s manufacturing sector, which makes up a tenth of the economy, took far more than a tenth of the pain, with GDP down 2.5% in 2025, marking a third consecutive decline. The squeeze was broad-based—14 of the 18 manufacturing subsectors contracted, from transport equipment and food & beverage to chemical and metal products.

  • Both countries shed factory jobs in 2025 but things are now diverging. Canada is regaining footing on its factory floor, with PMI climbing above 50 this year—seen as a level that signals expansion driven by new orders. Mexico’s manufacturing has been trending within the contraction zone for the past 22 months, long before tariffs were introduced, and shows no signs of immediate recovery.

    U.S. tariff impact less damaging than feared for both Canada and Mexico

    Projection and actual real GDP growth for 2025

  • Doom and gloom scenarios did not materialize thanks largely to CUSMA, though tariffs shaved off about a fifth of Canada’s pre-trade war growth expectations, and over half for Mexico.

  • Resilient consumer demand and fiscal policy provided a cushion for the Canadian economy. Mexico saw the opposite trend as the government tightened its budget. Meanwhile, remittances from the U.S. dropped 4.6%, partially due to an immigration crackdown and softening household consumption.

 Farhad Panahov, Economist

For more:

One year later: How US tariffs and trade policy have reshaped the landscape – RBC Economics

One year of tariff shocks in Canada: What we learned

Brussels prepares broader measures against Chinese imports

  • The European Commission signalled it will expand the use of import quotas and safeguard tariffs across entire sectors as concerns grow over Chinese overcapacity in chemicals, metals, clean technology, and manufacturing. Industry Commissioner Stéphane Séjourné said the EU’s trade deficit with China has reached roughly €1 billion per day, with policymakers increasingly framing the issue as a threat to European industrial competitiveness.

India sends largest-ever trade delegation to Canada

  • Indian Commerce Minister Piyush Goyal led an Indian trade and investment delegation as Ottawa and New Delhi look to accelerate free trade negotiations and target $50 billion in bilateral trade by 2030, up from roughly $10 billion today. 

Shipping industry warns of rising costs and capacity constraints

  • Global shipping executives told the World Trade Organization that disruptions in the Gulf region and other maritime chokepoints are driving up costs across supply chains, while alternative transport corridors face growing capacity constraints. Industry leaders noted that a single container ship can carry the equivalent of roughly 70 freight trains.

ECB warns geopolitics are becoming a financial stability risk

  • The European Central Bank warned that the Iran conflict, volatile U.S. trade policy, and growing geoeconomic fragmentation are increasing risks to global financial stability. The Bank cautioned that markets may be underestimating the potential economic impact of prolonged energy disruptions, elevated sovereign debt levels, and renewed inflationary pressures stemming from geopolitical shocks.

Thomas Ashcroft, Global Issues Policy Lead

Also in this edition: The Power of Siberia 2 and implications for Canada 

A year into Prime Minister Mark Carney’s trade diversification push, global infrastructure investors are registering the signal. The Global Infrastructure Investor Association (GIIA) Spring 2026 survey—covering leading infrastructure funds across North America and Europe—ranks Canada #1 for investment attractiveness, ahead of the U.S. and Germany. It’s the first time Canada has finished atop the annual survey. Here are the highlights: 

  • Global infrastructure fundraising hit a record US$289 billion in 2025. LP allocations are rising further in 2026—but capital is concentrating, with the top 10 managers capturing 40% of total commitments. Commitments above $2 billion are increasing most sharply. 

  • Battery storage topped North American sector rankings for the first time. Regulated gas improved materially. Geopolitical risk is now priced in individual transactions: supply chain exposure, policy durability, and counterparty strength are deal-level considerations. 

  • Canada’s pension funds—CPPIB, OMERS, Ontario Teachers’, PSP—sit at the intersection of that capital and those relationships. Their sovereign co-investment networks across Asia, the Gulf, and Europe are the intermediation layer global allocators. 

The world is noticing the shift in Canada, but it wants to see evidence of intent and action. The federal government will get a chance to bolster the case for Canada at the Canada Investment Summit in Toronto this September. 

 Shaz Merwat, Energy Policy Lead 

In ‘Surging gold prices, inroads to foreign markets cushion Canada’s exports,’ RBC Economics notes that ‘gold exports to the U.K. surged by a nominal $17 billion, or 76%, in 2025—making gold Canada’s second-largest export after crude oil—significantly cushioning declines in other goods.’ 

It wasn’t a headline agenda item of the Xi–Putin summit this week, but the Power of Siberia 2, a long-stalled pipeline that would carry Russian natural gas east to China, inched back into the spotlight as a result of the two leaders high-profile meeting. 

What is being proposed? 

A 2,600-kilometre pipeline carrying up to 50 billion cubic metre per year of gas, nearly on par with the capacity of the now idle Nord Stream 1, from Siberia’s Yamal gas fields through Mongolia to China.  

What’s the holdup? 

For one thing, price. Beijing wants roughly 12–13 cents per cubic metre, near Russia’s domestic rate; Moscow wants double. The summit ended with warm words but no price or project timeline. 

If it did come to be, how would it alter Chinese demand for non-Russian imports? 

An overland gas pipeline sidesteps maritime chokepoints China’s seaborne LNG must run through, such as the Strait of Hormuz, where tensions have left oil and gas tankers stranded for weeks (two Chinese tankers passed through Hormuz this week). A direct pipeline link to Russia would displace gas that China might otherwise pull from global LNG markets, with potential downward pressure on prices. 

Implications for Canada’s LNG ambitions? 

According to Robert Johnston at the University of Calgary, Canada’s gas story lies closer to home. More Russian gas east would push U.S. and Qatar LNG cargoes toward the same Asian buyers Canada is courting, impacting prices as LNG Canada’s second phase ramps up. But with an image of geopolitical stability and strong emissions credentials (Russian gas has an emissions intensity 50% higher than Canada’s gas) the decisive variable for Canada’s LNG ambitions–the rollout of major projects–is domestic execution rather than economics.

Additionally, energy importers are increasingly wary of relying heavily on one geography, especially after Russia weaponized natural gas exports to pressure Europe as it ramped up its war in Ukraine, and Middle East suppliers are being hemmed in by the Strait of Hormuz blockade. Canada offers largely apolitical, stable supply in a fragmented world with disrupted energy trade flows.

 Vivan Sorab, Clean Tech Lead 

IEA warns oil markets nearing “red zone” by late summer 

  • International Energy Agency Executive Director Fatih Birol warned oil markets could enter a “red zone” by July-August, with 14 million barrels per day disrupted, inventories falling, and no meaningful new Middle East supply entering the market amid the Iran crisis.  

China’s renminbi payment system sees record surge

  • China’s Cross-Border Interbank Payment System (CIPS) processed a record average daily value of RMB920.5 billion (US$135.7 billion) in March, briefly peaking at RMB1.22 trillion and nearly 42,000 transactions in a single day representing a surge in energy trade outside the U.S. dollar system.

Brussels advances implementation of U.S. trade pact 

  • EU lawmakers and member states reached a provisional agreement to implement last year’s U.S.-EU trade arrangement, including safeguards allowing Brussels to suspend tariff reductions if Washington maintains steel and aluminum duties above agreed levels beyond 2026.   

EU approves expanded foreign investment screening powers 

  • The European Parliament approved new foreign investment screening rules covering sectors including AI, semiconductors, quantum, aerospace, energy, and critical infrastructure, broadening scrutiny over third-country investment across the bloc.

Ottawa and Nunavut launch tariff-response workforce program 

  • The governments announced more than $1.5 million in funding for marine-sector training and employment supports tied to tariff-related economic disruption.  

Manitoba opens trade office in India amid diversification push 

  • Manitoba announced plans to establish a trade office in India as provinces continue pursuing direct commercial relationships abroad and reducing reliance on the U.S. market.

—Thomas Ashcroft, Global Policy Lead