

 EN
EN 



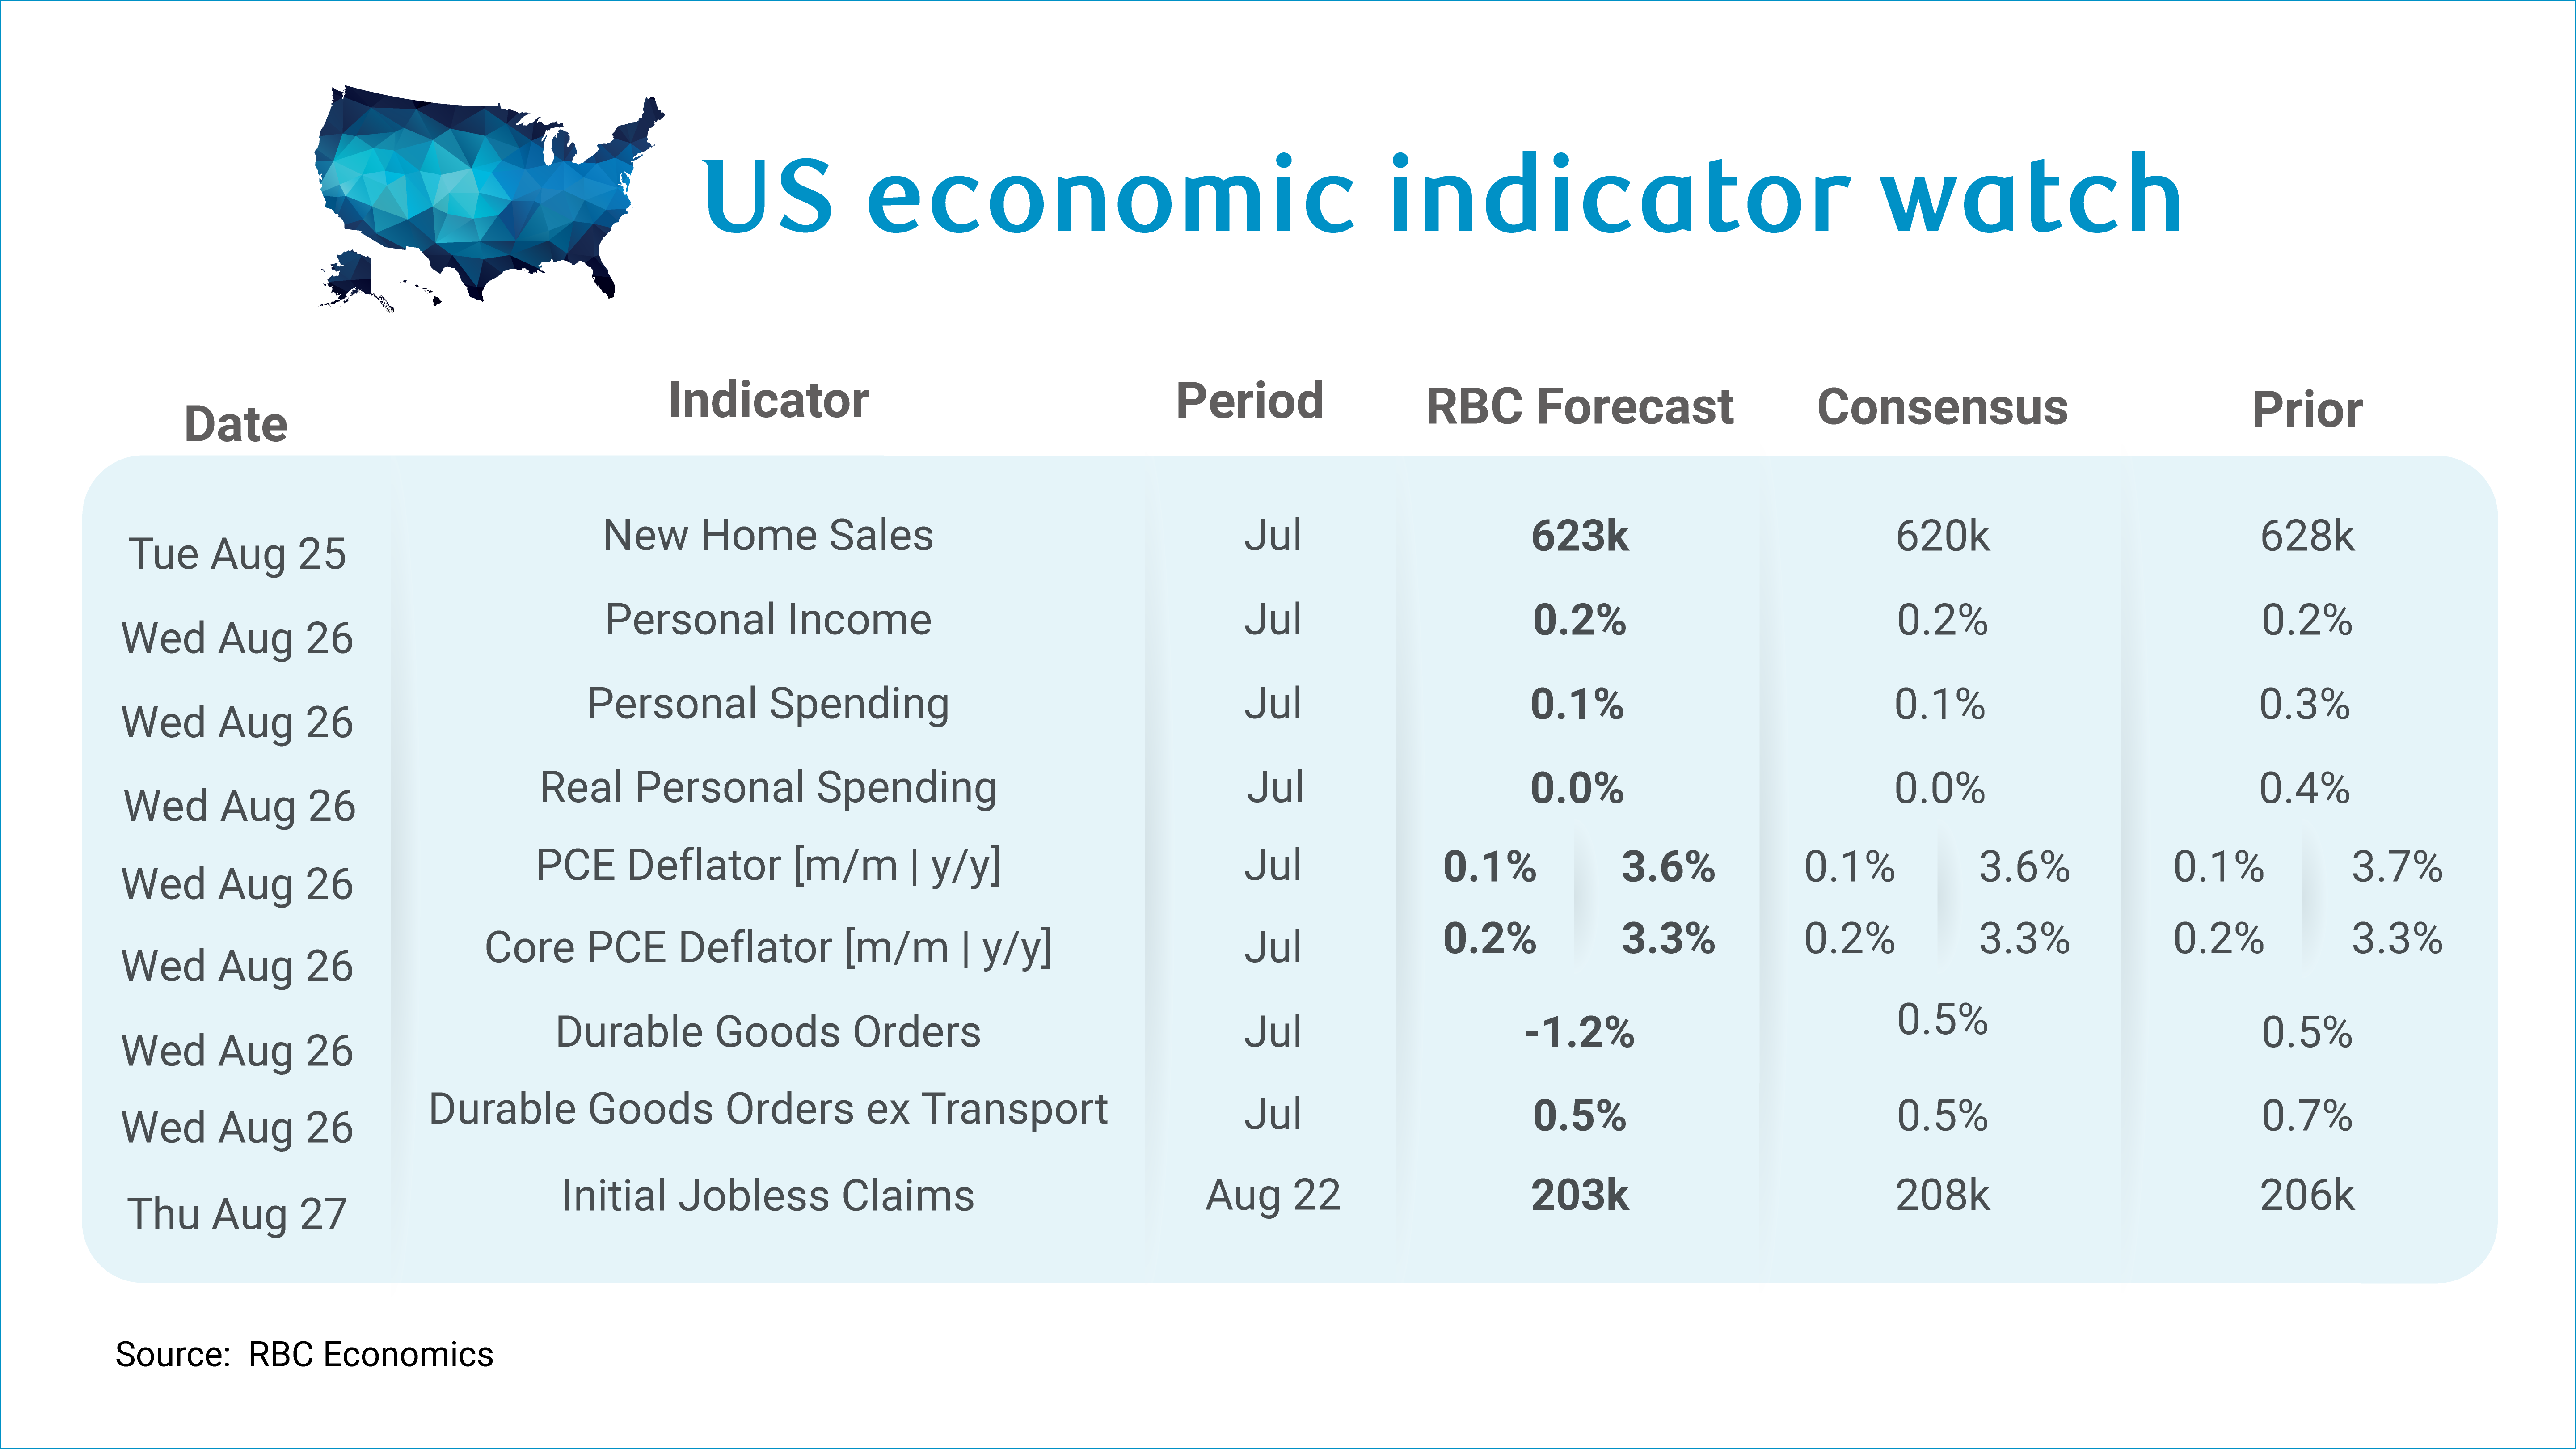
Next week the focus will be on the PCE deflators as inflation pressures remain a top concern. We expect core PCE to report a 0.2% m/m rise, keeping the y/y pace at 3.3%. We look for headline PCE to rise 0.1% m/m, knocking the y/y pace lower to 3.6%. On net we expect the PCE deflators to report in line with CPI – the July core CPI print reported a 0.2% m/m rise that was helped by notable declines in leisure and hospitality related sectors (hotel prices and auto rentals). But those sectors will be less impactful in PCE because of weighting. Importantly, the heavier weighted PPI components that matter most for PCE were a mixed bag.
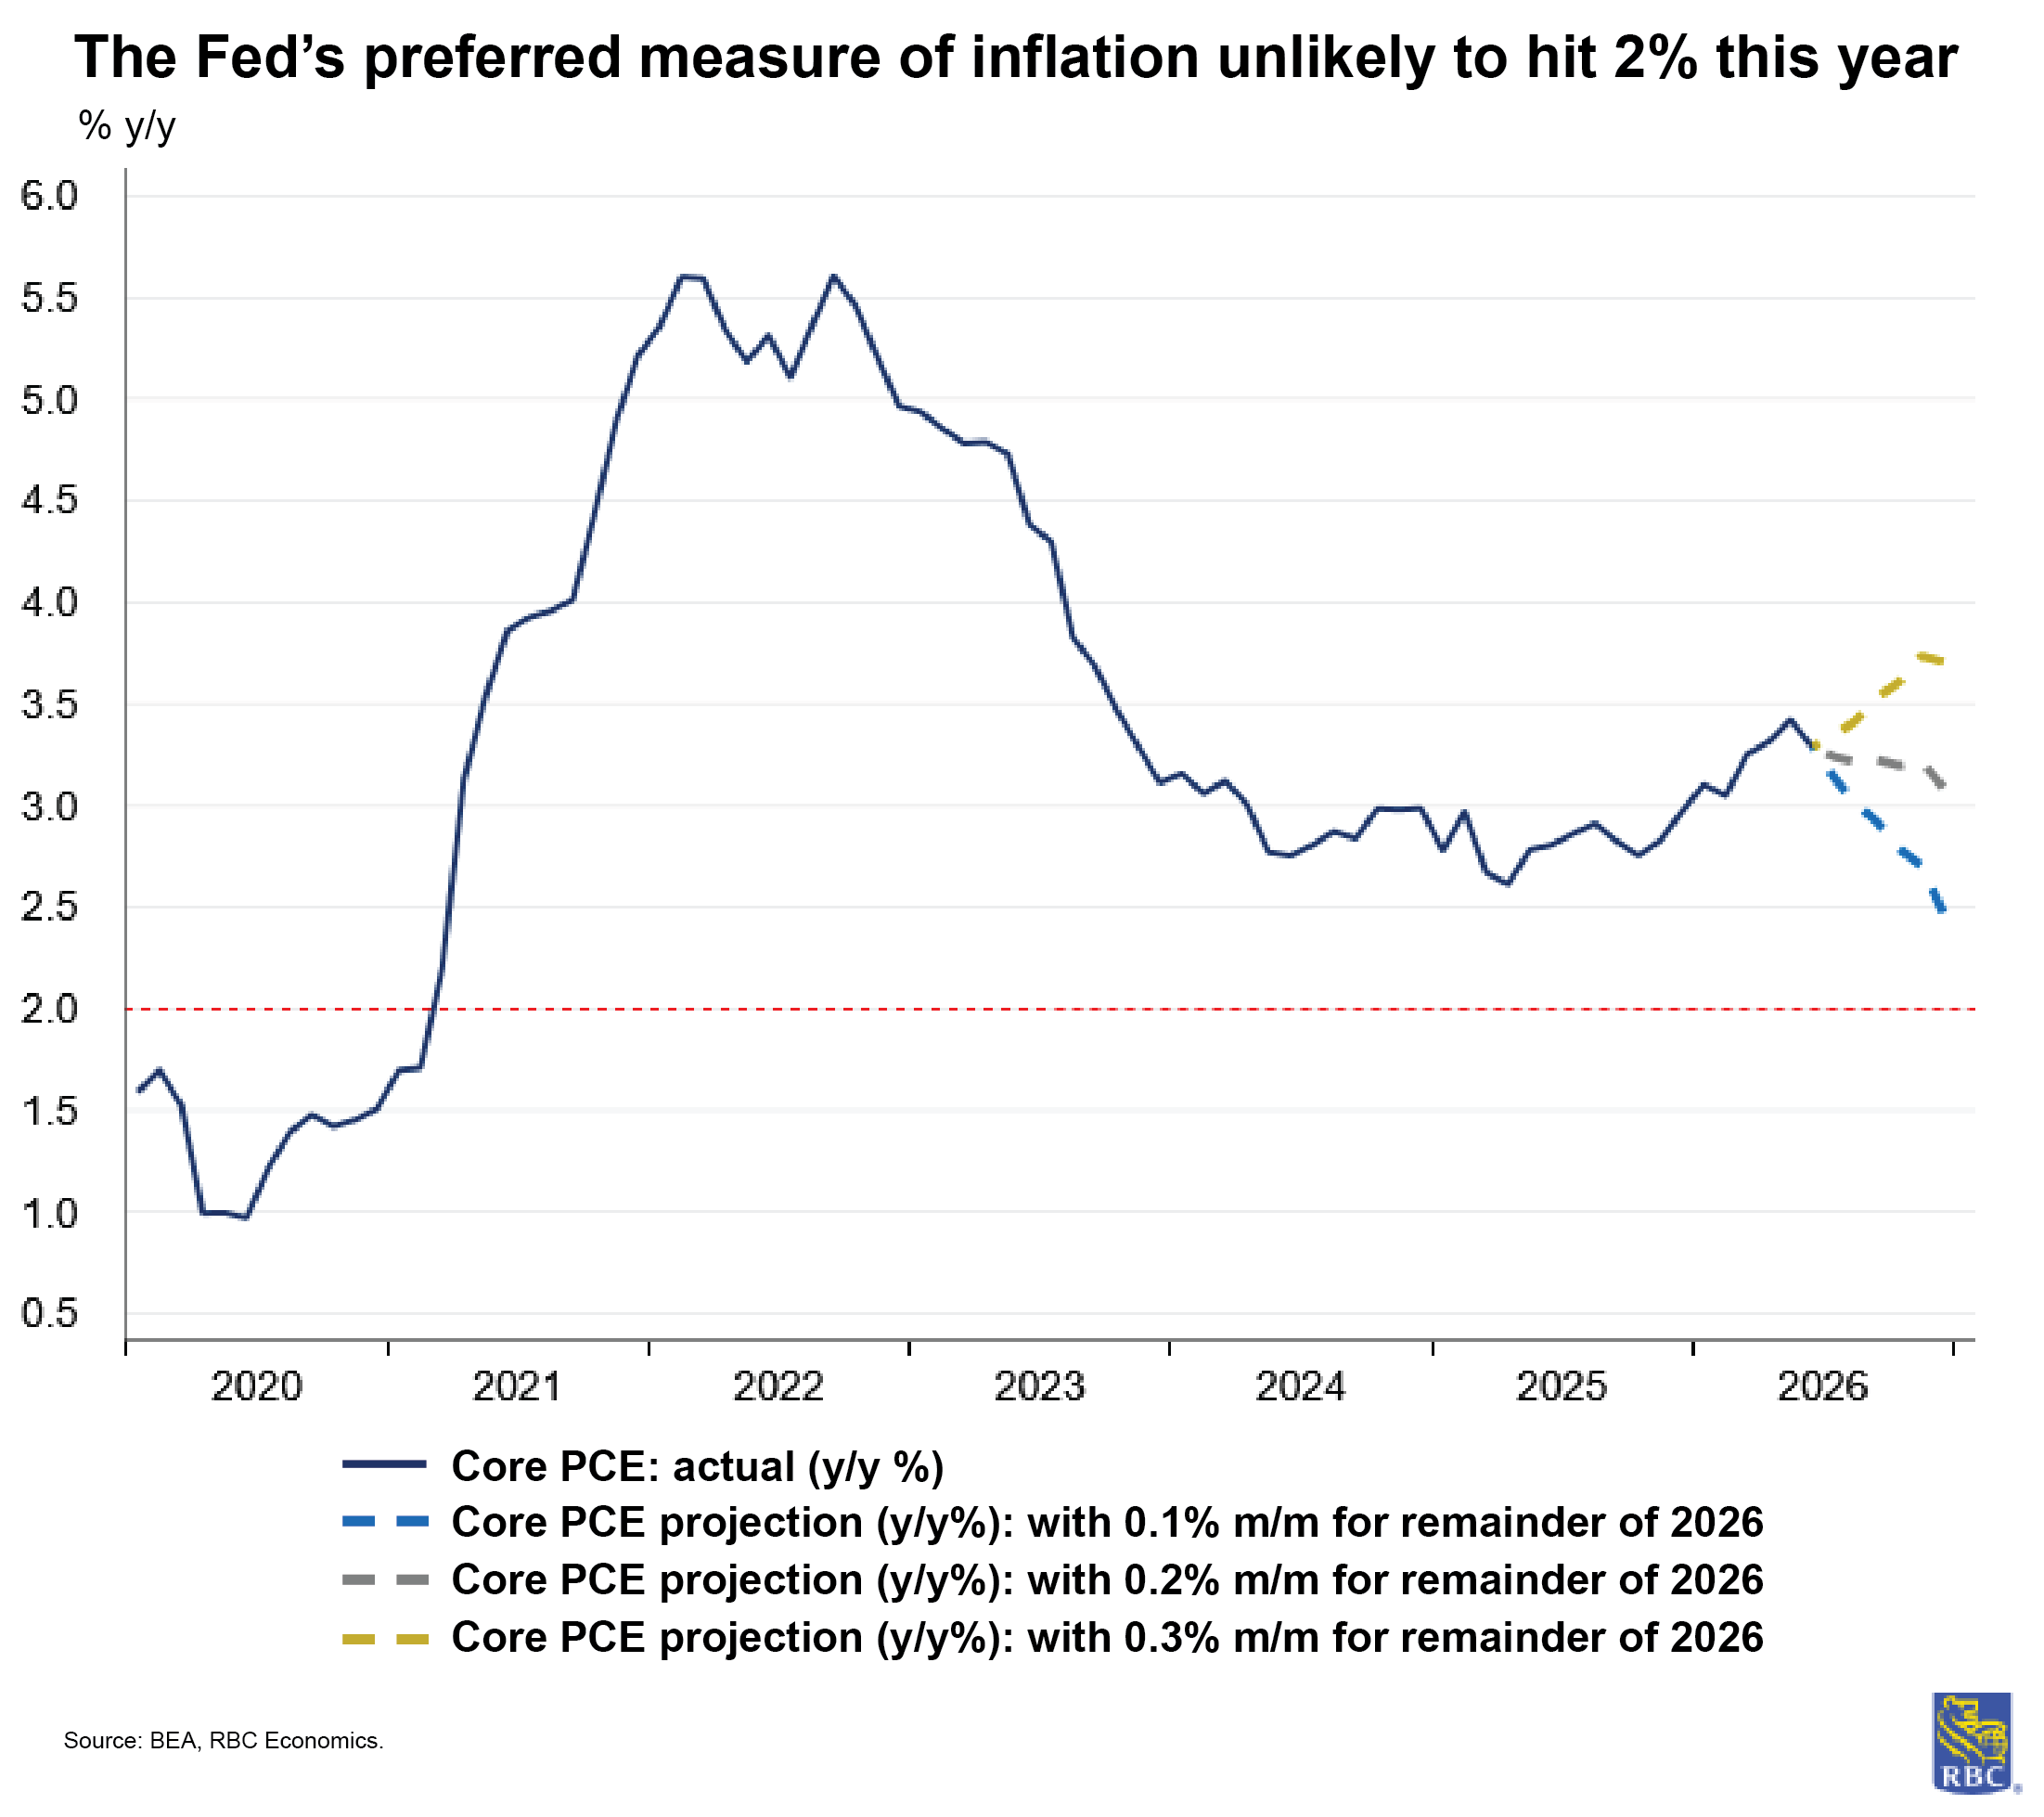
PPI for portfolio management and investment advice spiked in July alongside nursing care. But PPI for hospitals was benign and PPI for domestically scheduled air transportation was negative (in contrast to airline fares in CPI which is due to methodological differences). But the trajectory of y/y pace of core inflation is unlikely to improve this year. Core goods prices re-accelerated in July due to demand-driven technology input price surges, and persistent pressure on energy prices, which we expect will continue to push up transportation costs and weigh on trade margins. A new round of tariffs won’t help the trend. In fact, even in a scenario where core PCE prints 0.1% m/m for the remainder of the year, we would not see core PCE return to the Fed’s 2.0% y/y target (see chart below). Nonetheless, we continue to expect the Fed will remain on pause for the rest of 2026.
On the consumer front, we expect personal spending will continue to slow to 0.1% m/m in July, as the tailwinds from tax returns dissipate, and elevated gas prices weigh on household budgets. In part, the July slowdown reflects goods spending that was pulled forward – Amazon Prime Day fell in June instead of July this year, and Apple announced price increases at the end of June. The fall in gas prices also contributed to the decline in retail sales, but in the broader spending report, we continue to monitor the strength in services sector spending (we look for services spending to rise 0.4% m/m) against the backdrop of consumer stress.
In our view, the US demand backdrop remains intact, supported by high-income households and retirement spending. We see this cohort driving recreational services spending as they continue to prioritize experiences. Transportation spending will likely moderate alongside energy prices, though higher utility costs and summer heatwaves will likely offset some of that reprieve. Meanwhile, strong gains in the S&P 500 should translate to a hotter financial services print.
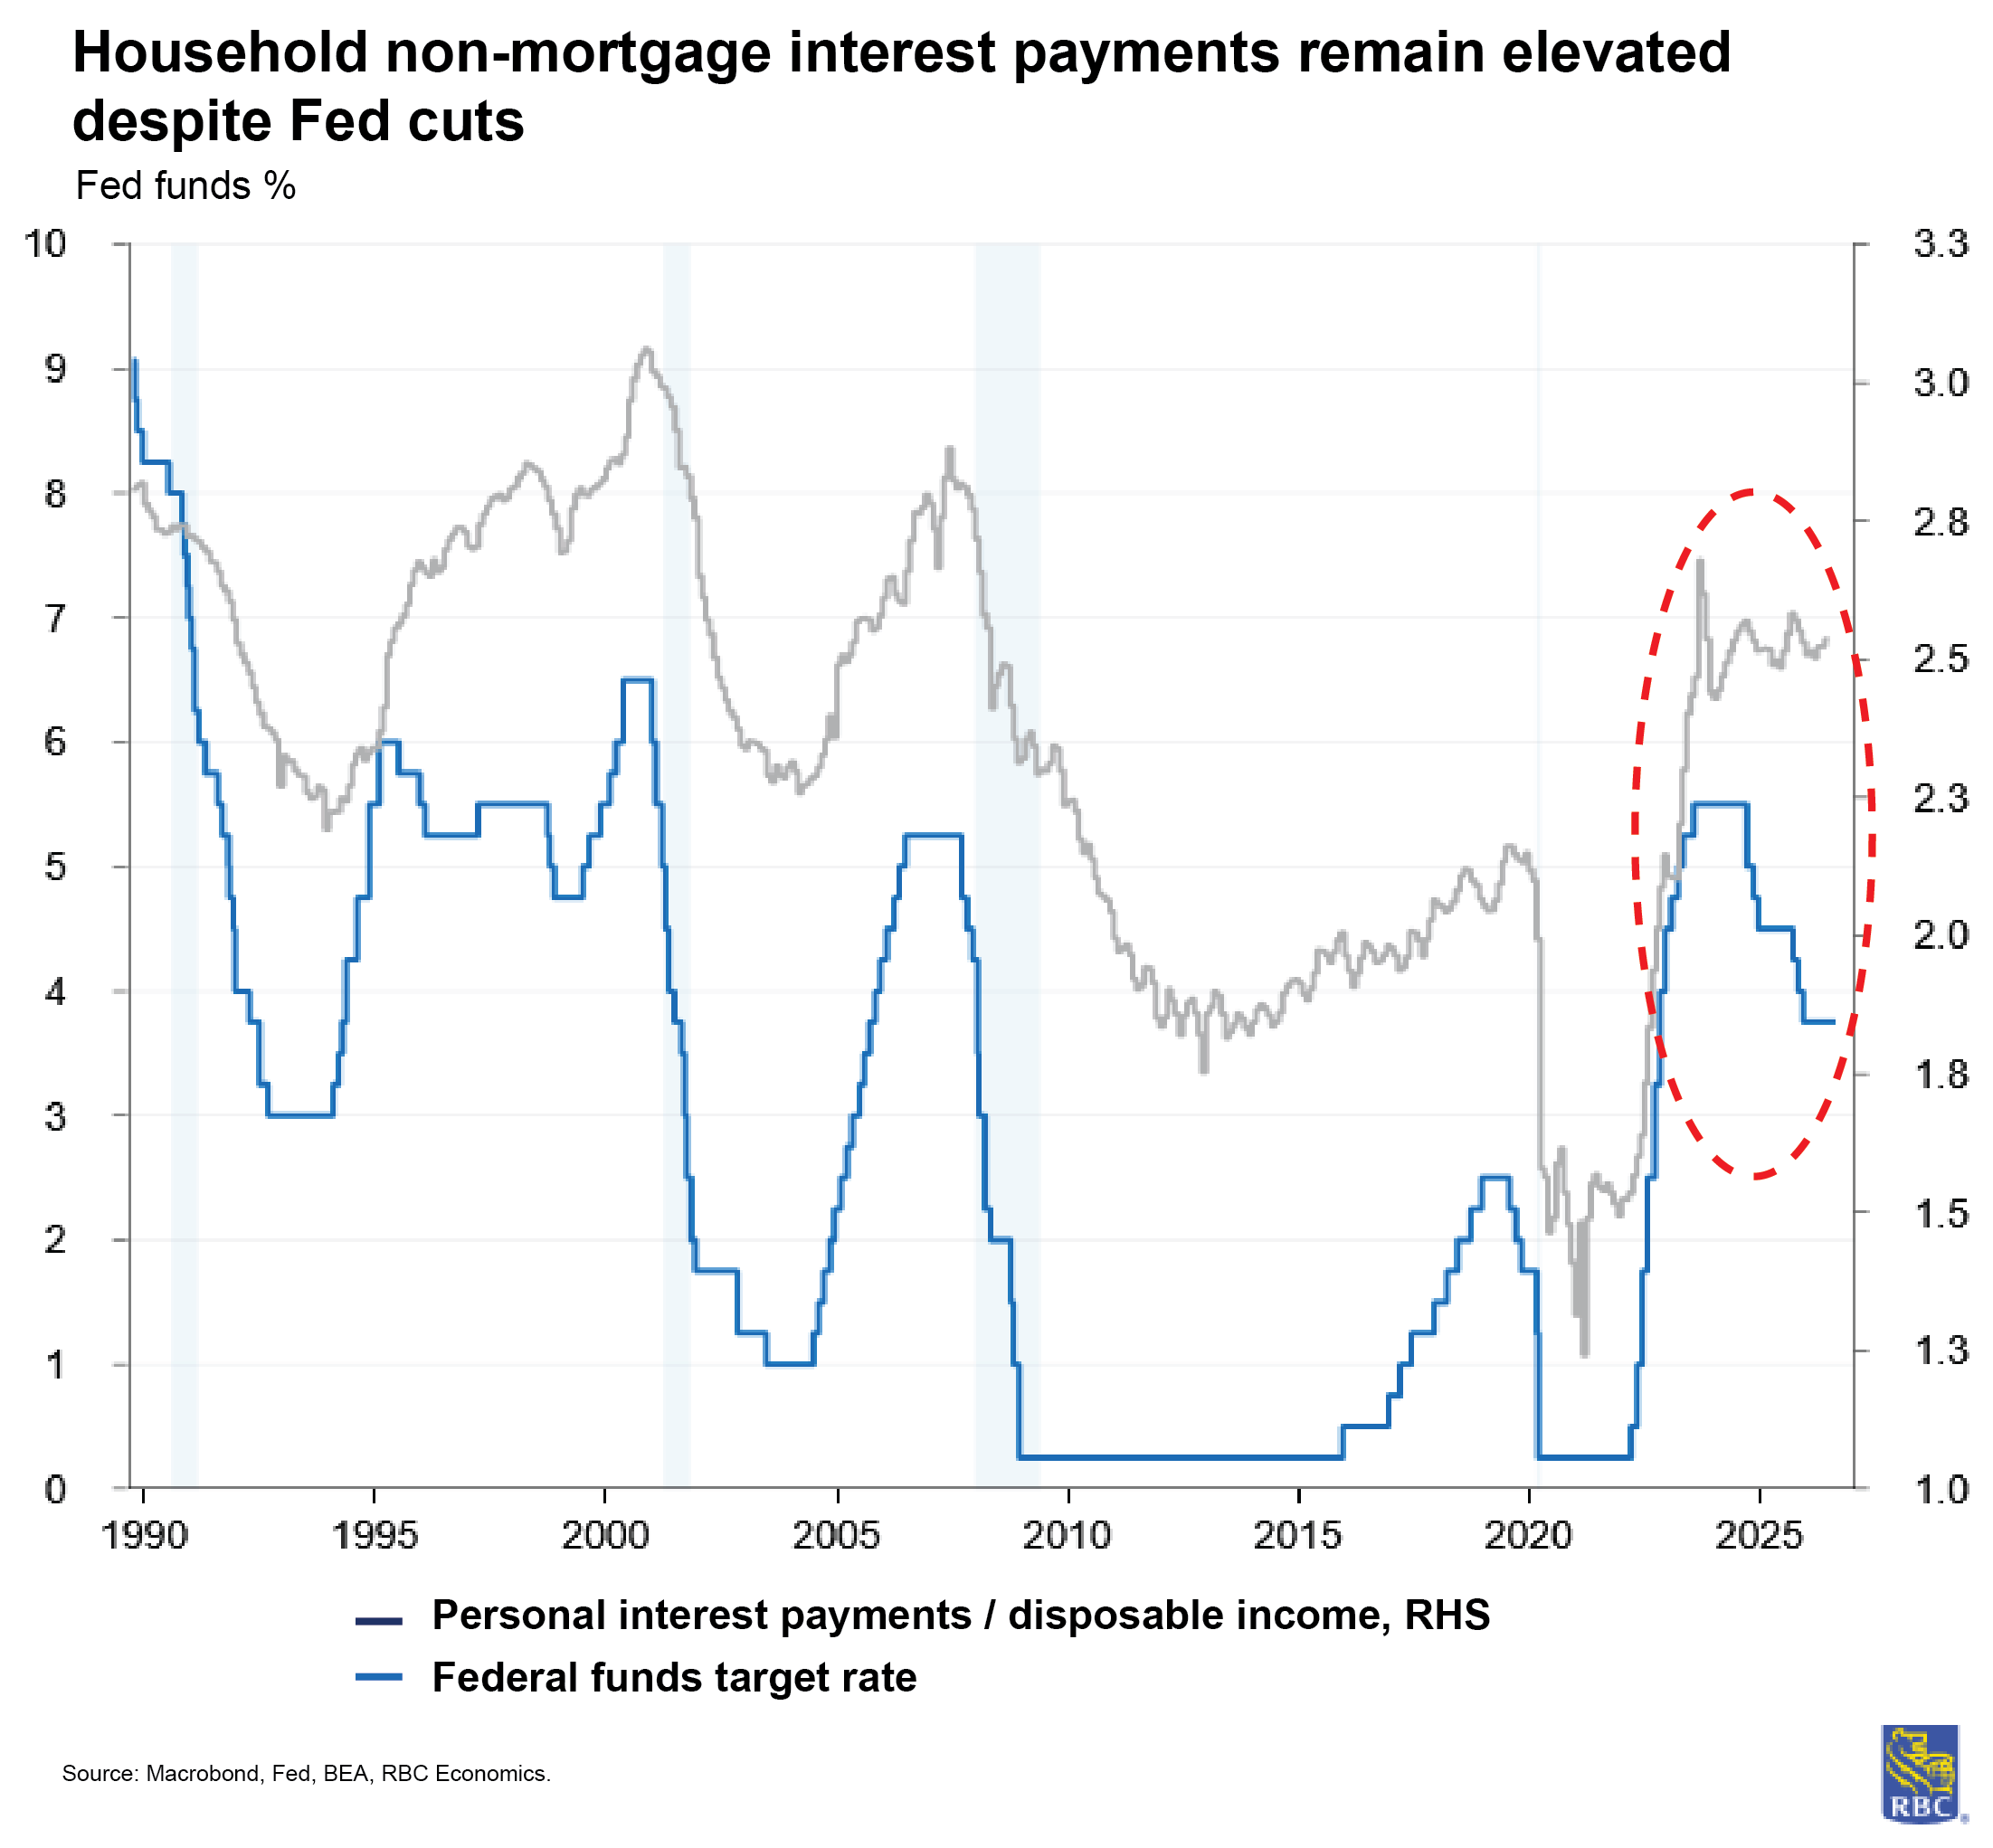
But the personal saving rate has seen a steady decline since 2024 and currently sits at a concerning 2.7%, meaning an important buffer is eroding. Another headwind for households is the non-mortgage interest expense payment (i.e., interest on student and auto loans, credit cards, etc.). It has been hovering around 2.5% of disposable personal income for the past two years despite the Fed’s rate cuts. If the Fed were to hike interest rates, the interest payment burden would likely climb to concerning levels.
About the authors:
Mike Reid is Head of US Economics at RBC. He is responsible for generating RBC’s US economic outlook, providing commentary on macro indicators, and producing written analysis around the economic backdrop.
Carrie Freestone is a Senior US Economist at RBC. She is responsible for generating RBC’s US economic forecasts across GDP, employment, and inflation, and providing macro commentary through publications, presentations, and the media.
Imri Haggin is an US Economist at RBC, where he focuses on thematic research. His prior work has centered on consumer credit dynamics and treasury modeling, with an emphasis on leveraging data to understand behavior.
This article is intended as general information only and is not to be relied upon as constituting legal, financial or other professional advice. The reader is solely liable for any use of the information contained in this document and Royal Bank of Canada (“RBC”) nor any of its affiliates nor any of their respective directors, officers, employees or agents shall be held responsible for any direct or indirect damages arising from the use of this document by the reader. A professional advisor should be consulted regarding your specific situation. Information presented is believed to be factual and up-to-date but we do not guarantee its accuracy and it should not be regarded as a complete analysis of the subjects discussed. All expressions of opinion reflect the judgment of the authors as of the date of publication and are subject to change. No endorsement of any third parties or their advice, opinions, information, products or services is expressly given or implied by Royal Bank of Canada or any of its affiliates.
This document may contain forward-looking statements within the meaning of certain securities laws, which are subject to RBC’s caution regarding forward-looking statements. ESG (including climate) metrics, data and other information contained on this website are or may be based on assumptions, estimates and judgements. For cautionary statements relating to the information on this website, refer to the “Caution regarding forward-looking statements” and the “Important notice regarding this document” sections in our latest climate report or sustainability report, available at: https://www.rbc.com/community-social-impact/reporting-performance/index.html. Except as required by law, none of RBC nor any of its affiliates undertake to update any information in this document.

