

 EN
EN 


Bottom Line:
The July CPI print was a make-it-or-break-it print ahead of the Fed’s September meeting and at +0.2% (knocking the y/y pace down to 2.5%), we expect core inflation will preserve Fed optionality. Still, the details perhaps tell a slightly less reassuring narrative beneath the surface.
Core inflation was not exclusively a services story in July as core goods also re-accelerated. Of course, part of this was a computer and peripherals/smartphones story after Apple raised prices at the end of June. Still, Section 232 tariffs are impacting the auto sector with higher motor vehicle parts and equipment prices spilling over into motor vehicle maintenance and repair, so this is not likely a one-off. Higher input costs are clearly showing up in goods inflation, and this will be a persistent pressure this year. At the same time, services remained sticky as rents and OER were elevated in the index.
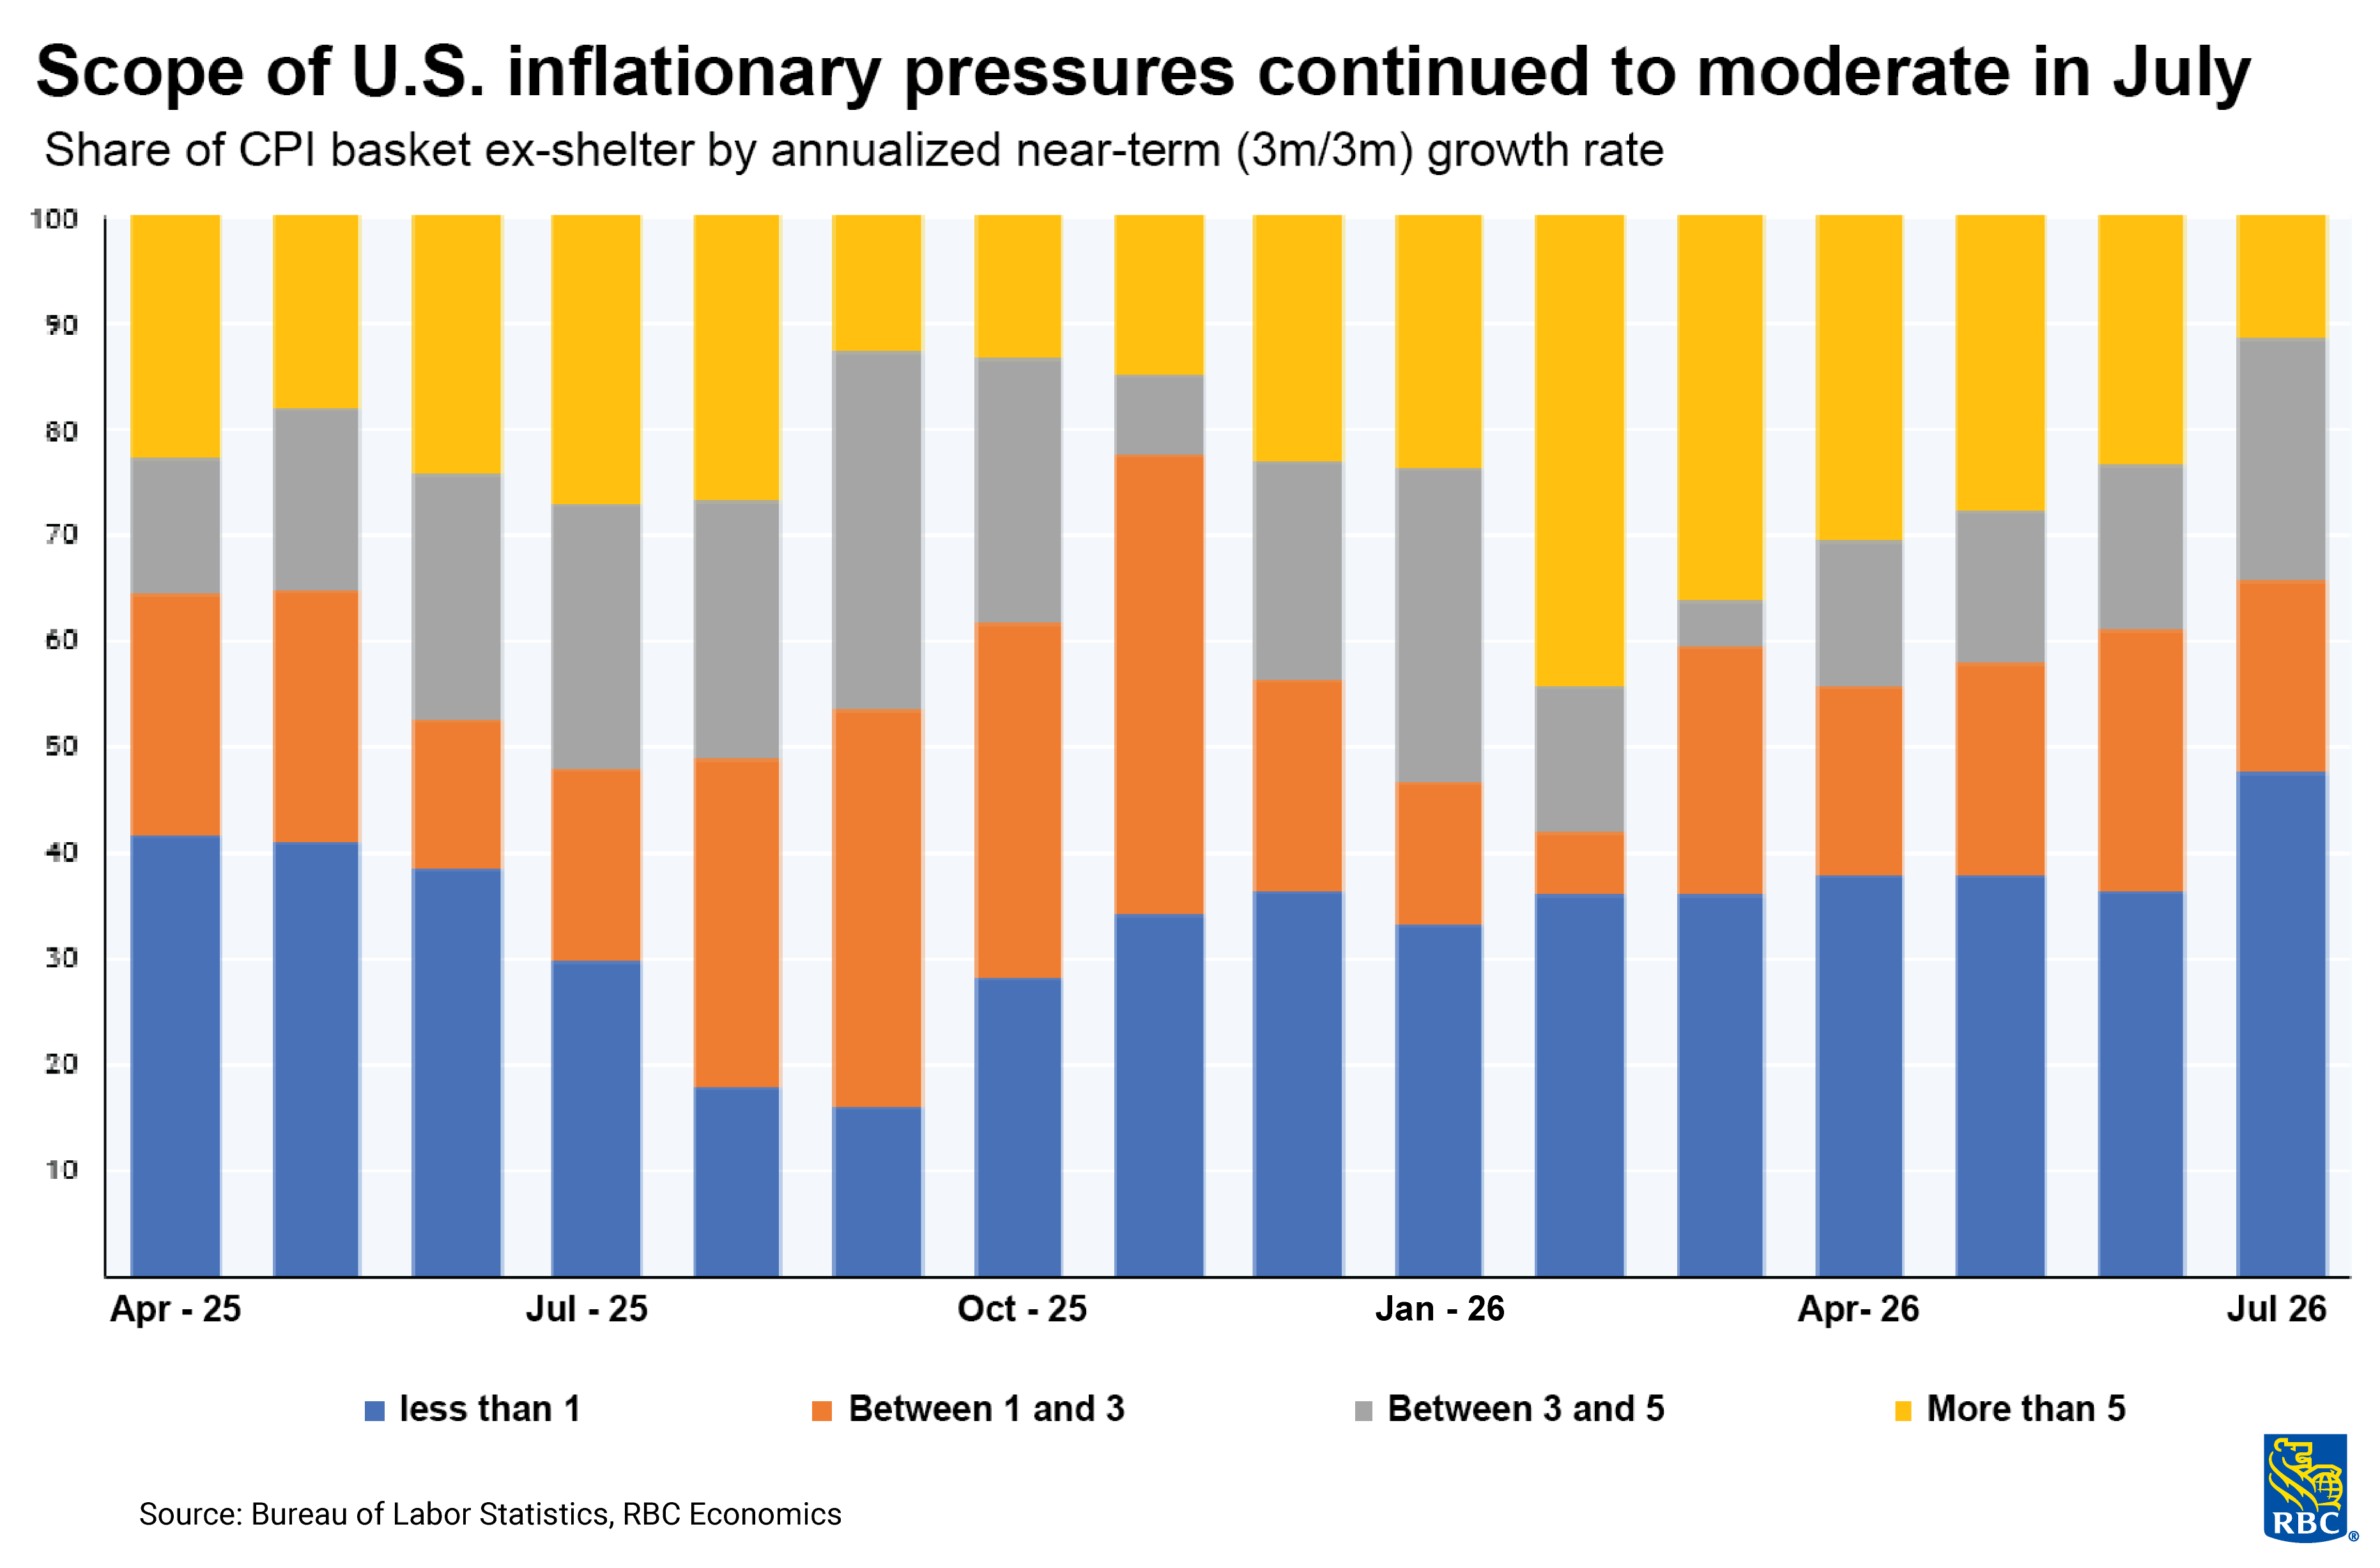
The good news is that a decelerating breadth of inflation since earlier this year and lower supercore continue to illustrate continued improvement this year. Headline’s annual pace of inflation also moderated, to 3.4% from 3.5%, but this improvement was more than accounted for by reductions in prices for energy commodities ( -2.9% m/m).
Overall, the July inflation report was mixed. On first glance, the print is reassuring, but beneath the surface, product-specific pressures are yellow flags for the trajectory of core goods.
There are three core themes that stood out in today’s report:
1) In July, core inflation was no longer exclusively a services story
-
Core goods CPI previously ran flat to negative for three consecutive months, but in July, core goods rose +0.2% m/m.
-
Pressures were pronounced in trade-exposed sectors affected by Section 232 tariffs including motor vehicle parts and equipment (+0.6% m/m), used cars and trucks (+0.4% m/m), and recreation commodities (+0.6% m/m). And we are now seeing spillovers from higher input costs into some services sectors like motor vehicle maintenance and repair (+0.6% m/m).
-
And computers, peripherals, and smart home assistants rose a whopping +3.5% m/m alongside a surge in prices for smartphones (+1.1%). This is unsurprising given that Apple announced price increases on June 25th, and we saw spikes in computers, peripherals, and smart home assistant devices and smartphones. This is likely a direct reflection of higher input prices as seen in PPI.
2) But core services remained sticky – and relief in shelter has yet to arrive
-
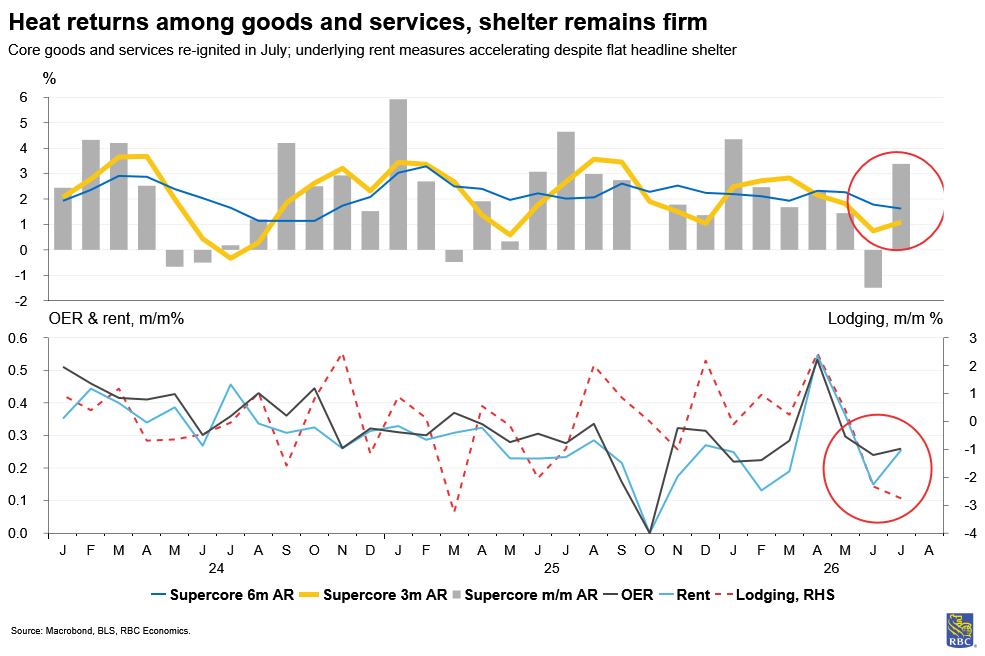
Core services remained sticky at +0.23%. Both rent of primary residence and OER accelerated (+0.26% m/m)
-
Still, we saw a meaningful retreat in lodging away from home as the World Cup wound down.
-
We continue to expect that cooler rents and home prices will flow through to housing with a lag. We expect that the most meaningful deceleration will be felt later this year and into 2027.
-
Aside from housing, public transportation exerted upward pressure on core services as well in July, with airfares up a whopping +2.2% m/m despite a continued improvement in energy prices.
-
In the long term, we remain concerned that sticky wage growth will limit core services disinflation.
3) Still…the July inflation print should be sufficient to preserve Fed optionality
-
Despite less-than-reassuring details on the core goods front, the July data illustrates that core inflation has been cooling meaningfully since the beginning of the year.
-
Importantly, the year-over-year pace of supercore inflation continued to decelerate in July and has fallen by 0.9 percentage points in two months (now at 2.8%). Still, the month-over-month pace rebounded (to +0.2% in July) after registering negative in June.
-
The breadth of CPI accelerated relative to one-month ago but remains in-line with pre-COVID levels and well-below levels seen earlier this year. Currently, 36% of CPI basket items (ex shelter) are reporting price-growth at or above 3%. We have seen this diffusion index moderate meaningfully this year.
-
According to RBC Rates Strategy, a core inflation print at +0.22% should be “enough to keep staving off a hike” after flagging +0.25% as the make-or-break line for a hold/hike in September. In this context, we expect that this morning’s print will preserve Fed optionality. But it does not guarantee a path to 2% either.
About the authors:
Mike Reid is Head of US Economics at RBC. He is responsible for generating RBC’s U.S. economic outlook, providing commentary on macro indicators, and producing written analysis around the economic backdrop.
Carrie Freestone is a Senior US Economist at RBC. She is responsible for generating RBC’s US economic forecasts across GDP, employment, and inflation, and providing macro commentary through publications, presentations, and the media.
Imri Haggin is an US Economist at RBC, where he focuses on thematic research. His prior work has centered on consumer credit dynamics and treasury modeling, with an emphasis on leveraging data to understand behavior.
This article is intended as general information only and is not to be relied upon as constituting legal, financial or other professional advice. The reader is solely liable for any use of the information contained in this document and Royal Bank of Canada (“RBC”) nor any of its affiliates nor any of their respective directors, officers, employees or agents shall be held responsible for any direct or indirect damages arising from the use of this document by the reader. A professional advisor should be consulted regarding your specific situation. Information presented is believed to be factual and up-to-date but we do not guarantee its accuracy and it should not be regarded as a complete analysis of the subjects discussed. All expressions of opinion reflect the judgment of the authors as of the date of publication and are subject to change. No endorsement of any third parties or their advice, opinions, information, products or services is expressly given or implied by Royal Bank of Canada or any of its affiliates.
This document may contain forward-looking statements within the meaning of certain securities laws, which are subject to RBC’s caution regarding forward-looking statements. ESG (including climate) metrics, data and other information contained on this website are or may be based on assumptions, estimates and judgements. For cautionary statements relating to the information on this website, refer to the “Caution regarding forward-looking statements” and the “Important notice regarding this document” sections in our latest climate report or sustainability report, available at: https://www.rbc.com/community-social-impact/reporting-performance/index.html. Except as required by law, none of RBC nor any of its affiliates undertake to update any information in this document.

