
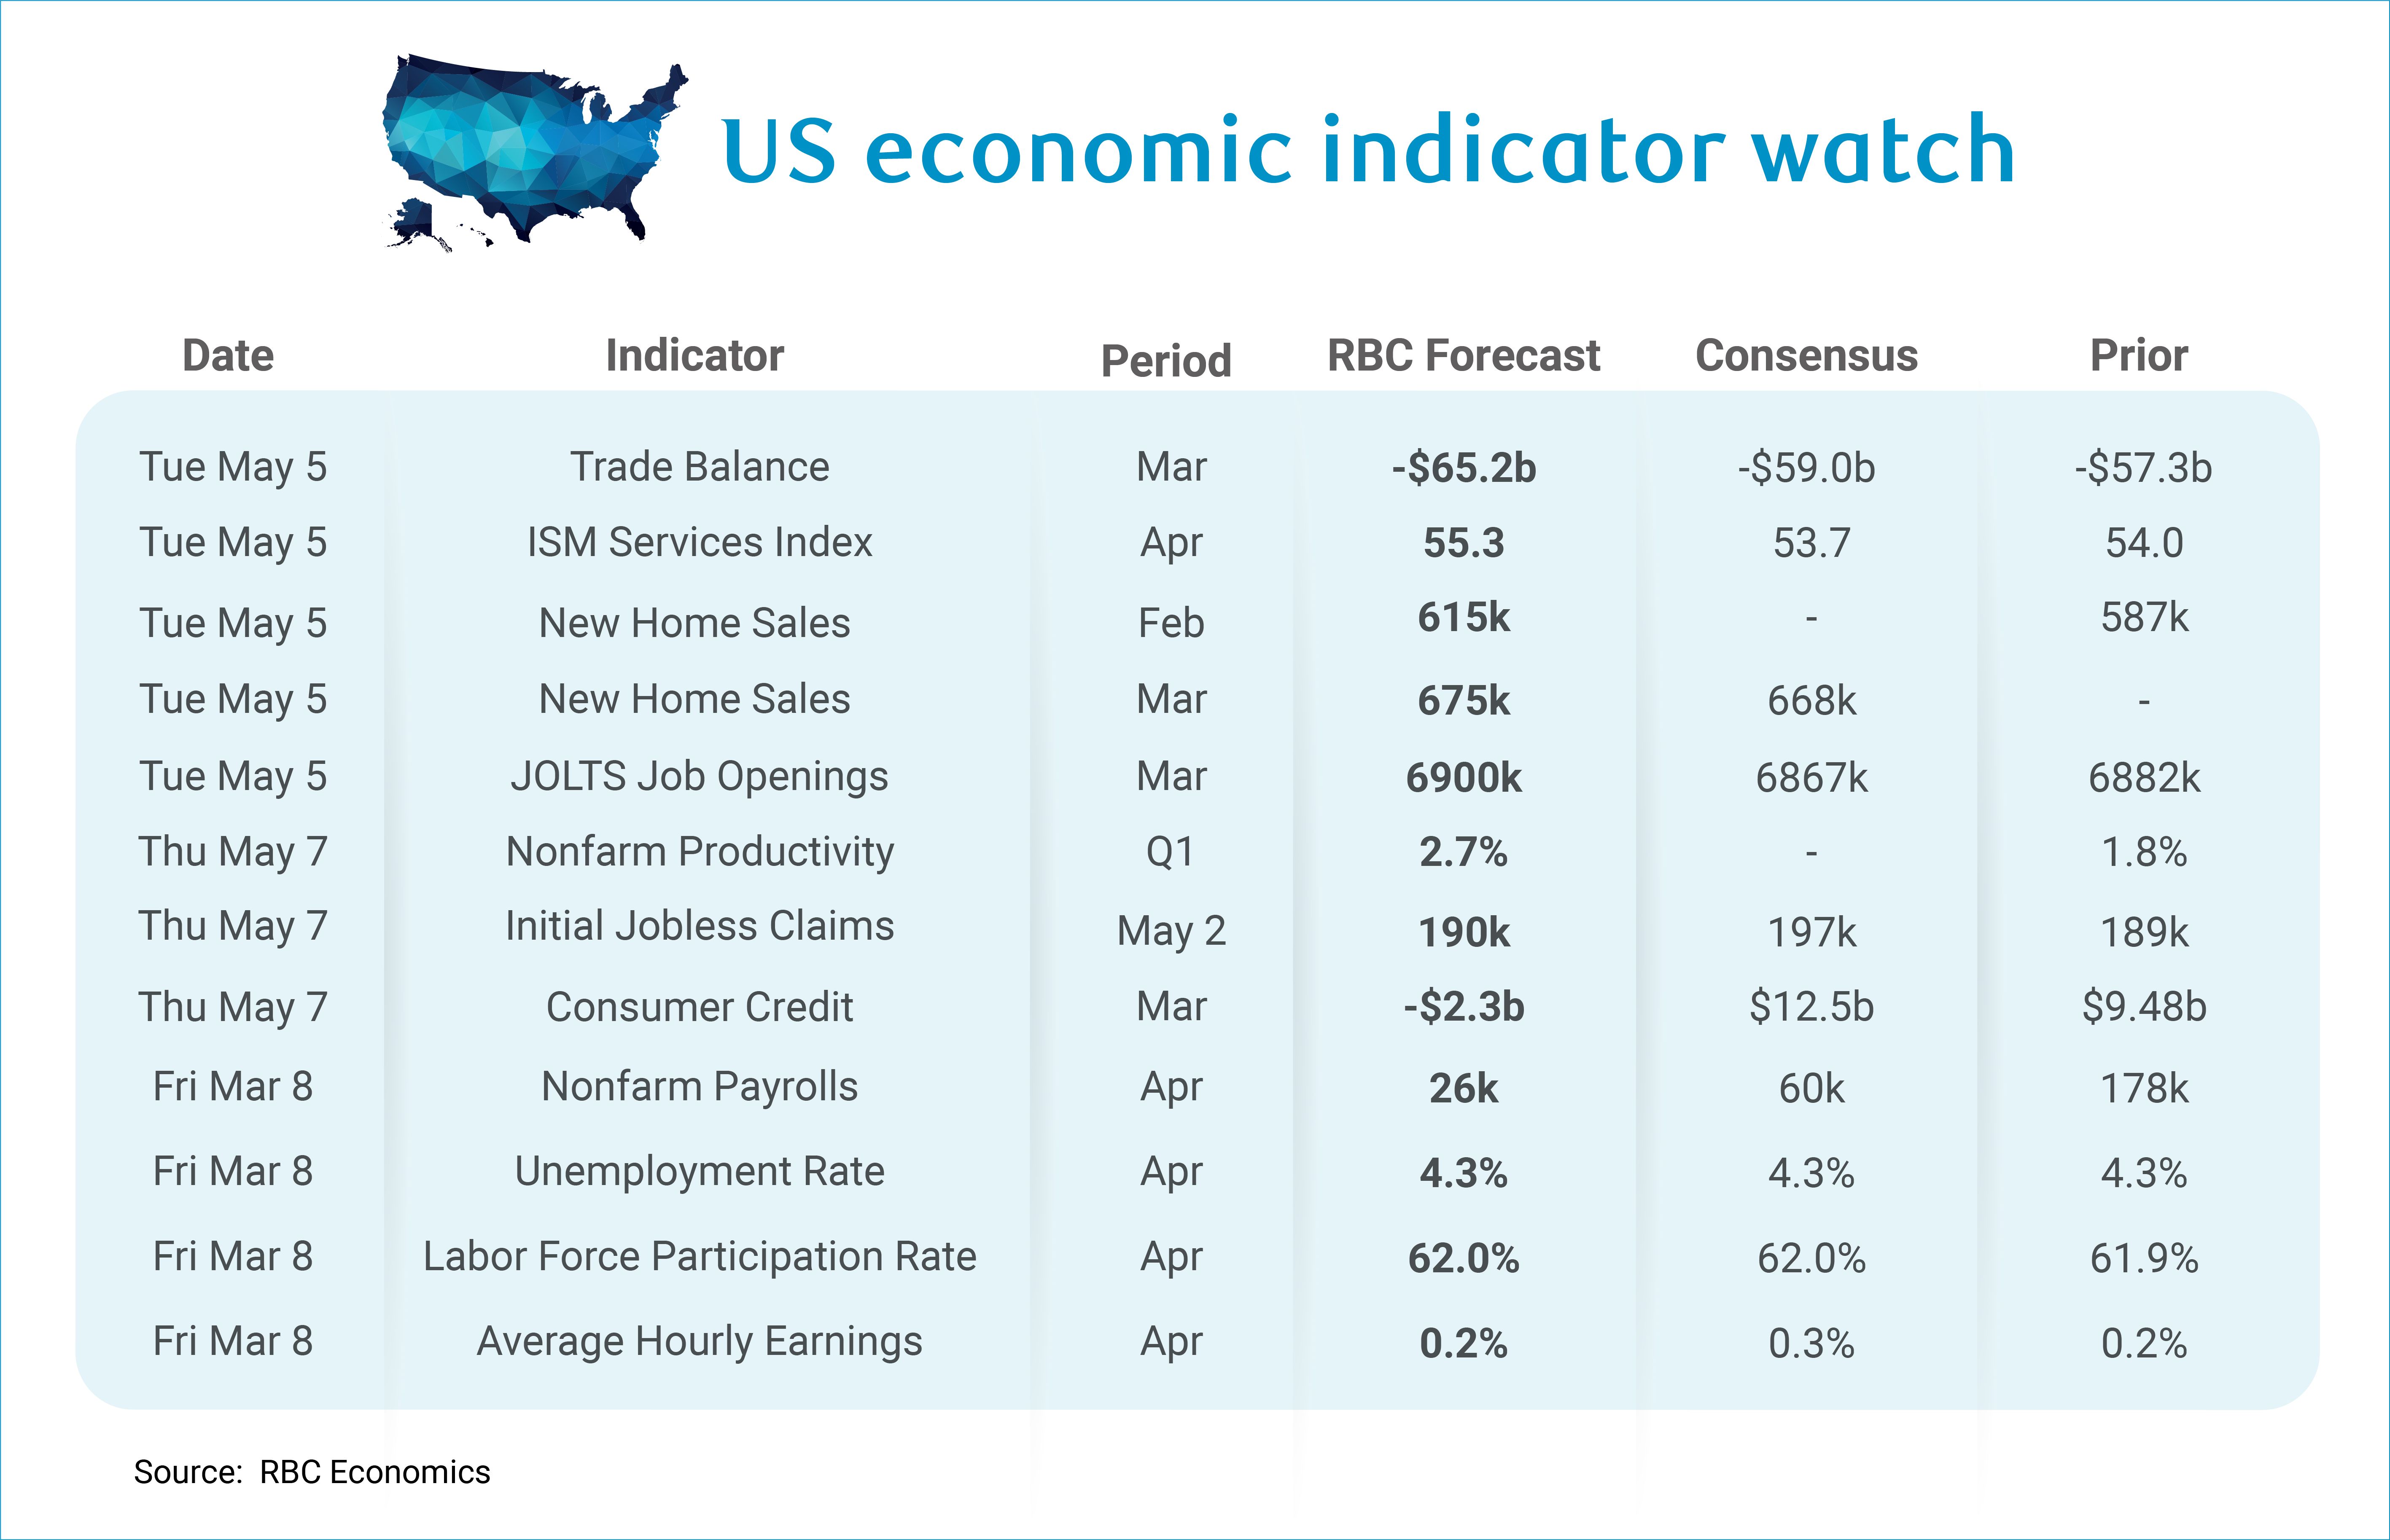
Next week the focus will be on the employment report. We expect nonfarm payrolls added +26K jobs—a number which, in the current environment of low immigration and high retirements, is roughly breakeven. In this vein, we expect the unemployment rate to hold steady at 4.3%, supported by a modest decline in jobless claims between the reference weeks for March and April.
The bulk of job creation remains concentrated in structural health care hiring. Strip that out, and the picture is concerning. Over the past six months, the US economy has averaged just +15K jobs per month – and hiring excluding health care has been negative. Trade-exposed sectors—including wholesale trade, transportation and warehousing, and several manufacturing industries (fabricated metals, machinery, motor vehicles and parts, food and beverage)—have been shedding jobs by and large since Liberation Day. Cyclically sensitive services sectors have followed a similar pattern. The weakness in payrolls combined with the extremely low jobless claims suggests that most sectors are not backfilling positions vacated by retirees. This likely reflects the uncertainty paralysis amid mounting external shocks – firms do not tend to hire when facing rising input costs – and the oil shock is adding to the pressures.
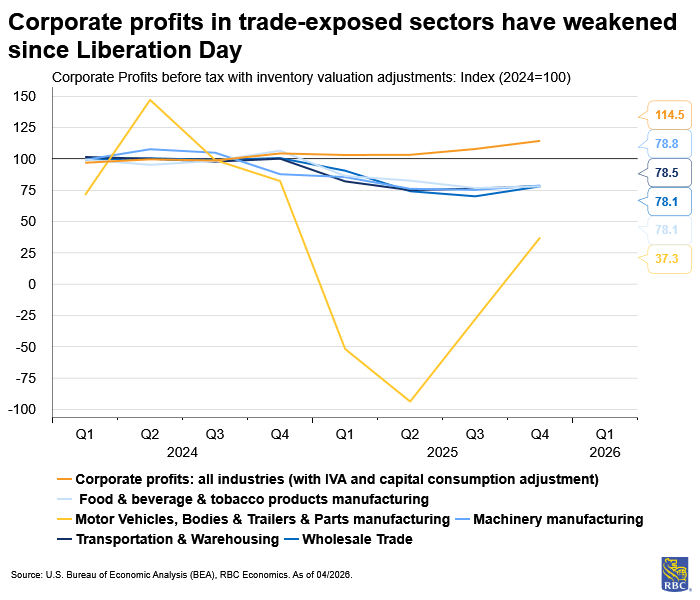
So long as health care hiring holds up (and we expect it will), the unemployment rate will likely move sideways. But downside risks prevail, especially as firms face higher input costs. We highlighted that a corporate profit squeeze from rising costs due to external shocks (tariffs and now higher energy prices) poses downside risk to the US labor market. Since 2024, we have seen corporate profits weaken in trade-exposed sectors including wholesale trade, transportation and warehousing, and several manufacturing sectors (machinery, motor vehicles and parts, and food and beverage and tobacco products). Firms facing margin pressure are likely to reduce costs, and labor is often an easy target. For now, the labor market appears to be steady but if cost pressures intensify and are not fully passed on, the steady foundation could erode quickly.
Outside of nonfarm payrolls and unemployment, here’s what else we’re watching:
-
The US trade deficit likely widened to -$65.2 billion in the month of March. The advanced goods trade data for March flagged a material ramp-up in goods led by a variety of sectors including motor vehicle imports, food, industrial supplies, and capital goods. Goods exports rose as well, but at a slower pace, meaning the trade gap is poised to widen. The overturn of IEEPA created a window for businesses to import goods without tariffs (at least those covered by IEEPA), contributing to the surge.
-
We expect to see an improvement in the ISM Services Index in April. Both Texas and Philly Fed regional surveys continued to point to contractions, but at a slower pace. The Richmond regional survey held steady, and Kansas City pointed to continued expansion, though at a slightly slower pace. But we do expect to see the prices paid index continue to rise due to higher oil prices.
-
We get two months’ worth of new home sales data for both February and March and expect sales to improve slightly heading into the spring. Still, we expect the housing market will remain frozen in 2026, especially following the recent uptick in mortgage rates.
-
JOLTs data for March will be stale, but we do not anticipate that we will see much movement in the job openings data. Job openings have largely trended sideways over the past year, consistent with a low net new hire, low fire backdrop.
-
Nonfarm productivity is expected to continue to grow at a solid clip in Q1 (we forecast +2.7% quarter-over-quarter). An exceptionally tight labor market has limited the ability of firms to ramp up hiring to produce more output. This means that labor-intensive sectors will increasingly rely on higher labor productivity (and will increasingly be investing in labor-augmenting capital and IP) in order to boost growth.
-
Initial Jobless Claims data likely continued to trend sideways during the week of May 2nd – we expect to see claims land at 190k. Claims trended slightly lower over the past month which, alongside a low unemployment rate, suggests that while firms are not ramping up hiring , layoffs are not widespread either.
-
Consumer Credit utilization likely fell by -$2.3 billion in March after ticking up in February. The March data coincides with peak tax return season, and we expect many consumers will use their returns to pay down debt. Still, a meaningful decline in the personal savings rate suggests to 3.3% in March suggests that households are increasingly relying on savings to afford higher gas prices, offsetting spending a spending tailwind from those tax returns.
About the Authors:
Mike Reid is Head of US Economics at RBC. He is responsible for generating RBC’s US economic outlook, providing commentary on macro indicators, and producing written analysis around the economic backdrop.
Carrie Freestone is a Senior US Economist at RBC. Carrie is responsible for projecting key US indicators including GDP, employment, consumer spending and inflation for the US. She also contributes to commentary surrounding the US economic backdrop which she delivers to clients through publications, presentations, and the media.
Imri Haggin is an US Economist at RBC, where he focuses on thematic research. His prior work has centered on consumer credit dynamics and treasury modeling, with an emphasis on leveraging data to understand behavior.
This article is intended as general information only and is not to be relied upon as constituting legal, financial or other professional advice. The reader is solely liable for any use of the information contained in this document and Royal Bank of Canada (“RBC”) nor any of its affiliates nor any of their respective directors, officers, employees or agents shall be held responsible for any direct or indirect damages arising from the use of this document by the reader. A professional advisor should be consulted regarding your specific situation. Information presented is believed to be factual and up-to-date but we do not guarantee its accuracy and it should not be regarded as a complete analysis of the subjects discussed. All expressions of opinion reflect the judgment of the authors as of the date of publication and are subject to change. No endorsement of any third parties or their advice, opinions, information, products or services is expressly given or implied by Royal Bank of Canada or any of its affiliates.
This document may contain forward-looking statements within the meaning of certain securities laws, which are subject to RBC’s caution regarding forward-looking statements. ESG (including climate) metrics, data and other information contained on this website are or may be based on assumptions, estimates and judgements. For cautionary statements relating to the information on this website, refer to the “Caution regarding forward-looking statements” and the “Important notice regarding this document” sections in our latest climate report or sustainability report, available at: https://www.rbc.com/community-social-impact/reporting-performance/index.html. Except as required by law, none of RBC nor any of its affiliates undertake to update any information in this document.
