

 EN
EN 


Why we’re focused on PCE
As the Fed’s preferred measure of inflation, PCE is critical to the near-term path of monetary policy. PCE is distinct from CPI, and given differences in scope and weighting, year-over-year core PCE growth has been running above core CPI—an unusual dynamic that methodological changes to the PCE could help address.
We continue to monitor PCE for signs of pricing pass-through from tariffs and higher energy costs, noting that PCE better captures consumer substitution effects in response to rising prices.
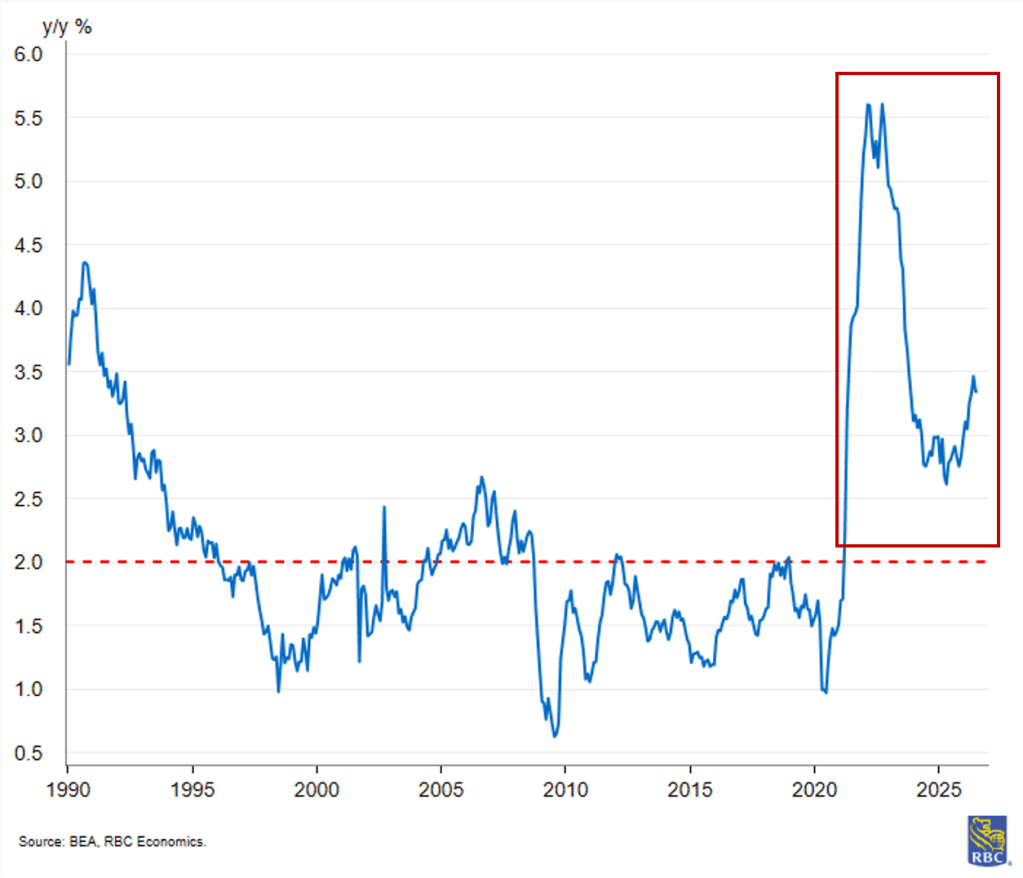
Currently at 3.3% year-over-year, core PCE has remained above the Fed’s 2% target for over five years. Below, we take a deep dive into the PCE deflators, discussing what they measure, how they are calculated, and how they differ from CPI.
Core PCE has exceeded the Fed’s 2% target for over 5 years
What are PCE deflators?
The PCE price index is designed to measure how the cost of consumer goods and services changes over time. PCE deflator data is released monthly in the BEA’s Personal Income and Spending report, typically at the end of each month. It is the last major price index published—after both CPI and PPI, which land in the middle of the month.
The BEA publishes 402 detailed price series at various levels of aggregation by type of product. The data is split into goods (156 series), which include motor vehicles and parts, furnishings and durable household equipment, and recreational goods, among others, and services (235 series), which include housing and utilities, health care, transportation services, recreation services, food services and accommodations, and financial services.
A subset known as the PCE control group includes 25 sub-series of both durable and nondurable goods that uses the “retail control method” to ensure that the PCE control group has the same growth rate as the retail control group.
The Fed’s preferred measure of inflation
As the Fed’s preferred inflation metric, PCE is what ultimately informs the 2% inflation target. While CPI often garners more attention from markets because of its timeliness, PCE has certain qualities that provide a better gauge of how inflation affects consumers.
According to the Federal Reserve, “the PCE index is constructed in a way that accounts for how Americans are spending their money at a given time and more quickly adapts to changes in spending patterns.” In short, PCE updates its basket of goods continuously, whereas CPI holds its basket fixed for longer periods. This means PCE more accurately reflects the burden of price changes and better captures the substitution effect—which is particularly useful in a volatile price environment.
How PCE Differs from CPI
CPI data is used as an input for PCE, but the two series differ significantly in source data and weighting. Below we outline the key differences in the respective methodologies.
Scope
The BEA defines the PCE price index as measuring “growth in the cost of the entirety of personal consumption expenditures in the national income and product accounts.” CPI, on the other hand, is a measure of “out-of-pocket spending by urban households.” This means roughly 25% of PCE spending is not captured by CPI, which contributes to differences between the respective inflation readings.
For example, PCE measures spending by individuals and nonprofit institutions, as well as certain items purchased on behalf of individuals — including employer-paid health insurance and government programs like Medicare and Medicaid. If medical care costs borne by employer-sponsored health plans outpace inflation, this would exert upward pressure on PCE but not CPI.
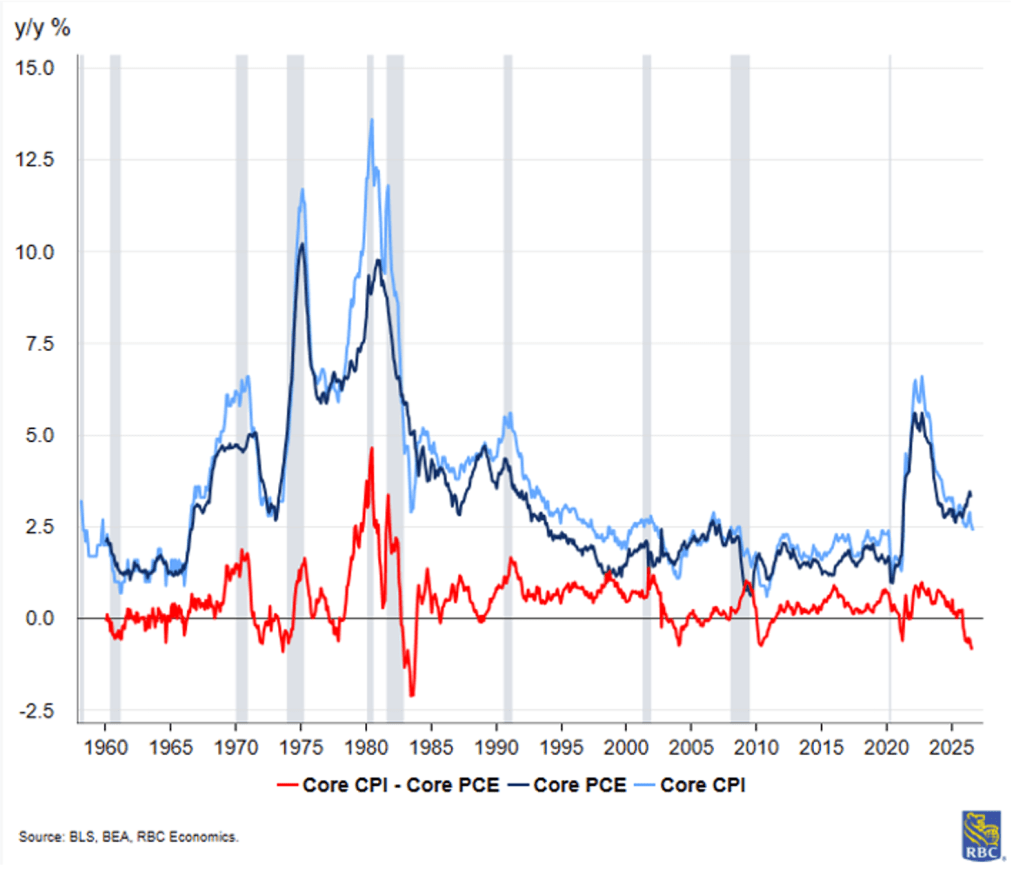
Core PCE exceeded core CPI only 20% of the time since 1960
Source data
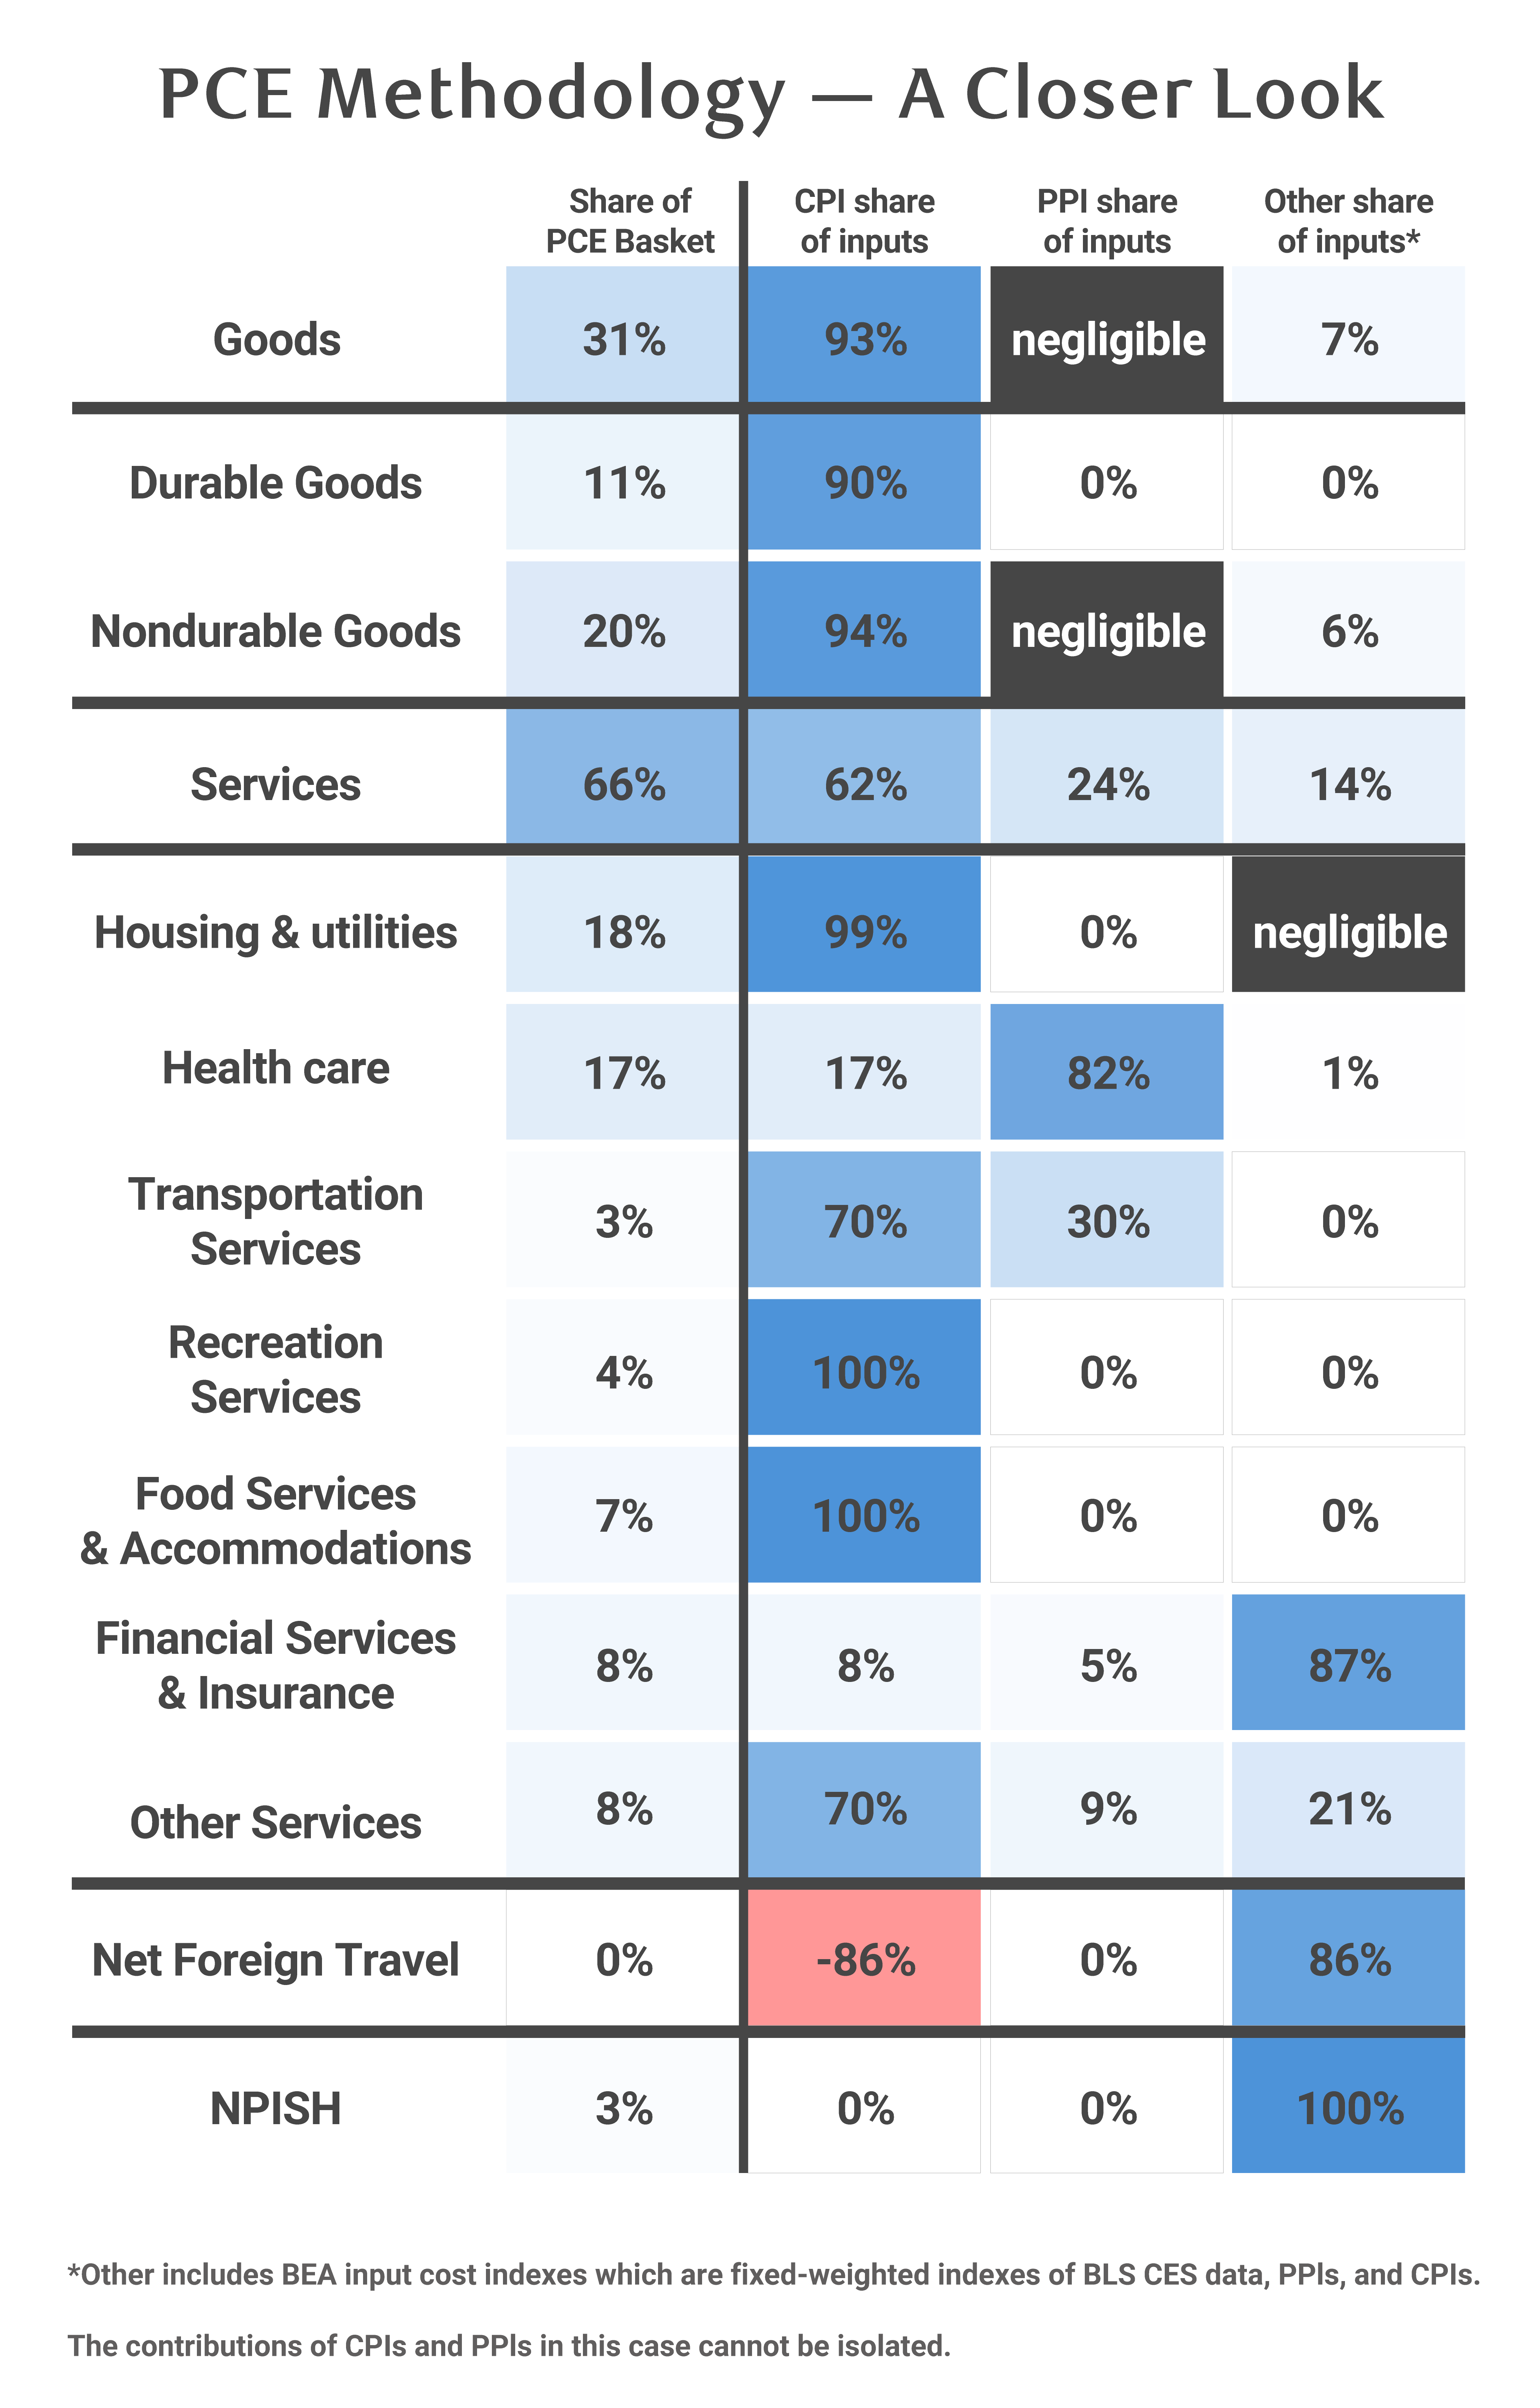
Goods: The PCE price index includes series for durable goods, nondurable goods, and services alongside more granular sub-series. The aggregate indexes are the product of price inputs and their relative weights. For both durable and nondurable goods, the BEA relies almost exclusively on CPI series as price inputs. PPI plays a negligible role in goods-sector deflators: the only PPI series used is PPI for apparel, which feeds into the deflator for standard clothing issued to military personnel and accounts for 0.02% of goods-sector consumption. The two other non-CPI inputs are a fixed-weighted BEA composite of the US Department of Agriculture’s Prices Received by Farmers index, used for food produced and consumed on farms, and the BEA’s index for installation support services, which serves as the deflator for goods and services expenditures of US employees abroad and rolls up into “other nondurable goods.” Outside these three exceptions, CPI inputs account for 93% of durable and nondurable price deflators in PCE.
Services: For services, the picture is more mixed. CPI inputs account for the largest share, but PPI data features prominently in several important sub-categories. In health care, PPI inputs for physicians, hospitals, home health care, and nursing care facilities are key deflators, while only a few CPI series—dental services and other medical professionals—are included. In public transportation, PPI for domestic scheduled passenger air transportation is the primary input rather than CPI for airline fares. Beyond CPI and PPI, the BEA also draws on other data sources. Effective September 30, 2026, the BEA replaced the PPI-based deflator for portfolio management and investment advice services with one derived from a Current Employment Statistics (CES)-based quantity extrapolator, effectively subtracting the CES quantity measure from nominal spending to arrive at a price deflator.
Weights
PCE price weights are updated each month and derived from personal spending data. Specifically, the weights are drawn from business surveys including the Census Bureau’s Monthly Retail Trade Survey, the Quarterly Services Survey, and the Service Annual Survey.
CPI weights, on the other hand, are updated once a year (in January) based on the annual Consumer Expenditure (CE) Survey. Consequently, CPI holds the quantity mix of goods and services purchased fixed for one year until new spending weights can be introduced.
This is one of the reasons why measures of CPI typically exceed PCE. According to the BLS, “estimates of current period inflation calculated with outdated spending weights tend to be higher than inflation estimates calculated with more current spending weights.” Consumers substitute away from relatively more expensive items toward alternatives where prices are not rising as quickly. In other words, PCE captures substitution effects better than CPI. Since 1960, monthly core PCE has exceeded core CPI only around 20% of the time. Over the past two decades, in any given month, the year-over-year pace of core CPI has exceeded core PCE by an average of 0.3 percentage points.
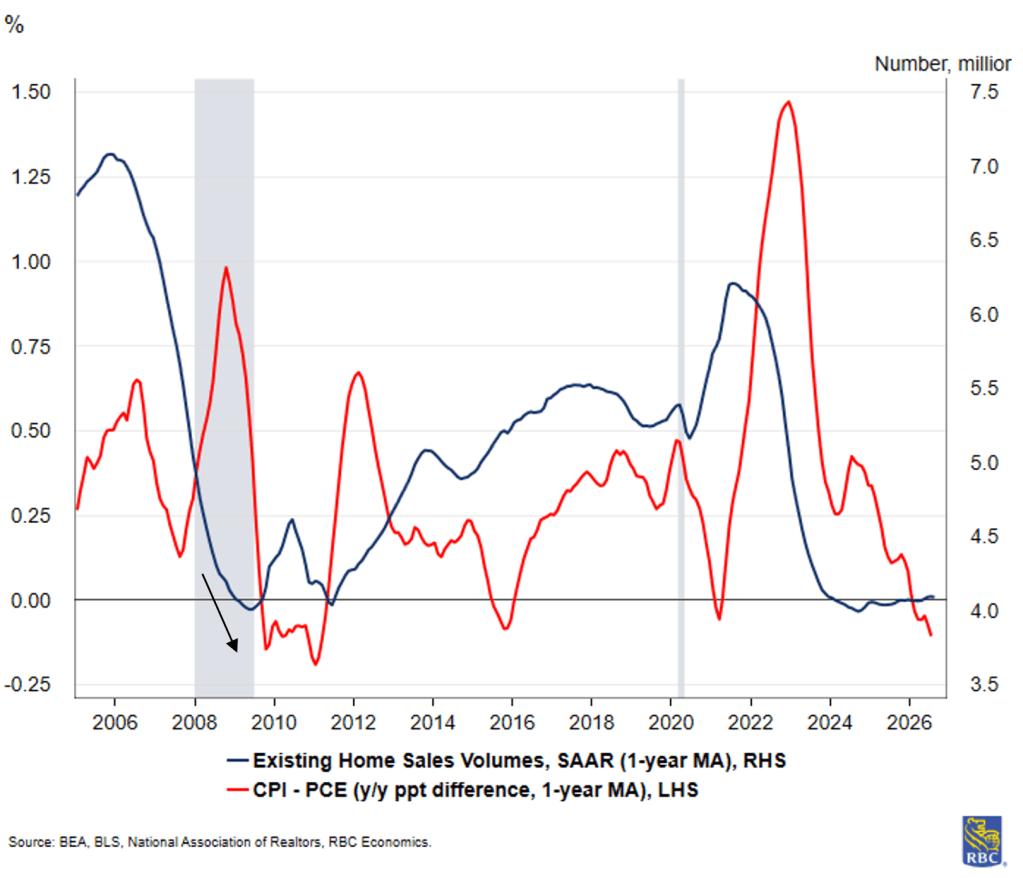
Because of the broader scope of PCE, housing carries a smaller weight than it does in CPI. Shelter accounts for about 33% of the CPI basket but only around 16% of the PCE basket, meaning changes in rent generate bigger fluctuations in CPI than in PCE. For example, when home prices took a significant hit in the aftermath of the global financial crisis, PCE trended higher than CPI.
Weakening existing home sales weigh more heavily on CPI relative to PCE
Energy also carries roughly twice as much weight in CPI as in PCE. From January to September 2015, PCE exceeded CPI for a span of nine consecutive months on a year-over-year basis. This happened as a result of the oil price crash: year-over-year measures of energy CPI registered deeply negative starting in late 2014, and by January 2015 WTI was down 50% year-over-year. Since energy accounted for 8% of the CPI basket at the time and only 4% of the PCE basket, PCE was consistently higher than CPI until energy prices moderated.
With these differences in mind, the following section examines how the BEA constructs the PCE weights and price index.
Why has PCE been consistently exceeding CPI since 2025
It is unusual for PCE to exceed CPI, yet this has been the case consistently since late 2025. Between November 2025 and June 2026, year-over-year core PCE exceeded core CPI in every month, and headline PCE exceeded headline CPI in six of eight months. This is perhaps surprising given that housing services and energy commodities—categories that bear more weight in CPI than in PCE—had been running hot for months. In the first half of 2026, housing (specifically, rent of primary residence and owners’ equivalent rent) accounted for 34% of the year-over-year increase in CPI compared with only 14% of the increase in PCE.
The differential is a scope effect. The culprits are financial services and insurance, and health care—which together more than account for the gap between headline PCE and CPI. Financial services and insurance PCE has accelerated since mid-2025, with the pace of price growth in many cases more than double that of headline PCE. The health care chained price index for PCE has been running above 2.5% year-over-year consistently since early 2025.
Whether CPI and PCE ultimately converge depends on the trajectory of portfolio management and investment advice employment and the difference between PCE health care PPI inputs and CPI for health care. PPI tracks payments received by providers (physicians, hospitals), while CPI tracks prices paid by consumers—a sizeable scope difference, since PPI covers payments made by employer-sponsored health insurance and Medicare/Medicaid.
Data sources for PCE weights
PCE weights are derived from business surveys rather than consumer surveys. CPI weights are based on a household survey conducted quarterly in which respondents recall the prior month’s expenditures, supplemented by a diary of daily spending—both methods subject to recall bias. PCE weights, by contrast, are more reliable since they are drawn from surveys that collect sales data directly from businesses, which tend to maintain more precise records.
For goods, consumption estimates rely primarily on the Census Bureau’s Monthly and Annual Retail Trade Surveys, supplemented by point-of-sale scanner data from Circana (for grocery and electronics categories) and specialized sources like IQVIA for prescription drugs and the Recording Industry Association of America for audio media.
For services, the BEA draws on the Census Bureau’s Quarterly Services Survey and Service Annual Survey, housing data based on unit stocks and average rents from the American Community Survey, and economic census data. The foundational level for all categories is set in benchmark years using the BEA’s Input-Output Accounts (built on the Economic Census), with annual and monthly estimates extrapolated forward using the indicator series described above. Where no timely survey data exist — particularly for certain services categories — the BEA projects estimates using population growth and recent per-capita consumption trends, then converts to current dollars using monthly CPI data.
To construct the PCE price index from these expenditure estimates, the BEA deflates current-dollar spending for each detailed category using the closest matching CPI component or components, then aggregates the results using a chain-type (Fisher) formula that updates the weighting continuously rather than holding it fixed—making it less susceptible to substitution bias than a fixed-weight index like CPI.
The calculation (Fisher chain-type index)
At a conceptual level, PCE uses a Fisher chain-type index that blends two perspectives on price changes—one holding last period’s spending pattern fixed, one holding the current period’s pattern fixed—and takes the geometric mean of the two (that is, the BEA multiplies the two indexes and takes the square root). The geometric mean produces a slightly lower, more conservative estimate of price changes, which is consistent with the broader design goal of PCE to avoid overstating inflation. CPI, by contrast, uses a fixed-basket (Laspeyres) approach and holds quantities constant until the next annual weight update.
The calculation involves the following steps:
Step 1:
First, the BEA takes last period’s basket of goods and services and asks: how much more (or less) would that same basket cost at this period’s prices? This captures price changes holding last period’s spending pattern fixed. This is known as a Laspeyres price index.
Second, the BEA takes this period’s basket of goods and services and asks: how much more (or less) does this basket cost compared with what it would have cost at last period’s prices? This captures price changes holding the current spending pattern fixed. This is known as a Paasche index.
Step 2:
Neither comparison alone is perfect. The Laspeyres index may overstate inflation because it does not account for substitution. The Paasche index may understate inflation because it assumes that full substitution has already occurred. To split the difference, the BEA multiplies these two indexes together and takes the square root. This is the Fisher index, and it produces a balanced, middle-ground estimate of price changes from one period to the next.
Step 3:
The index links these period-to-period growth rates sequentially, starting from a chosen base year (for example, 2017), which is set to 100. Each subsequent period’s level is determined by multiplying the prior level by that period’s growth rate. This “chaining” means the basket of goods updates continuously, reflecting how consumers shift their spending in response to price changes.
Rather than locking in a fixed basket that grows stale over time, the PCE price index updates what is in the basket every period (month or quarter) and blends two perspectives—last period’s and the current period’s spending patterns—to produce a more accurate read on inflation.
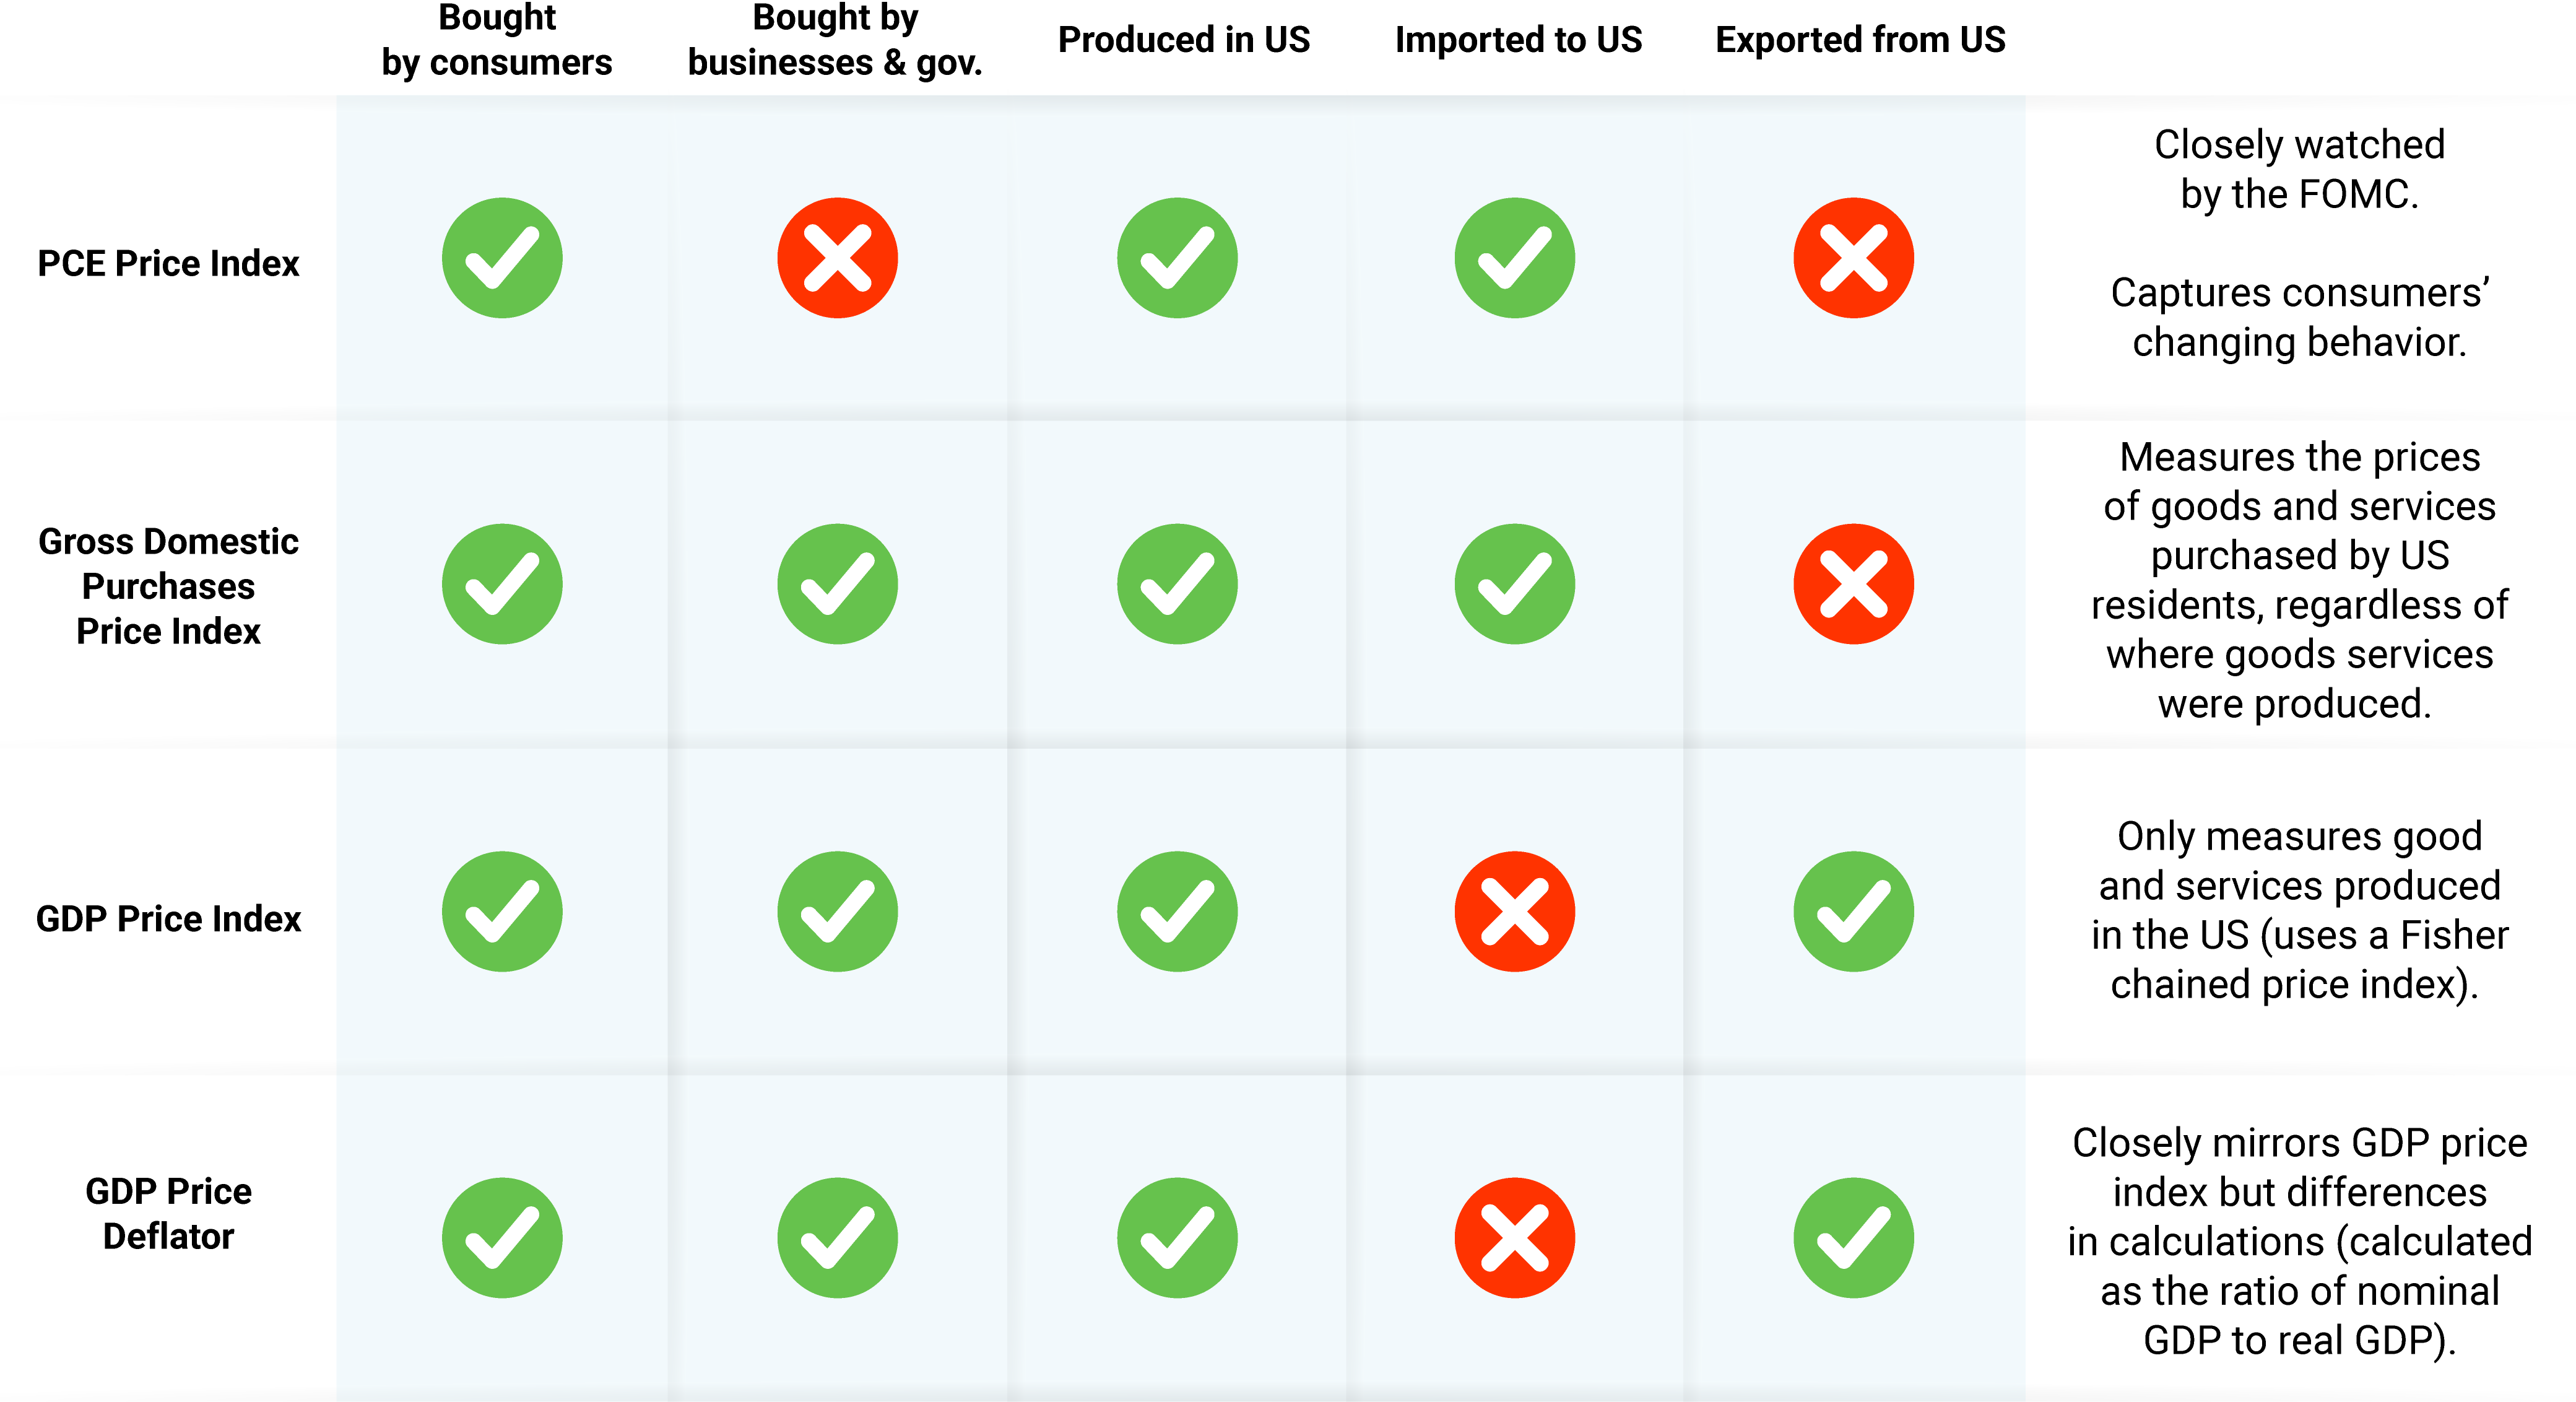
PCE vs. Other GDP-Based Price Measures
Aside from the BLS’s CPI and PPI metrics, the BEA publishes several additional measures of price growth. Here is how they differ from PCE:
About the authors:
Mike Reid is Head of US Economics at RBC. He is responsible for generating RBC’s US economic outlook, providing commentary on macro indicators, and producing written analysis around the economic backdrop.
Carrie Freestone is a Senior US Economist at RBC. She is responsible for generating RBC’s US economic forecasts across GDP, employment, and inflation, and providing macro commentary through publications, presentations, and the media.
Imri Haggin is an US Economist at RBC, where he focuses on thematic research. His prior work has centered on consumer credit dynamics and treasury modeling, with an emphasis on leveraging data to understand behavior.
This article is intended as general information only and is not to be relied upon as constituting legal, financial or other professional advice. The reader is solely liable for any use of the information contained in this document and Royal Bank of Canada (“RBC”) nor any of its affiliates nor any of their respective directors, officers, employees or agents shall be held responsible for any direct or indirect damages arising from the use of this document by the reader. A professional advisor should be consulted regarding your specific situation. Information presented is believed to be factual and up-to-date but we do not guarantee its accuracy and it should not be regarded as a complete analysis of the subjects discussed. All expressions of opinion reflect the judgment of the authors as of the date of publication and are subject to change. No endorsement of any third parties or their advice, opinions, information, products or services is expressly given or implied by Royal Bank of Canada or any of its affiliates.
This document may contain forward-looking statements within the meaning of certain securities laws, which are subject to RBC’s caution regarding forward-looking statements. ESG (including climate) metrics, data and other information contained on this website are or may be based on assumptions, estimates and judgements. For cautionary statements relating to the information on this website, refer to the “Caution regarding forward-looking statements” and the “Important notice regarding this document” sections in our latest climate report or sustainability report, available at: https://www.rbc.com/community-social-impact/reporting-performance/index.html. Except as required by law, none of RBC nor any of its affiliates undertake to update any information in this document.

