

 EN
EN 



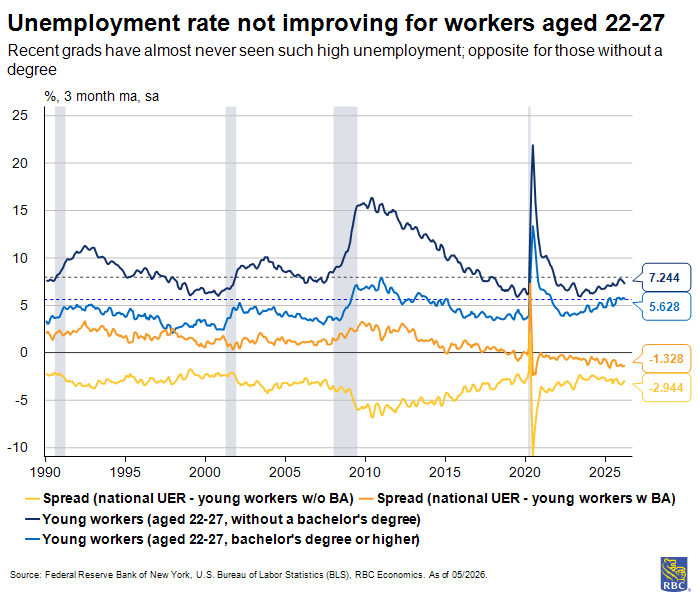
Something has changed for young workers in the post-COVID labor market in the US. Recent college graduates (aged 22-27) face the highest unemployment rate of the decade, around 5.6%—unseen since 2015. There’s also been an uptick in the underemployment rate for this age group. The rate of people working jobs that don’t require associated credentials has hit more than 41%. At the same time, the national unemployment rate is notably lower at 4.3%.
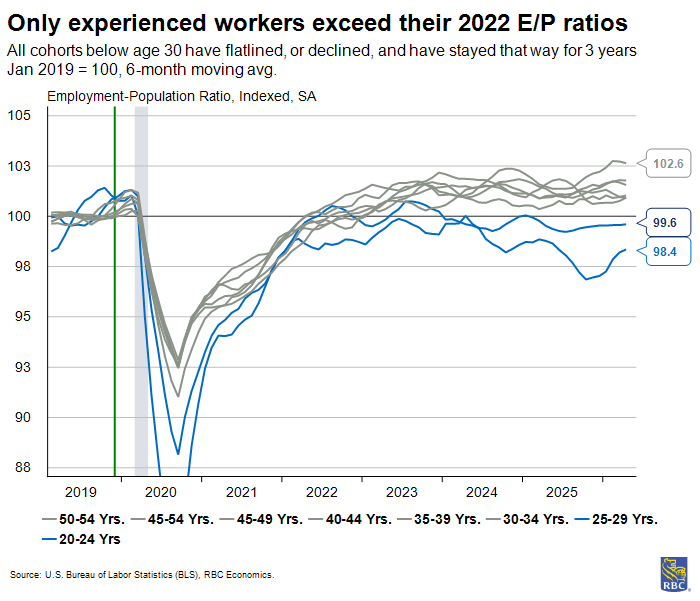
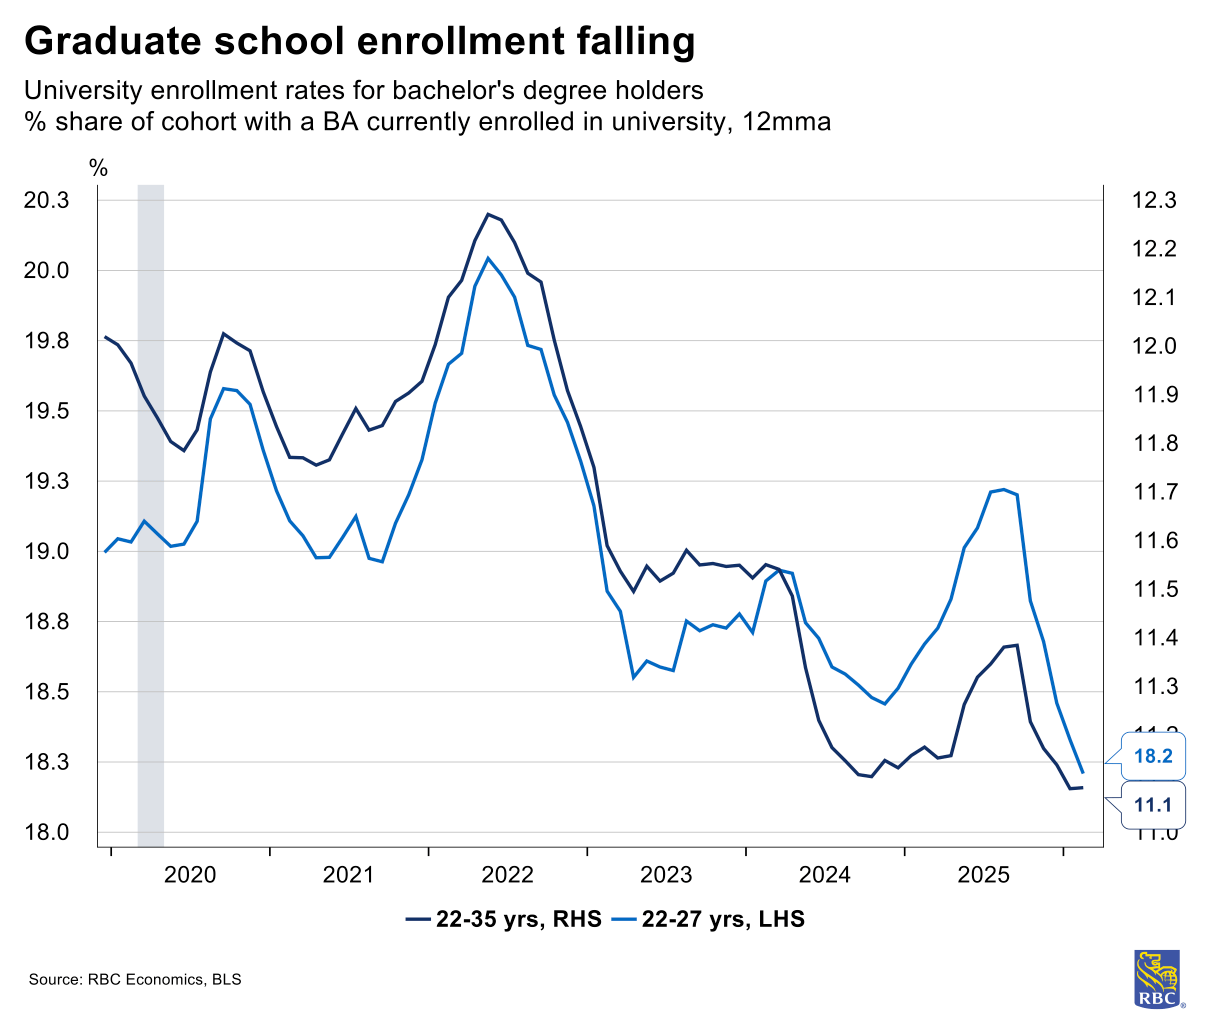
The employment-to-population (E/P) ratio for workers aged 22 to 27 rose sharply after the pandemic, but stalled in 2022, peaking near 76% before drifting down to roughly 74%, where it has remained for the past two years. Experienced workers (30-54 years) experienced a similarly rapid initial recovery but have continued to improve, bringing their E/P ratio to 81% currently. In a tight labor market, entry-level hiring should be strong. But it isn’t. Young workers also haven’t given up or retreated back to school. Labor force participation among recent college grads is stable, and graduate school enrollment has fallen.
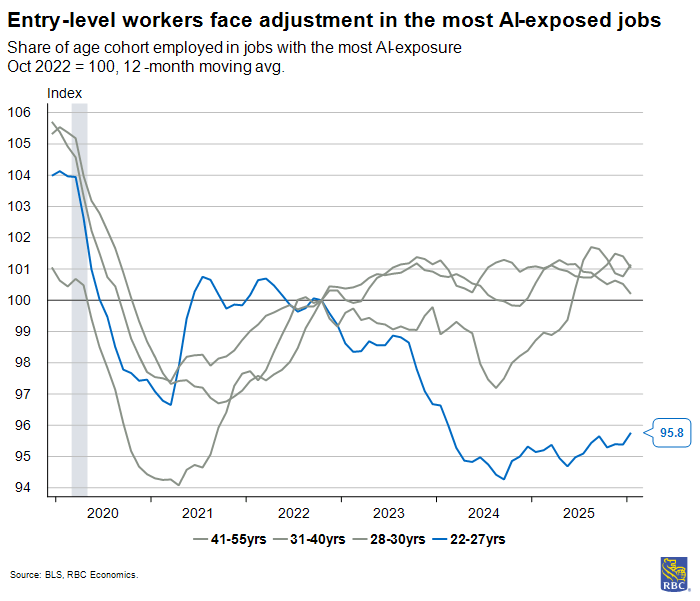
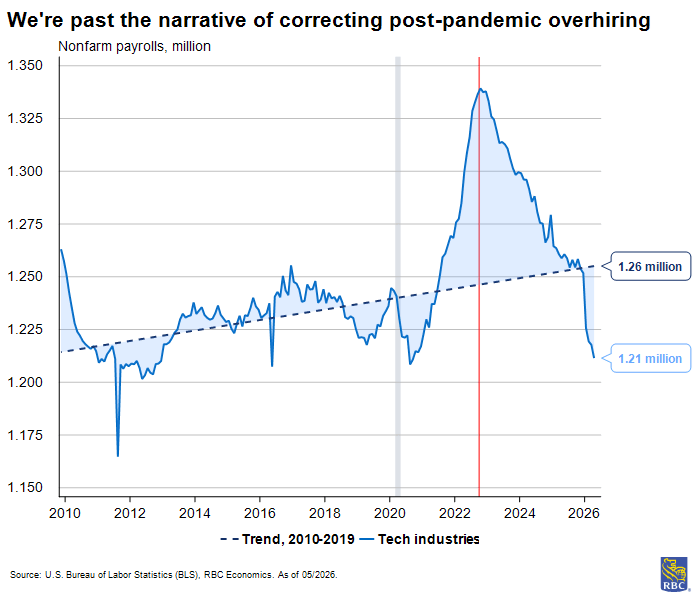
We’ve seen that in AI-exposed occupations, firms aren’t cutting junior positions, but rather, they’re prioritizing experienced employees. In parallel, we see headcount weakness in industries who share the most optimism towards AI’s future.
Elevated interest rates, business uncertainty, a potential AI dividend, and increasing input costs are weighing on hiring activity, but a common misconception is that the introduction of generative AI tools is the primary culprit. Today, we are seeing young workers’ challenges as a matching problem, likely attributable to this mismatch of the skills recent grads learn in college, and those skills employers seek in this evolving labor market.
The data shows education as a critical differentiator. The unemployment rate for young workers without a bachelor’s degree is near historic lows, while those holding bachelor’s degrees are experiencing some of the highest on record.
We’ve said before that it is too early to declare a structural break attributable to AI tools. A shift in employment and production would show productivity growth rates that more closely reflect past paradigm shifts, like the mass diffusion of computing and internet products that yielded labor productivity growth rates above 3% annually. The most recent productivity growth rates (0.8% Q/Q, SAAR), alongside employment trends, park us firmly in wait-and-see mode.
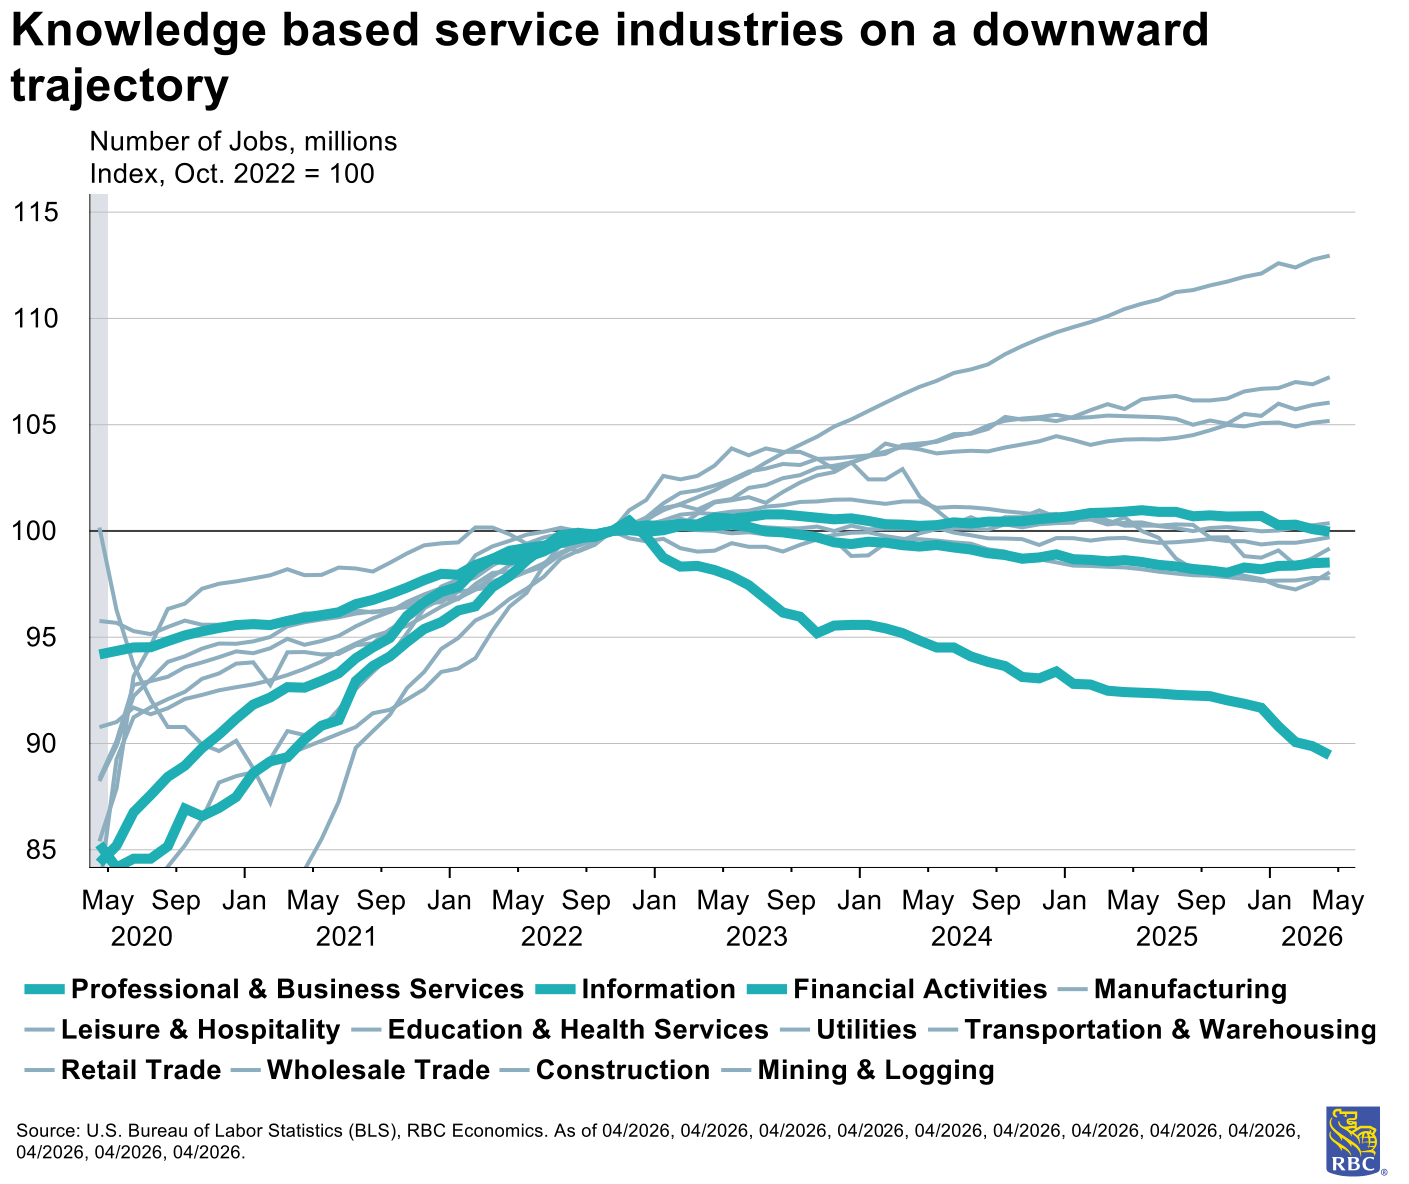
Where the squeeze lands: Finance, insurance, and information services
Finance, insurance, and information services show the sharpest divergences from their pre-pandemic and pre-2022 employment trends in aggregate. Hence, it appears the pattern is concentrated where AI optimism lands the hardest: white-collar jobs . At a very broad level, this makes sense – occupations employing college graduates typically require mental tasks and calculations while those that do not are generally “blue collar” jobs that require more physical labor. In that lens, AI job destruction is expected to be greatest in white collar occupations.
The deeper logic of the moment is straightforward. American demographics are tightening: the retiree population is growing more quickly than at any point in recent history, and labor force growth will increasingly depend on participation of elders rather than new entrants.
Firms know this and are faced with rising wage costs and a thinning pipeline of available workers. So, they are dedicating capital towards prospective productivity investments to supplement this structural limitation on labor.
Hence, business investment in AI infrastructure continues to accelerate. Some of this will be reversed if it proves that executives have been using AI as a cover for correcting past over-hiring, or as a cover for adjusting their business in response to the wider challenges mentioned earlier, but the structural pressures point the same direction either way.
Even before any measurable AI dividend shows up in aggregate productivity measures, the demographic and capital allocation trends suggest continuing low hiring for entry-level roles.
Persistent age and skill-specific employment decline
The US labor market recovery from COVID was remarkably uniform across age groups through mid-2022. The divergence that followed has not been as even. Experienced workers continue to track or exceed their employment-population ratio seen in October 2022. Meanwhile, entry level cohorts have stayed flat, or declined.
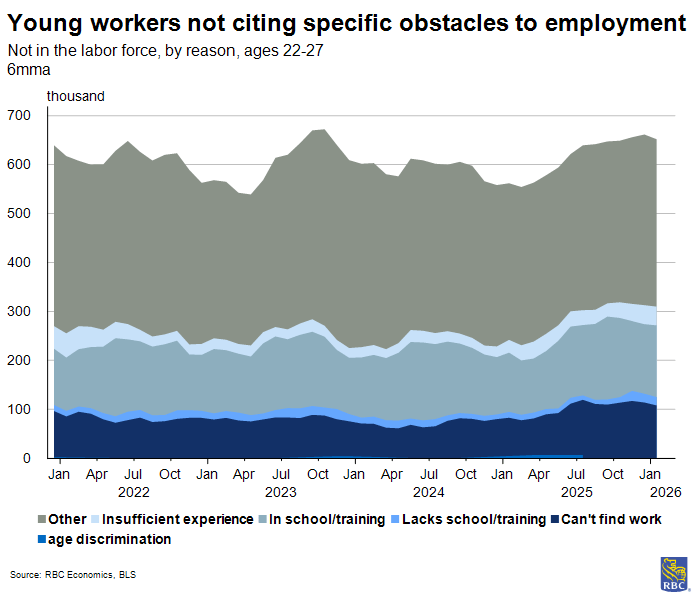
The composition of those not in the labor force reinforces this reading. Education and training have grown slightly as stated reason for leaving the labor force, yet graduate enrollment among 22–27-year-old bachelor’s degree holders has declined; we’re sitting near multi-year graduate level enrollment lows.
Overall university enrollment rates have not moved significantly either. Rationale counts for “not in the labor force” (NILF) status has only marginally grown from those that “couldn’t find work” and have “no work expertise”. This would not be expected if young grads were “upskilling” to wait out a soft labor market.
That implies that the elevated graduate unemployment rate reflects genuine slack and is not masked by discouraged workers exiting for education or leaving the labor force entirely.
There would also be expectations of a hiring boom for young talent in the current macroeconomic backdrop of high retirements and an outsized ratio of workers leaving the labor force compared to those entering.
Is it an early sign of AI disruption?
To answer this, we categorized workers surveyed in the Current Population Survey by their exposure to AI-automated tasks based on occupation. We then divided these levels of exposure into five equal buckets, or quintiles. Looking at this breakdown by age group, we found that even though the headcount for 22–27-year-olds in the most highly exposed quintile has held since October 2022, the share of 22–27-year-old workers holding occupations in the top quintile of AI-exposed occupations fell by 5%.
This suggests that firms are not slashing junior positions, but are expanding experienced-worker headcount while holding the entry-level pipeline flat.
Against mass retirements, flat headcount could translate into a diminishing likelihood that young workers enter AI-exposed occupations. The trend is invisible in standard job-loss statistics, jobless claims, and JOLTS separations data. To draw this conclusion, we looked at the flows into employment: Cohort-specific employment shares and earnings-to-population ratios for new entrants.
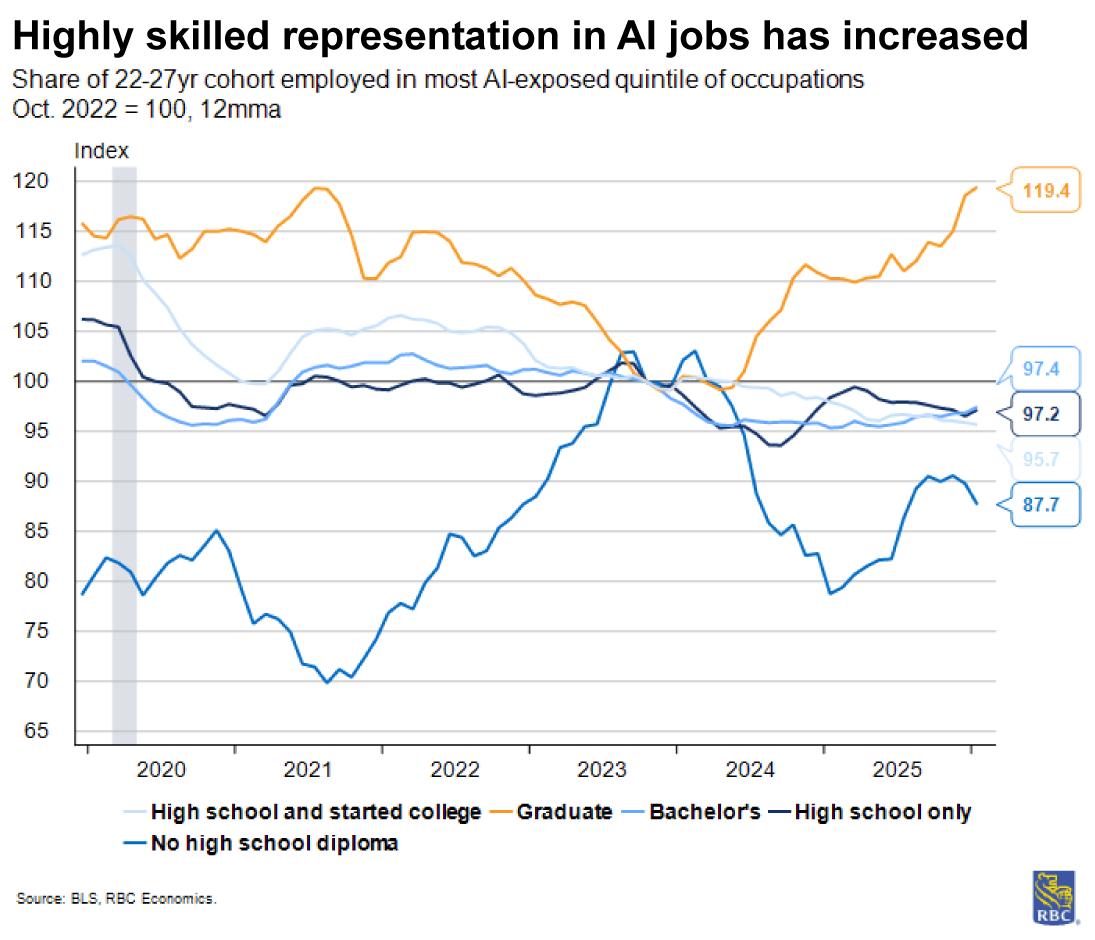
At the same time, graduate degree holders aged 22–27 are trending well above their 2022 share of employment in exposed occupations. We also see a divergence in employment rates between master’s degree holders and professional/doctoral holders. Read alongside the declines at the entry tier, it appears that firms are hiring more selectively, perhaps due to prospective positioning when thinking about technology and skills.
Further, the structural forces supporting it – demographics limiting labor supply, business investment surging into productivity capex, and hope for capability gains from knowledge tools – suggest it will persist.
About the authors:
Mike Reid is Head of US Economics at RBC. He is responsible for generating RBC’s US economic outlook, providing commentary on macro indicators, and producing written analysis around the economic backdrop.
Carrie Freestone is a Senior US Economist at RBC. Carrie is responsible for projecting key US indicators including GDP, employment, consumer spending and inflation for the US. She also contributes to commentary surrounding the US economic backdrop which she delivers to clients through publications, presentations, and the media.
Imri Haggin is an US Economist at RBC, where he focuses on thematic research. His prior work has centered on consumer credit dynamics and treasury modeling, with an emphasis on leveraging data to understand behavior.
This article is intended as general information only and is not to be relied upon as constituting legal, financial or other professional advice. The reader is solely liable for any use of the information contained in this document and Royal Bank of Canada (“RBC”) nor any of its affiliates nor any of their respective directors, officers, employees or agents shall be held responsible for any direct or indirect damages arising from the use of this document by the reader. A professional advisor should be consulted regarding your specific situation. Information presented is believed to be factual and up-to-date but we do not guarantee its accuracy and it should not be regarded as a complete analysis of the subjects discussed. All expressions of opinion reflect the judgment of the authors as of the date of publication and are subject to change. No endorsement of any third parties or their advice, opinions, information, products or services is expressly given or implied by Royal Bank of Canada or any of its affiliates.
This document may contain forward-looking statements within the meaning of certain securities laws, which are subject to RBC’s caution regarding forward-looking statements. ESG (including climate) metrics, data and other information contained on this website are or may be based on assumptions, estimates and judgements. For cautionary statements relating to the information on this website, refer to the “Caution regarding forward-looking statements” and the “Important notice regarding this document” sections in our latest climate report or sustainability report, available at: https://www.rbc.com/community-social-impact/reporting-performance/index.html. Except as required by law, none of RBC nor any of its affiliates undertake to update any information in this document.

