
Bottom Line:
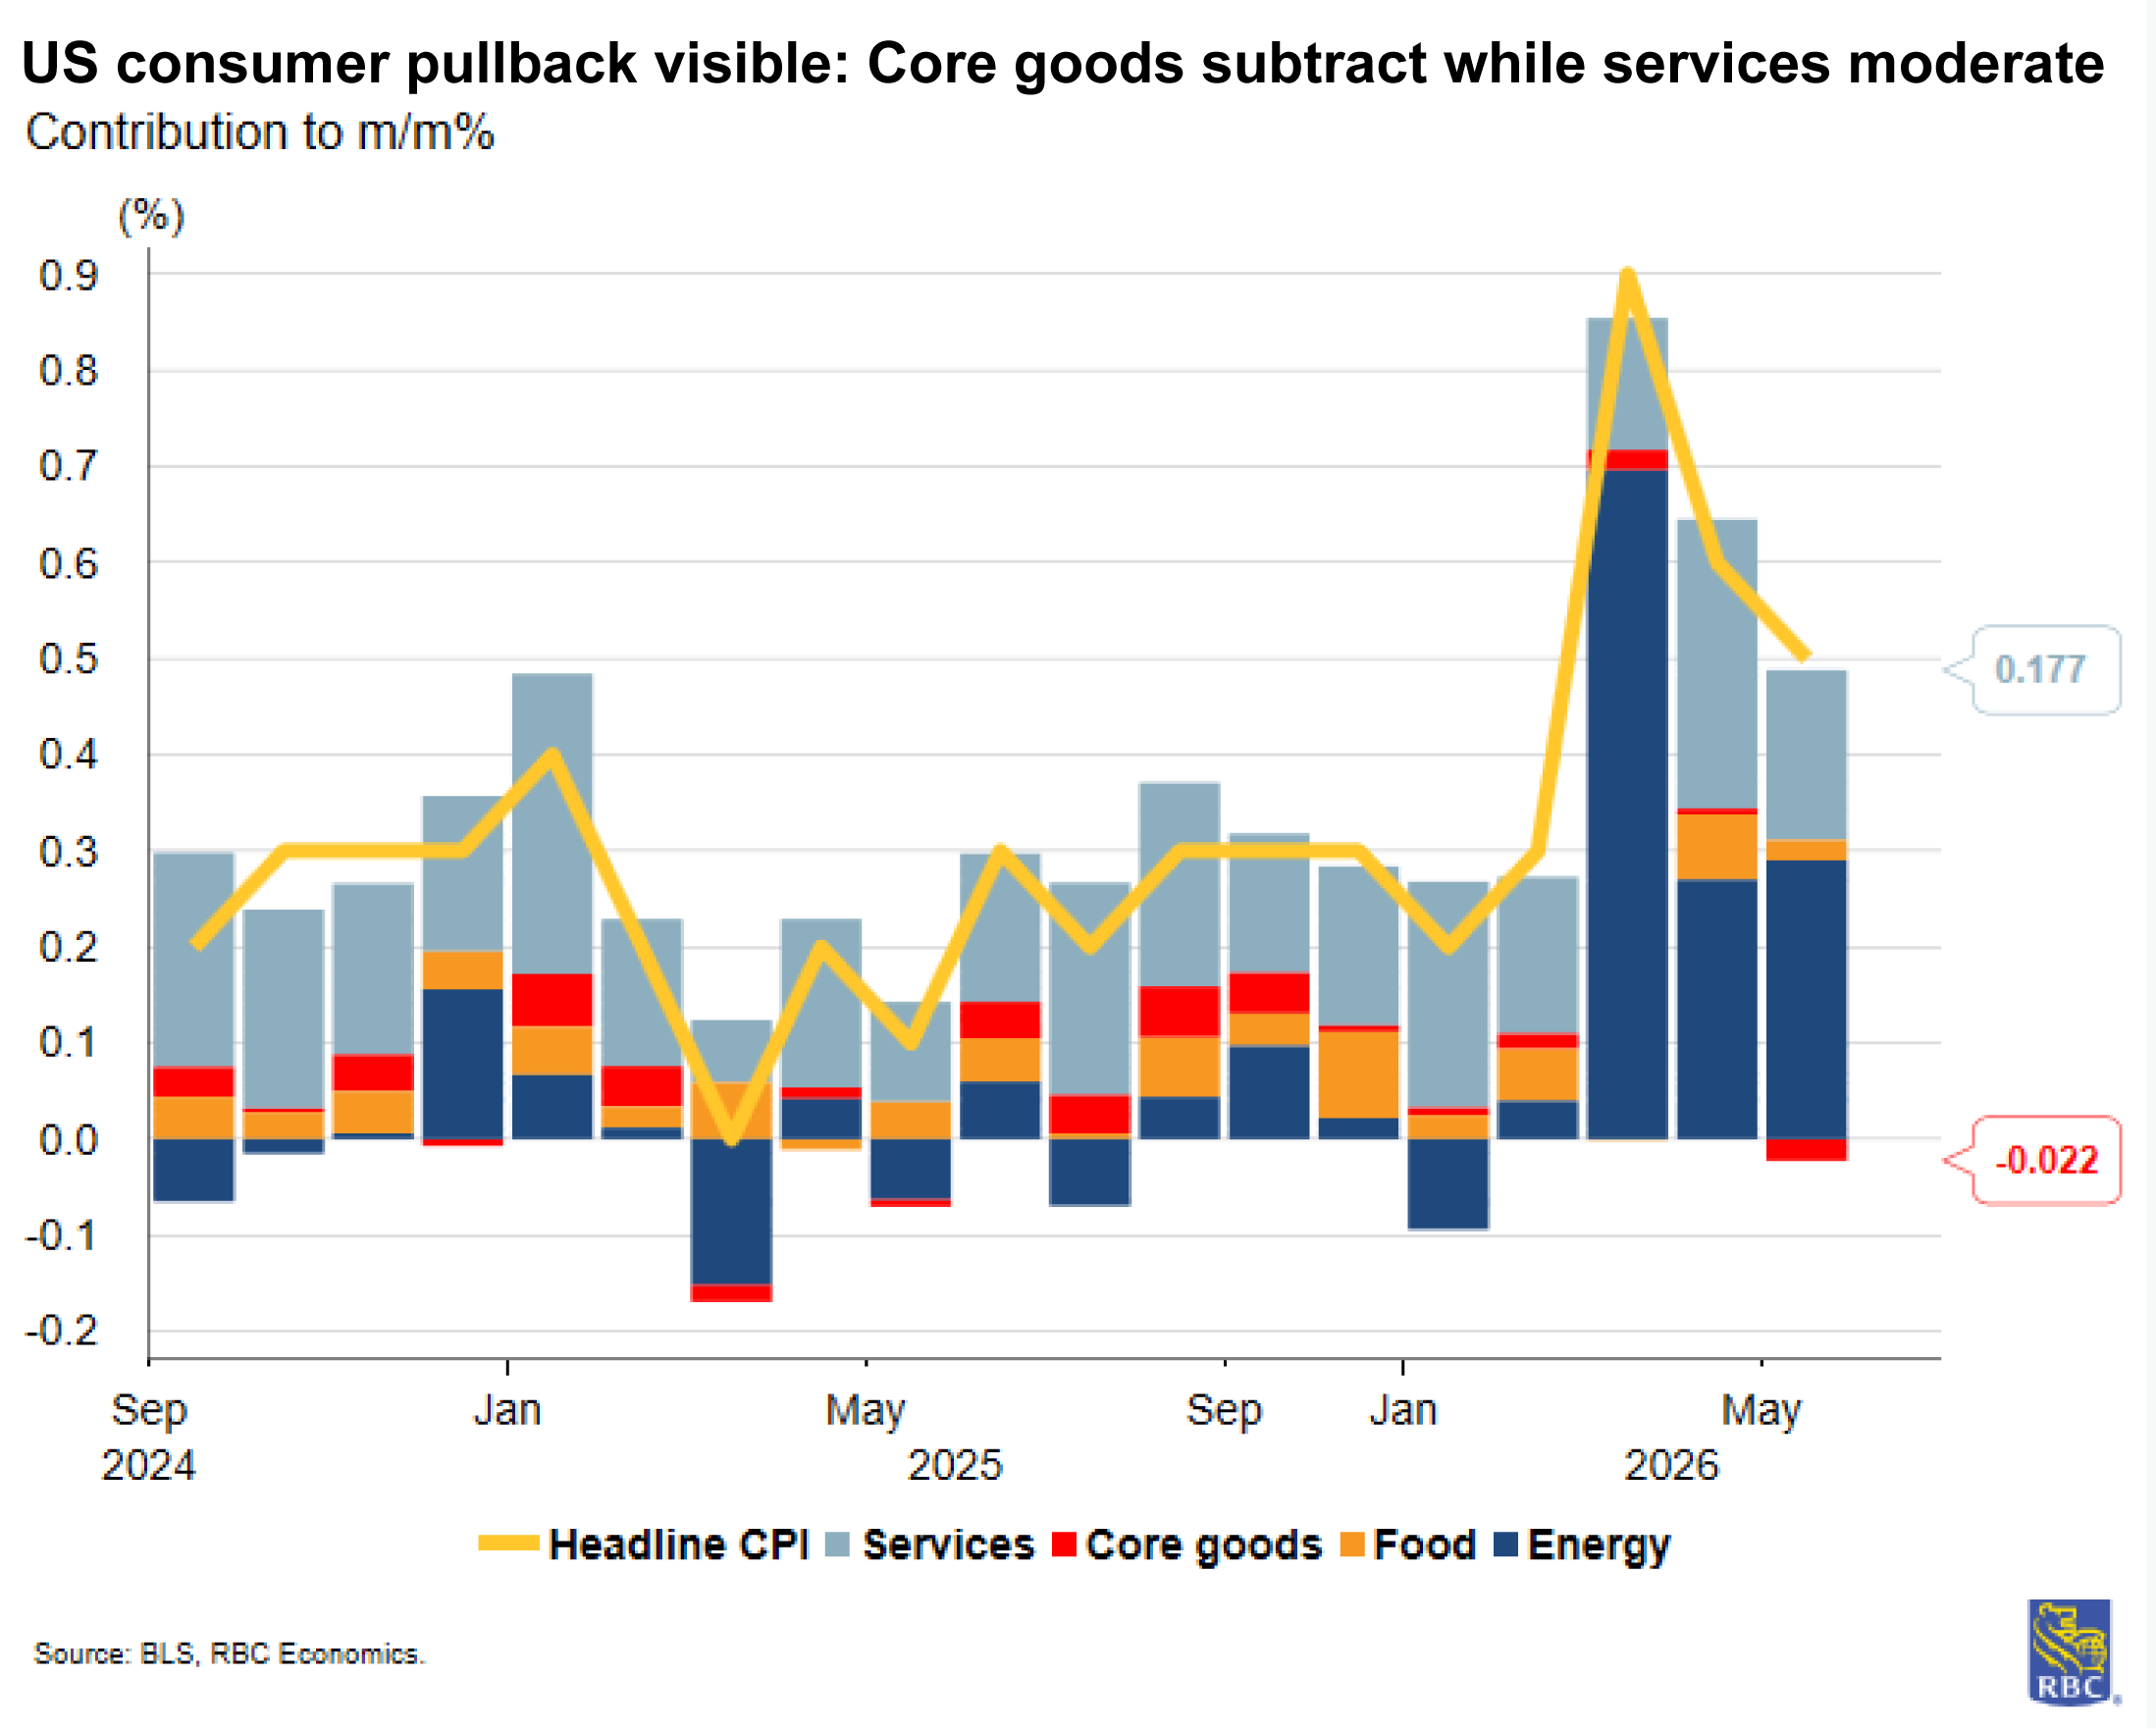
The US CPI report highlighted that oil prices are still weighing on consumers. Headline inflation rose +0.5% m/m – as expected – bringing the year-over-year pace to 4.2%. Core presented a welcome downside surprise (+0.2% m/m), with the year-over-year pace still settling at an uncomfortable 2.9%.
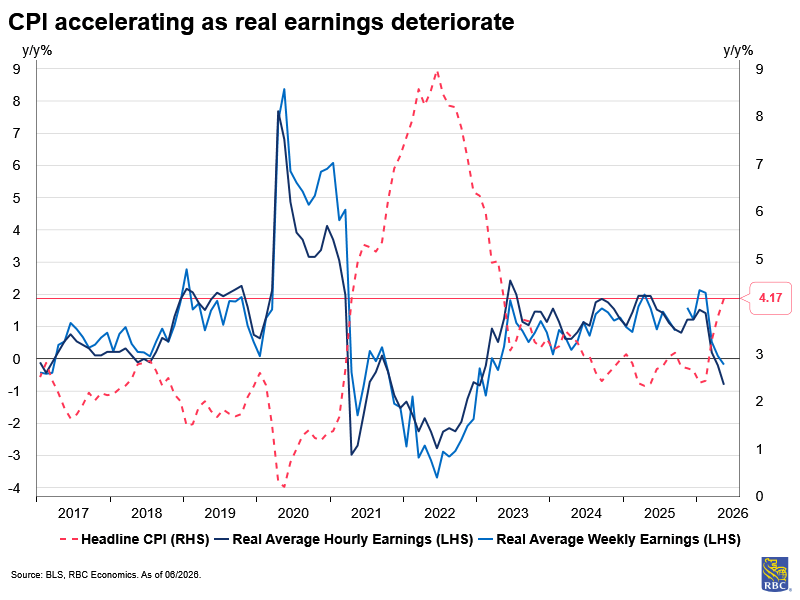
The CPI report for May presents a mixed bag. The Fed may be happy with the modest rise in core inflation, but the headline pace paints a more concerning picture for consumers. Indeed, the consumer is feeling pinched as prices accelerated at the fastest annual pace since April 2023. The difference then, however, was purchasing power was improving. Currently, consumers are falling behind – take home pay fell for the third consecutive month with few signs of relief ahead.
Core services normalized in May (after the housing data reset in April) but remained elevated at 0.3% m/m. The bigger downside surprise came from the core goods (-0.1% m/m). The question is are businesses holding off on tariff passthrough following the IEEPA overturn? And are we seeing early signs of expected refunds in pricing? Or are we in another cycle (similar to H1 2025) of inventory buildup with delayed passthrough as firms try to maintain market share with an increasingly price sensitive consumer. The reality is this trend is not sustainable – consumers will have to pull back if inflation does not moderate. And this creates two-way risk for the Fed. Hiking rates to battle inflation can worsen the affordability situation for many consumers – notably those who are relying on credit to support spending. Cutting rates can fuel inflation but prop up demand in rate sensitive sectors (i.e., housing). For now, we expect the Fed will remain on pause as the Iran negotiations continue.
Here’s what stood out in the May report:
1) Energy prices drove headline inflation to its highest annual pace in three years
-
Sustained pressure in the energy space (+3.9% m/m) contributed 0.3 percentage point to the month-over-month growth in headline inflation.
-
As expected, higher airfares (+2.7% m/m) weighed on core services. Other fuels and electricity prices rose in tandem.
2) We saw a reversal in core goods inflation…for now
-
The big surprise this morning was core goods outright declining (-0.1% m/m) for the first time in 14 months. We suspect the overturn of IEEPA is partly responsible for the reversal.
-
New vehicles prices fell again (-0.3% m/m) but this time, it wasn’t a story of autos masking upward pressures in other sectors.
-
Prices more broadly declined across the core goods space including the trade-exposed household furnishings (-0.2% m/m), medical care commodities (-0.7% m/m) and recreation commodities (-0.1% m/m).
3) But the breadth of inflation is still problematic for the US consumer and the Fed
-
At the same time, core services normalized (+0.3% m/m) but the details are less reassuring. As of May, over 40% of CPI basket items are reporting price growth at 3% or higher, compared to 18% pre-pandemic.
-
With the government shutdown hangover now over, we have a clean read on housing inflation, and our conclusion is that both rent of primary residence (+0.4% m/m) and owners’ equivalent of rent (+0.3% m/m) are running above comfort level.
-
Medical care services and recreation services (both +0.5% m/m) were also running hot – both reflective of demographic demand (i.e., the aging of the population).
-
The longer term trajectory of core services disinflation will be limited by sticky wage growth in the face of labor shortages.
About the Authors:
Mike Reid is Head of US Economics at RBC. He is responsible for generating RBC’s U.S. economic outlook, providing commentary on macro indicators, and producing written analysis around the economic backdrop.
Carrie Freestone is a Senior US Economist at RBC. She is responsible for generating RBC’s US economic forecasts across GDP, employment, and inflation, and providing macro commentary through publications, presentations, and the media.
Imri Haggin is an US Economist at RBC, where he focuses on thematic research. His prior work has centered on consumer credit dynamics and treasury modeling, with an emphasis on leveraging data to understand behavior.
This article is intended as general information only and is not to be relied upon as constituting legal, financial or other professional advice. The reader is solely liable for any use of the information contained in this document and Royal Bank of Canada (“RBC”) nor any of its affiliates nor any of their respective directors, officers, employees or agents shall be held responsible for any direct or indirect damages arising from the use of this document by the reader. A professional advisor should be consulted regarding your specific situation. Information presented is believed to be factual and up-to-date but we do not guarantee its accuracy and it should not be regarded as a complete analysis of the subjects discussed. All expressions of opinion reflect the judgment of the authors as of the date of publication and are subject to change. No endorsement of any third parties or their advice, opinions, information, products or services is expressly given or implied by Royal Bank of Canada or any of its affiliates.
This document may contain forward-looking statements within the meaning of certain securities laws, which are subject to RBC’s caution regarding forward-looking statements. ESG (including climate) metrics, data and other information contained on this website are or may be based on assumptions, estimates and judgements. For cautionary statements relating to the information on this website, refer to the “Caution regarding forward-looking statements” and the “Important notice regarding this document” sections in our latest climate report or sustainability report, available at: https://www.rbc.com/community-social-impact/reporting-performance/index.html. Except as required by law, none of RBC nor any of its affiliates undertake to update any information in this document.
