RBC Thought Leadership Myha Truong-Regan

Key Takeaways

Tackling Canada’s housing shortage will require $2 trillion in capital deployment over the next 5 years—that’s a 5X increase from current levels 

Two taxation tools—tax-free municipal bonds for housing and infrastructure, and tax credits for affordable housing—have spurred housing supply in the U.S., attracting $5 in private capital for every $1 of foregone taxation revenue

Municipalities could cut housing costs by 20% by financing infrastructure with municipal bonds.

The housing shortage in Canada has reached a crisis point.1 An estimated 3.5 million new homes are needed to keep up with demand.2 A staggering number, especially compared to the U.S., where the shortage is 12 times smaller, on a per capita basis, despite having eight times the population.3 Canada’s growing housing shortage has contributed directly to affordability challenges. Average home prices have sky-rocketed in recent years—particularly in Ontario and British Columbia, which accounts for two-thirds of the country’s shortage—such that prices are now nine times household income.4

The federal government proposed a National Housing Strategy in 2017. But the program has only delivered 10% of its commitment to build 131,000 affordable rental homes.5 Mark Carney’s government has now pledged to spend the bulk of its $36-billion housing commitment on prefabricated homes. Tax cuts and concessionary financing for developers round out the government’s policy package.

It’s a start, but more can be done. The U.S. approach to housing can be instructive in how to attract continuous private capital into homebuilding. Canada and the U.S. both provide government subsidies to encourage developers to build more affordable rental and ownership housing. Canada’s preference is grants or concessionary financing, for rental housing, and waiving of government fees, and downpayment support for first-time homebuyers.6 This policy playbook requires the federal government, and provincial governments to a more limited extent, to fund these programs through direct capital outlay.

The U.S. relies more on federal tax incentives to draw in money from corporate, institutional, and mom-and-pop investors to finance housing and housing related infrastructure, including roads and stormwater sewers. At the heart of the U.S. taxation playbook are two tax tools: tax-free municipal bonds and a low-income housing tax credit for affordable housing.7 In 2024, these tools cost the U.S. Department of the Treasury a combined US$59.1 billion—1.2% of all federal revenue—but crowded in nearly US$500 billion in direct-equity investments.8

The introduction of similar federal income tax changes in Canada could achieve a housing trifecta: increased supply, improved affordability, and more sustainable homes. By our estimates, housing costs could decrease by 20%. These savings would allow developers to free up more capital, enabling them to build twice the number of projects with the same amount of equity financing. An acceleration of building activity that could help the Carney government fulfill a key priority: making housing in Canada more affordable.9

Tax-free Municipal Bonds

U.S. local governments have the power to raise debt in public markets, through bond issuances, to finance operating and capital needs, including housing. Local governments have US$4 trillion in outstanding municipal debt, and the U.S. municipal bond market is the largest, globally.10 

The demand for local government debt can largely be attributed to the tax shield it provides investors. Holders of municipal debt, mainly institutional and retail investors, do not have to pay income tax on interest earned on these bonds.11 Since investors are willing to accept a lower rate of return in exchange for lowering their tax obligations, local governments can borrow from the public debt markets at lower costs, typically 100 to 160 basis points lower than taxable bonds with similar risk characteristics.12

To prevent the misuse of proceeds, the federal government places restrictions on what can be financed. Proceeds are principally used to finance projects where the benefits flow to public rather than private interests. To be considered for public purposes, bonds must meet one of the following criteria: more than 90% of the proceeds are used by a government entity, or less than 10% of the proceeds are secured for a property that is used in a trade or business. Municipal bonds that satisfy either of these conditions are classified as government bonds and the federal government does not impose a cap on the amount of debt that can be issued.

Activities that fail to satisfy either of these tests but provide both public and private benefits, such as multi-family residential housing projects, green buildings, and sustainable design projects,13 are eligible for financing with a type of municipal bond classified as a private activity bond (PAB). Unlike government bonds, PABs are subject to capital raising limits, which is US$48 billion in 2025.14 While PABs are used to fund a variety of initiatives, they are critical for developers building affordable housing projects. About 44% (or US$18 billion) of PABs are used to finance affordable rental housing projects, in 2022.15

Low-Income Housing Tax Credit for Affordable Rental Housing

A second tool in the U.S. tax code playbook are low-income housing tax credits (LIHTC). Since its inception in 1987, the LIHTC has been responsible for the development of 7.8% of new U.S. housing stock, or 3.65 million units of affordable housing.16

Two types of credit exist, a 4% and a 9% tax credit.17 The 9% tax credits are allocated to states annually by the Internal Revenue Service (IRS). In 2025, credits are capped at $49.6 billion. States distribute these credits to eligible projects, and eligibility criteria is refreshed annually, to remain aligned with each state’s affordable housing priorities, including the construction of greener or more energy efficient homes. The 4% tax credits are awarded automatically to projects that receive 50% of funding through tax-exempt municipal bond financing. There’s no ceiling on the amount of 4% tax credits available each year, since developers apply for the credit directly with the IRS.

While there are several approaches to accessing the 9% tax credit, the most common is for a syndicator, typically a bank, to play match maker between developers and investors. A limited liability corporation (LLC) is formed in which investors are the limited partners owning 99.99% of a housing project, and the developer as the general partner owns 0.01%. The developer flows to investors the tax credits they receive from their state housing finance authority once a project is occupied. Investors in return provide equity financing to developers, that’s generally $0.90 on the dollar for a credit. These investment partnerships are structured to last 15 years, which is the mandated affordability period in the tax code. At the end of the 15-year holding period, the investors, who are mainly corporations, have the option to sell the housing project back to the developer or enter a new deal for the same property.18

Investors in LIHTC are mainly motivated by the after-tax returns on their equity investments. As a result, they are comfortable with providing 80% equity financing for a project where they will receive lower returns because their contributions will be used to lower rents. Investors internal rate of return (IRR) of after-tax savings range from 350 to 800 basis points which on the upper end of the IRR range is almost twice the yield of a 12-month U.S. treasury bond.19 Two forms of tax savings exist—general tax savings and income tax savings. The former is realized through asset depreciation and operating losses. Income tax savings are realized by using the tax credits to offset federal income tax liability for 10 years, although the credits can be recaptured if the housing project fails to comply with rent and income requirements.20

Tax credits, while benefiting investors and businesses, come with a downside cost: foregone taxation revenue, which, as noted above, cost the government US$59.1 billion in 2024. On the positive side, the LIHTC is estimated to crowd in US$2 of investment spending for every dollar in foregone revenue. The multiplier effect is even more staggering for municipal bonds, crowding in US$10 of private investor capital for each dollar in foregone tax revenue.21

What’s required to adopt the U.S. tax playbook in Canada

Investment tax credits and tax-free capital gains are not novel taxation concepts in Canada. The federal government’s Multiple Unit Rental Building (MURB) program, which ran from 1974 to 1981, permitted retail investors in rental apartments to lower their income tax obligations by claiming capital depreciation and other costs against their income. The program, which cost the federal government between $1.3 and $2.1 billion in foregone taxation revenue in today’s dollars, was eventually discontinued due to its ineffectiveness in creating below market rental housing and lowering rental construction costs.22

The U.S.’s LIHTC program is like Canada’s MURB program in providing tax incentives to attract private capital to finance affordable housing projects. But it differs in its prescriptiveness, governance, and tax-incentive design, which draws in more corporate and institutional rather than retail investor capital. By imposing thresholds for income and rent levels, along with a 15-year compliance period, the program has been successful in ensuring a steady supply of affordable rental housing that’s privately owned. The effectiveness of the program is further enhanced because states are given the flexibility to tailor the program to meet regional priorities, such as Washington state’s preference for projects that are located near mass transit.

Adopting the U.S. affordable housing taxation playbook in Canada will require all orders of government to tweak or introduce new legislative or governance changes in how they deliver and fund housing, and housing-related infrastructure. The greatest shift will be required at the local government level. There, long-standing capital budgeting practices will need to modernize to leverage debt financing that’s available from institutional investors.[1] The crowding in of private capital, however, hinges on the federal government making the necessary changes to its tax code, as the quantum of benefits of similar tax code changes at the provincial level are insufficient for investors.

Federal Government

The federal government would need to enact tax code and governance changes to implement a low-income housing tax credit and a tax-free municipal bond regime in Canada. 

For tax-free municipal bonds, changes are required to the Income Tax Act to exempt interest earned on municipal bonds. Guardrails would be needed to ensure bond proceeds are earmarked for housing related infrastructure projects, such as watermains and sewers. To encourage green infrastructure, the government could also impose a requirement that proceeds be used to build low-carbon infrastructure, such as district energy systems using waste heat. Both guardrails could be achieved by defining the circumstances when interest earned on municipal bonds is not income. For these changes to work, municipalities would need to develop borrowing frameworks, such as a social debenture framework or a green debenture framework, which specifies how bond proceeds will be used.

Changes to the Income Tax Act would also be required to create an investment tax credit for the financing of affordable housing, along with corresponding eligibility criteria of what constitutes affordable housing. To encourage the construction of greener homes, the Department of Finance could replicate the IRS’s approach of defining a range and type of eligible projects. 

The final broad change that may be required at the federal level is the expansion of the Canadian Mortgage and Housing Corporation’s (CMHC) mandate to administer the income and rent limit elements of a LIHTC program, if its current remit related to core housing need does not include these activities.   

Provincial Governments

Canadian provinces do not have housing financing agencies but could leverage housing ministries or departments to administer the provincial components of an LIHTC program. The mandate of these ministries and departments may need to change to encompass all provincial-level elements of a program, such as setting housing priorities, scoring applications, allocating tax credits, and monitoring compliance.

Municipal Governments

For decades, municipalities have been permitted to raise capital through bond issuances and loans to fund capital projects, but rarely for affordable housing.24 This is partly because the federal government along with the provinces are the key funders of market and non-market housing programs, aimed at housing affordability and more recently at climate change. Ontario is the only province where municipalities are actively engaged in funding affordable rental housing, mainly government-owned community housing.25 Funding for these initiatives is primarily paid for by revenue generated from municipal property taxes and user fees, and, in rare cases, municipal bonds, with the latter confined to the largest cities with a growing population and stable economic base, such as Toronto.

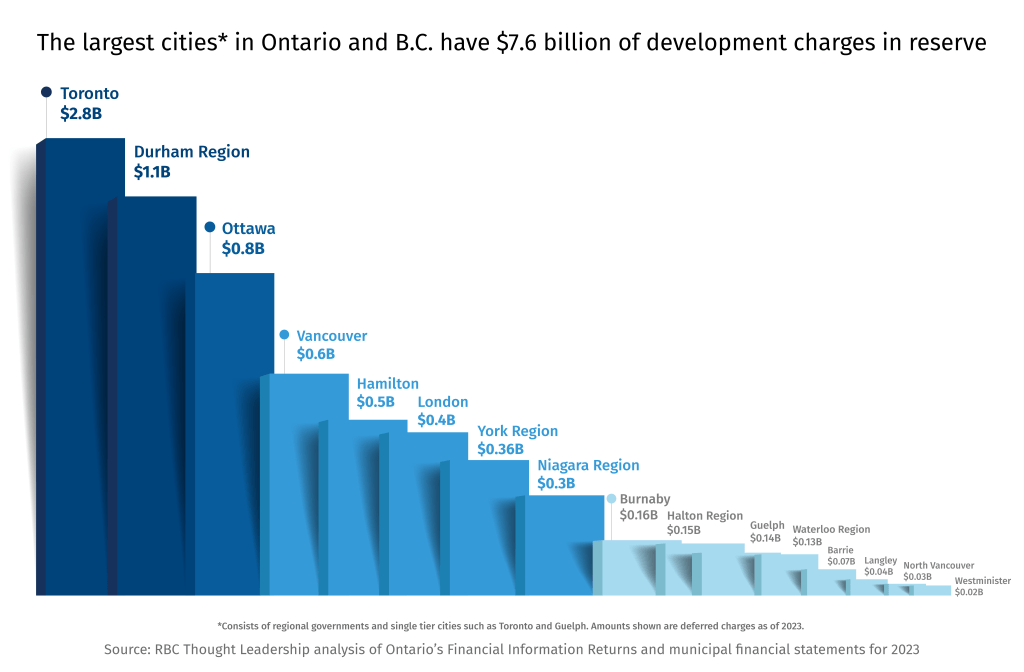
We are not proposing municipalities adopt the U.S. municipal bond playbook wholesale, whereby municipalities directly fund affordable housing with bond proceeds.26 Such a proposal may be unworkable in provinces that require public money to finance only public assets. Instead, we encourage municipalities, especially those in Ontario and B.C., to study the costs and benefits of paying for infrastructure with long-term public debt financing instead of development charges.27 Our analysis of proposed and under construction housing projects found that removing the cost of infrastructure from the price tag of homes can potentially reduce the per-unit construction costs of new homes in the Greater Toronto Area and Metro Vancouver by an average of 20%.28

 Moving to a debt-financing model does not change who pays for housing related municipal infrastructure–renters, homeowners and ratepayers. The conduit for this cost pass-through however changes from developers to municipalities. Because municipalities can borrow at a cheaper rate than developers or homeowners, the interest costs that are passed through are lower.29 Fundamentally, the proposed change addresses a structural housing affordability problem that’s rooted in having renters and homeowners of new construction pay for infrastructure costs upfront, rather than spreading the cost over many decades, through monthly utility fees.

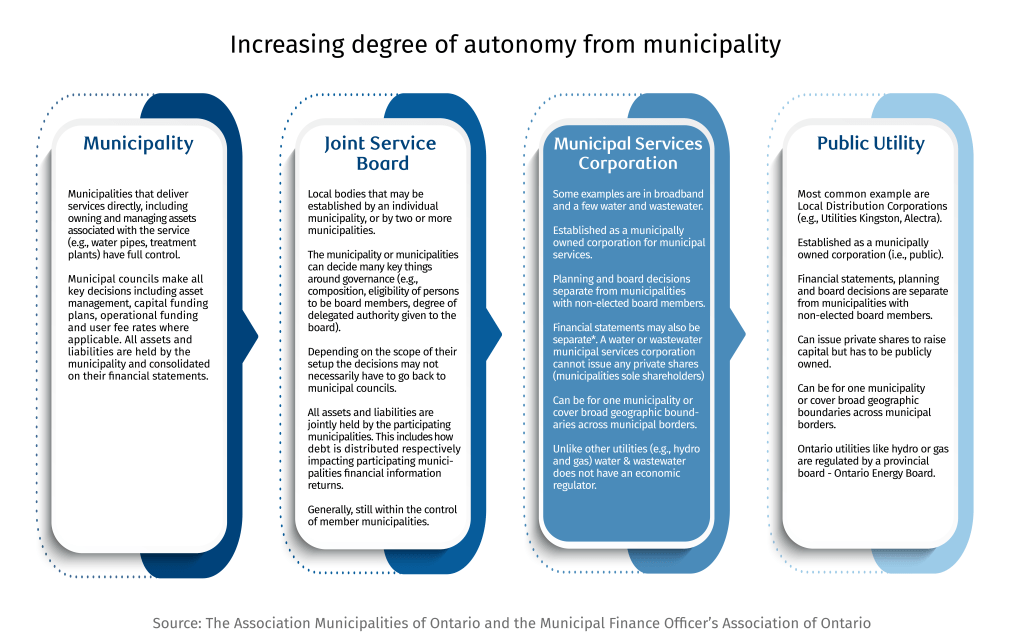
Public-debt financing can occur either as on-book or off-book financing. On-book financing requires municipalities to stay within their annual debt repayment limit, which is generally 25% of own revenue sources.30 Off-book financing provides municipalities greater borrowing flexibility, as annual debt repayment limits are not applicable.31 This form of financing, however, is more administratively complex, as municipalities would need to establish a municipal services corporation (MSC) or a public utility, and scope out the services they want to provide. The most common uses of MSC, or public utilities, are for water/wastewater and local electricity distribution. Both types of corporations operate arms-length from municipalities and take on the public debt used to finance an infrastructure project, in addition to owning and operating the asset.

The strong fiscal position of Canada’s largest municipalities indicates that shifting to a public debt model to finance housing related infrastructure is achievable. Based on regulatory filings32, the 13 largest single-tier and regional governments in Ontario that are also active in the municipal bond market have the fiscal room to take on at least $4 billion in debt, either as loans or bonds, without breaching their annual debt repayment limit. That’s two times greater than the $2 billion they collected in development charges in 2023.33

About 20 Canadian municipalities actively borrow from the public debt market to finance their hard infrastructure projects.34 Municipal bond issuances totaled $5.4 billion, in 2024, with $53 billion in outstanding debt.35

Given the mostly AA to AAA credit ratings of Canadian municipalities, the low risk of default, and the attractive risk-return profile, it’s likely that based on the U.S. experience,changes to the federal tax code to exempt the interest earned on municipal bonds will result in greater investor demand.36

While Canada’s municipal bond market is unlikely to grow 75 times, to $4 trillion dollars, which is the size of the U.S. municipal bond market, the $4 trillion figure is proof that tax incentives can be an effective tool in drawing in private capital into desired forms of infrastructure.37
Municipalities have a range of governance options in how to deliver their services, and ownership and management of these services. The most common model that exists in Canada are for municipalities to have full ownership of service delivery. Within the past 30 years, as more responsibilities are shifted onto municipalities from provincial governments, there’s been a slow evolution to explore different and more cost-effective forms of service delivery.   

Municipal services corporations (MSC) and public utilities are the two most common alternative forms of service delivery.38 The creation of these arms-length municipally owned corporations provide greater flexibility to plan for and finance the full lifecycle of assets.   

In a MSC or public utilities service delivery model, these corporations take on debt to pay for the upfront capital expenditure costs of an infrastructure project. Debts are paid off over several decades through monthly user fees derived from homeowners and businesses using the infrastructure. The continued economic viability of these systems is ensured through mandatory utility connections, typically required by provincial or municipal planning regulations.
Turning ideas into action

We encourage all levels of governments to study and consider the taxation and financing ideas proposed in this policy brief, as they refresh their housing strategies.

Our policy brief does not model the utility rates impacts were municipal governments to adopt a debt financing model for infrastructure. These economic and taxation studies are complex, requiring a deep understanding of capital budget and service delivery models, which is not uniform across Canada. Given the domain expertise required to execute these studies there’s an opportunity for provincial and municipal governments to jointly co-fund these studies to understand the costs and benefits of our proposed ideas.

At the federal level, policy and program design work is likely underway for the government’s affordable housing tax credit proposal, and its commitment to reduce municipal development charges by 50%.39 We encourage the Department of Housing, Infrastructure and Community to consider the ideas put forth, as they move deeper into the policy analysis, program design and consultation stage of their work. Since changes to the Income Tax Act are at the crux of our two ideas, we encourage the Department of Finance to evaluate the cost and benefits of our two tax proposals on the government’s balance sheet.

Conclusion

An estimated $2 trillion will be required over the next five years to build the additional 3.5 million homes required to alleviate the country’s housing affordability crisis.40 A crisis that in the past few years have led to several studies by the federal and provincial governments analyzing the root causes of the country’s housing supply and affordability problem, and recommendations for action.

The taxation ideas proposed above advance some of these recommendations. The Ontario Housing Affordability Task Force recommended the creation of an arms-length municipal services corporations that would build, own and operate housing related infrastructure.41 As well as finance the infrastructure using debt rather than development charges. And the Canada-British Columbia Expert Panel on the Future of Housing Supply and Affordability recommended increasing the supply of below-market rental housing through a long-term funding commitment.42

The urgency to leverage and enlarge the pool of capital available for new housing construction—five times the current level of deployment—is becoming greater, as provinces and the federal government take on unplanned new spending to support businesses and communities impacted by U.S. tariffs. The net effect on both levels of government is less fiscal room to support other priorities, including housing. Restoring housing affordability needs to be a short and long-term strategic priority for all levels of government. Doing so will free up household disposable income that can be re-invested to grow other sectors of the economy. It will be a sustainable outcome that can help safeguard today’s standard of living and economic prosperity for current and future generations of Canadian renters and homeowners.

For more, go to rbc.com/thoughtleadership

Download the Report

How dependent is the U.S. on Canadian electricity to power its homes and industries? Could electricity serve as a point of leverage in Ottawa’s trade negotiations with Washington?

These questions emerged after Ontario Premier Doug Ford imposed a 25% surcharge on its electricity exports to the U.S. border states of New York, Michigan and Minnesota—only to scrap it after Washington threatened to double tariffs on Canadian steel and aluminum. Electricity flowing between Canada and the U.S. are exempt from tariffs under USMCA, which explains why the Ontario government imposed a surcharge on electricity exports, a de facto export tax.

While Ontario’s threat has died down—for now—, the episode highlights the significance of Canadian electricity in cross-border trade dynamics. We shed some light on the continental power trade flow and whether electricity could be a card worth playing in Ottawa’s negotiations with Washington.

Powering the U.S.

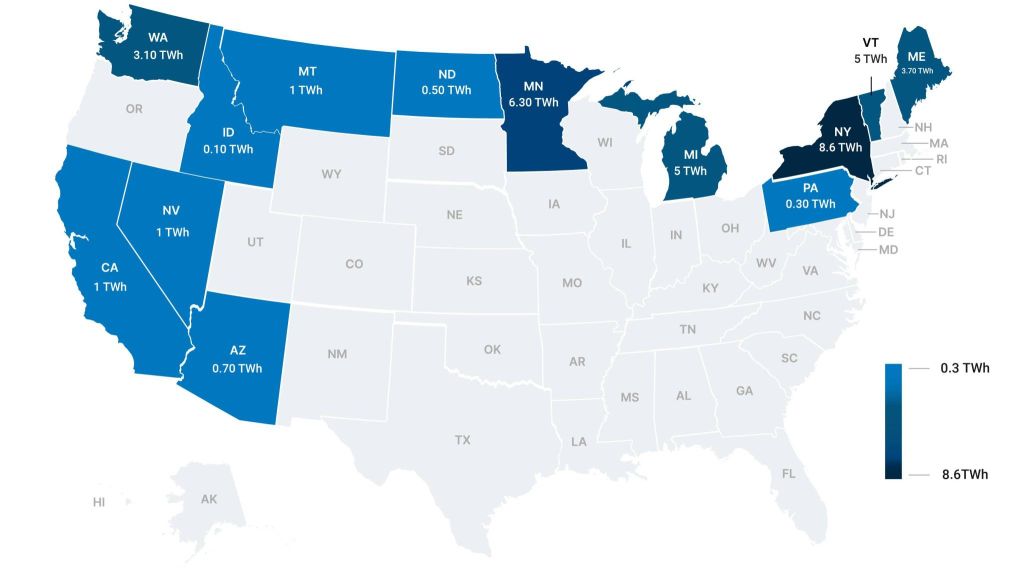
Canadian electricity exports to the U.S., by state (2024)

Source: Analysis of Statistics Canada data by RBC Thought Leadership

Four provinces dominate

Last year, Canada sent 35 terawatt-hours (TWh) of electricity to the U.S.–that’s less than 2% of total U.S. electricity generation—adding $3.4 billion to the Canadian economy. But some states are more dependent on Canadian power than others.

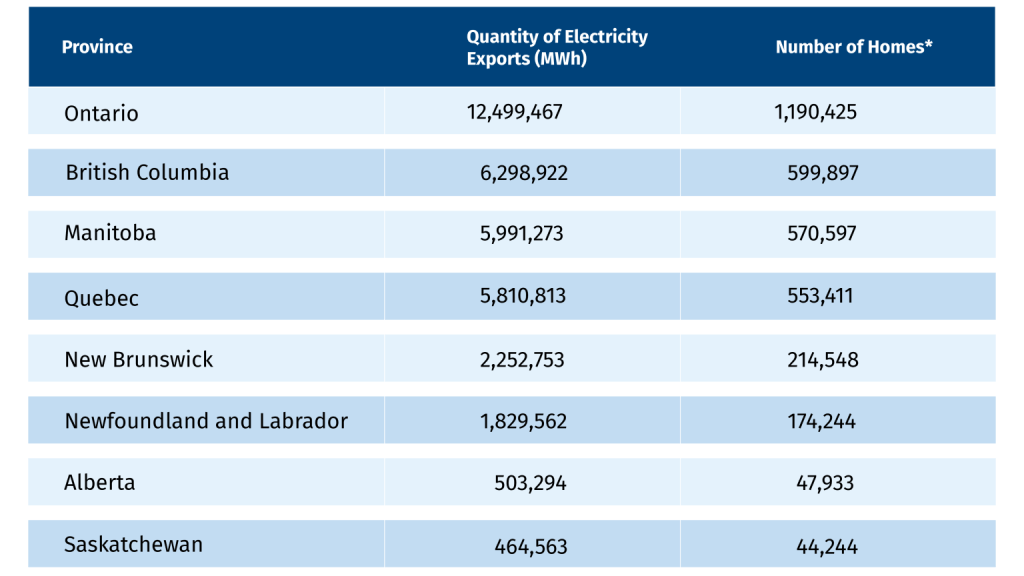
The movement of electricity within the continent follows a north-south axis, mirroring the broader trade pattern for physical goods. Four provinces dominate the Canada-U.S. electricity trade–Quebec, Ontario, British Columbia and Manitoba, accounting for 86% of exports.

Until 2022, Quebec had been the largest exporter, with one-third of Canada’s electricity exports originating from its border. While it has been surpassed by Ontario recently, that’s more a function of lower hydroelectric power output in Quebec due to droughts, and not a surge in the terawatt-hours (TWh) Ontario sends down to neighbouring states.

And it’s not entirely a one-way traffic. Occasionally, U.S. power surges back into Canada, with the above-mentioned four provinces also the biggest beneficiaries of these imports, accounting for 95% (21 TWh) of all U.S. electricity imports, especially in times of drought. British Columbia is the biggest buyer of American electricity, accounting for 57% of imports. Controlling for drought conditions and B.C.’s supply shortage—which will be resolved once the Site C hydroelectric dam runs at full capacity later this year—, Canada’s annual reliance on U.S. power would be 10 times smaller to around 2 TWh.

Canada Provides the U.S. with Enough Electricity to Power 3.4 Million Homes Annually

Provincial breakdown of electricity trade (2024)

*Numbers based on the power consumed by the average American home annually.

Source: Analysis of Statistics Canada data by RBC Thought Leadership

Maine and Minnesota are most dependent on Canada

Electricity as a bargaining tool in trade negotiations depends on the province’s market share in various U.S. jurisdictions.

While New Brunswick only accounted for 11% of Canadian electricity exports in 2023, the 5.5 TWh of power accounted for 44% of Maine’s power needs. When imports from Quebec and Newfoundland are added to the mix, Maine’s dependence on Canadian electricity jumps to 64%.

Similarly, Manitoba provided 13% of Minnesota’s electricity needs in 2023, a figure that’s expected to grow this summer. The Midcontinent Independent System Operator (MISO), which oversees transmission in several Midwest states including Minnesota, is anticipating a supply shortfall due to a confluence of events: the retirement of coal-fired power plants, growing demand, and slower than anticipated new generation assets coming online1.

Sourcing additional power from neighbouring system operators, Southwest Power Pool and PJM Interconnection are limited, as the grids operated by these systems operators are also facing a similar challenges2. That could leave Minnesota more reliant on Manitoba’s grid.

A weak hand?

For Quebec and Ontario, electricity is a weak hand to play. While Ontario supplies 6% of Michigan’s electricity needs, much of it is pushed out to neighbouring states, mainly Ohio and Indiana. New York, meanwhile, is reliant on Quebec and Ontario for 6% of its power.

Could the U.S. states easily switch to alternatives if Canada slaps new surcharges? New York is part of the Northeast Power Coordinating Council (NPCC), (which also includes Quebec, Ontario) and six New England states that can emerge as viable alternative suppliers. However, by 2026 demand growth in the northeast region is anticipated to cause a supply shortfall.

A co-ordinated strategy is required for Ontario and Quebec, if electricity is to be an effective bargaining chip with the U.S. administration. That may be tough for Quebec, as Hydro Quebec has an offtake agreement with New York’s independent system operator that may limit additional service level changes and charges outside of the contract.

What to watch for as trade tensions simmer

The Ontario government says electricity surcharges remain on the table as a retaliatory measure against any future U.S. trade actions. With reciprocal U.S. tariffs expected on April 2, Ontario may once again proceed with its credible threat of imposed the surcharge—as it briefly did on March 10.

A hot summer could further strengthen Ontario’s case. Keeping the lights on and air-conditioning running without Canadian electricity could prove to be challenging this summer for strained U.S. state grids. And that may prove to be the ultimate power play for Ontario, and other provinces.

But rather than a blunt negotiating tool, electricity trade represents a strategic asset for Canada—one that can help build deeper energy co-operation with the U.S. while ensuring stability for both economies.

Myha Truong-Regan is Head of Climate Research, RBC Climate Action Institute.


This article is intended as general information only and is not to be relied upon as constituting legal, financial or other professional advice. A professional advisor should be consulted regarding your specific situation. Information presented is believed to be factual and up-to-date but we do not guarantee its accuracy and it should not be regarded as a complete analysis of the subjects discussed. All expressions of opinion reflect the judgment of the authors as of the date of publication and are subject to change. No endorsement of any third parties or their advice, opinions, information, products or services is expressly given or implied by Royal Bank of Canada or any of its affiliates.

Mark Carney’s first act as Prime Minister was to axe the consumer carbon tax, as cost of living concerns continue to remain front and centre for Canadians.

Since the RBC Climate Action Institute launched our annual report Climate Action 2025: a year for rewiring in January, we’ve been asked repeatedly: “How will axing the carbon tax affect the building sector?”

A fair question, as half of homes in Canada are heated using natural gas or home heating oil. The burning of these fuels accounts for 75 to 80% of building emissions.  Ergo, the biggest opportunity to reduce these operating emissions is to electrify home heating.

The consumer carbon tax, until last Friday, applied to fossil fuels used to heat buildings. But even after factoring in the carbon tax, the cost of natural gas is about two times cheaper than electricity.  The economics are still heavily tilted in favour of using natural gas for home heating at this stage of the energy transition.

Provincial and federal governments, aware of the unfavourable economics, have intervened by providing consumers with incentives to move away from fossil fuel powered furnaces.  As we found in our analysis of the building sector, consumer adoption of heat pumps and their knock-on effects on capital mobilization and emissions are driving decarbonization efforts in the sector. All to say, axing the tax won’t slow down building decarbonization in the short-term, if other government policies, and spending by consumers and businesses stay the course.

Read our building sectoral analysis in Climate Action 2025: A year for rewiring for a deeper dive on the policies, people, and trends that helped move the dial on building decarbonization.

The energy transition presents a chance for Canada’s small, open economy to reset and recharge its global competitiveness.

The race is already on: As countries fuse their economic, environmental and geopolitical objectives, there is a growing imperative to link trade and climate policies. That pressure may grow as advanced economies turn to protectionism, including ways to reduce access for products made in countries with lower emissions standards. In the new trading paradigm, Canada has the opportunity to compete in the exports of low-carbon goods, while also navigating market disruptions caused by emerging clean tech innovations.

Luckily, Canada already has a head start in this low-carbon competition, with industrial carbon markets that can serve as building blocks of innovation, low-carbon economic growth and investment. By fine-tuning and crafting policy that delivers emissions reductions domestically without compromising our competitiveness, Canada can gain an advantage in the new low-carbon economy.

Indeed, industrial carbon markets can become central to Canada’s efforts to address new imperatives brought on by the energy transition. They can help us compete in low-carbon economies, build competitive advantages in international export markets, and decarbonize heavy industries—and get Canada closer to its Net Zero goals.

Yet Canada’s current system remains a patchwork, with nine industrial carbon markets—also known as Large-Emitter Trading Systems (LETS)—that price carbon for heavy industrial facilities. Each LETS has its own subtly different design elements and market conditions that operate within their provincial silos.

The fragmentation of these markets is undermining their potential, and hampering Canada’s ability to build low-carbon industries. Creating room for provinces to tailor their systems to regional priorities and politics makes sense—up to a point. But the current arrangement is hurting small markets with the presence of a few emitters raising transaction costs for firms operating in multiple provinces. As these companies trudge through different compliance rules, they are bogged down in an increasingly complex regulatory environment that slows investment decisions. The slowdown could lead to price volatility, limited participation, low trading volumes and a general lack of confidence in these markets.

Removing interprovincial trade barriers and integrating this patchwork of systems could offer considerable economic upside that could prove to be transformative for Canada’s energy transition.

Benefits Of Harmonization

Gaining efficiency, lowering costs
A firm producing basic chemicals with operations in Ontario and Alberta in Canada’s current system would need to employ two different approaches to calculate its emission limit, to ensure it complies with each province’s laws. That leads to duplication of systems and processes for record keeping, monitoring, reporting, and verification. It also entails greater administrative and compliance costs that will eventually be passed on to consumers. Harmonization could channel more investments in decarbonization and capital expenditures and less in the human capital required to comply with each set of regulations.

Harmonizing the governance can also make markets work better. A robust oversight regime including strong governance, disclosure, and enforcement of standards would contribute to market confidence. While studies examining the integrity and functioning of Canadian carbon credit markets is limited, studies of financial markets suggests that carbon credit markets with these characteristics would improve outcomes for market participants in the form of reduced transaction costs.

A deeper investment pool
Linking markets together is another key component of harmonization, enabling the development of larger markets with a greater number of buyers and sellers that can connect quickly, reducing transacting time and search costs. Robust linkages would also create a larger market for carbon credits that are fungible across different LETS, increasing the pool of potential buyers.

Corporate Canada’s Competitive Advantage

It’s hard to evaluate short-term, sector-level (let alone firm-level) implications of industrial carbon pricing. An industry’s competitiveness will heavily depend on its structure, including costs and profitability, long-term demand for its products, and the existence of cost competitive, low-carbon substitutes. It also depends on whether key trading partners have policies in place that give preferential tariff treatment to goods produced in jurisdictions with carbon pricing schemes. And this is without accounting for other forms of policy support.

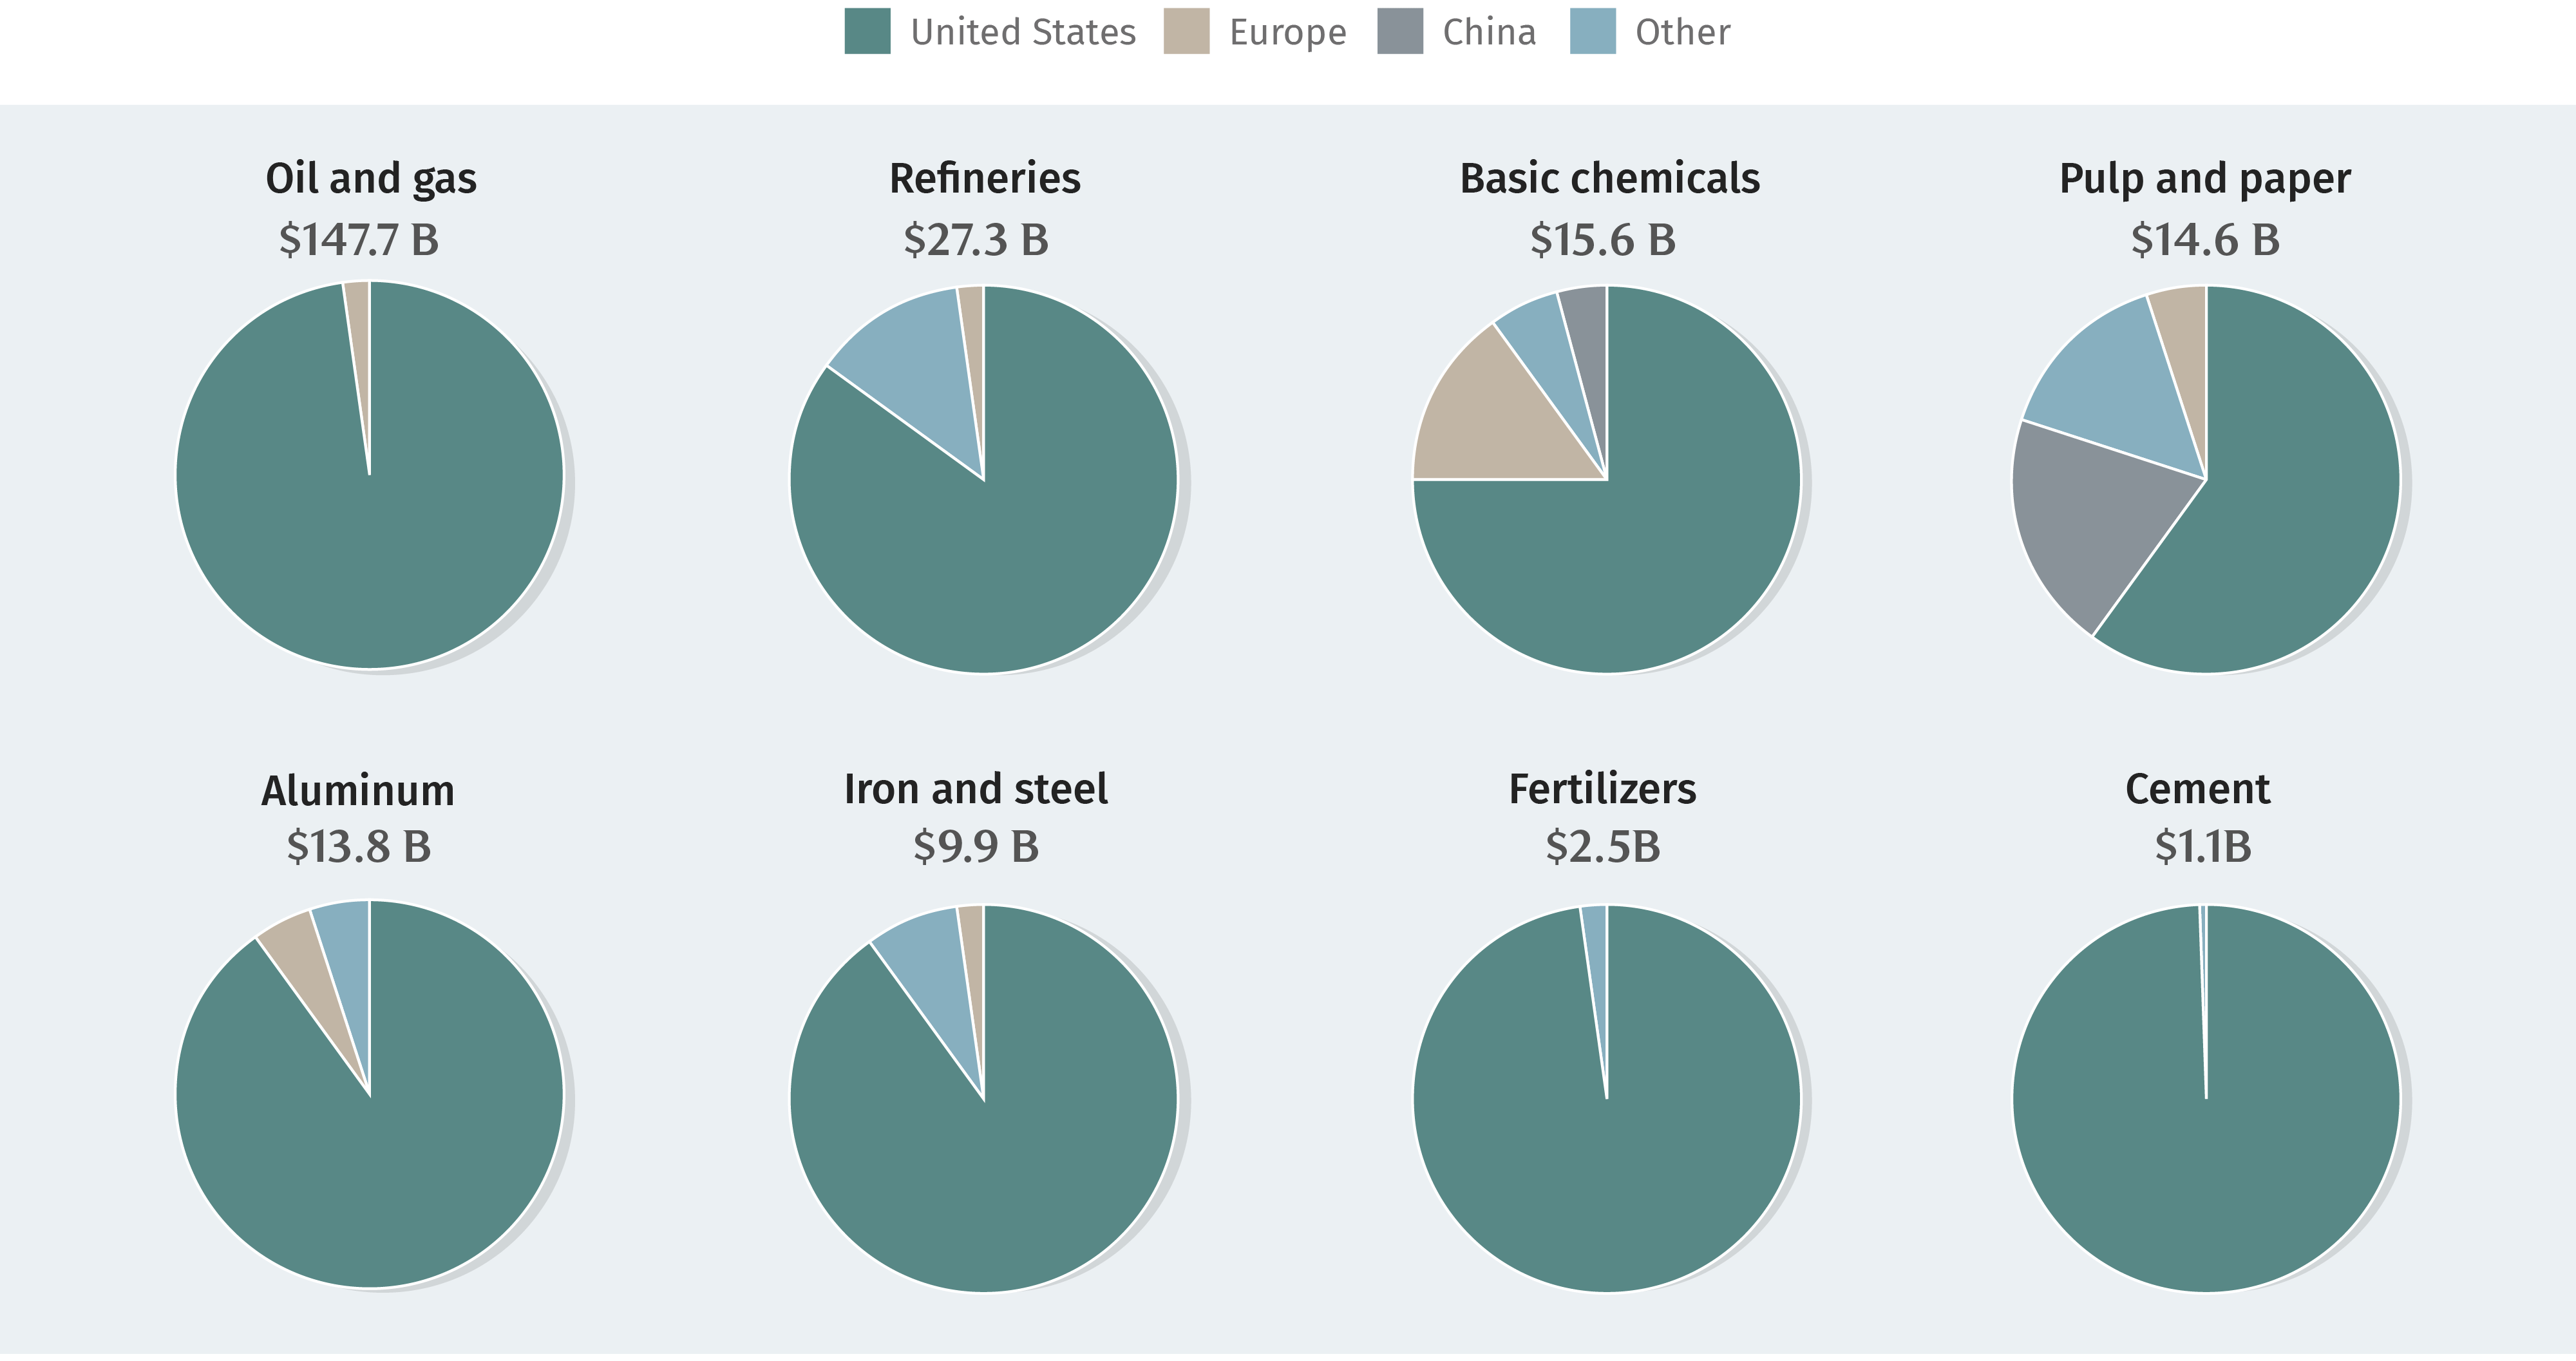
Canada’s carbon pricing scheme covers eight key Emissions Intensive Trade Exposed (EITE) industries. The goods produced by these industries, which last year contributed $232 billion to the Canadian economy, are exported to three key trading partners–the U.S., which is Canada’s largest trade partner, the EU, and China.

Canada’s Biggest Carbon-Intensive Exports

Canada’s top export destinations for its carbon-intensive products

Source: RBC Climate Action Institute analysis of Statistics Canada data

Competing with Trade Partners
The EITE industries expected to benefit from carbon pricing are those with significant trading activity with the EU and China—both have LETS of their own, with vastly different dynamics.

Canadian goods are anticipated to be cost competitive with those produced in the EU, given similar industry cost structures and stringency of the EU’s carbon pricing regime. The EU’s Carbon Border Adjustment Mechanism (CBAM), set to come into effect in 2026, is a tariff scheme that gives preferential treatment to goods produced in countries with carbon pricing will have limited impact in eroding the cost competitiveness of iron, steel and aluminum produced in Canada.

Exports destined for China will have a harder time competing on price, given China’s substantially lower cost structures compared to Canada. It’s an advantage that is supported by China’s extensive use of subsidies in key industries and an abundant supply of low-cost labour. China’s relatively lower carbon price of $19 per tonne of CO2e, compared to Canada’s $80 per tonne CO2e, would have limited impact on eroding the cost competitiveness of Chinese goods compared to Canadian goods.

At face value, industries exporting to the U.S. are also at a cost disadvantage since there is no federal carbon pricing regime stateside. Canadian goods with embedded carbon costs would have to compete with U.S. goods without this cost.

Part of this cost disadvantage for key industrial sectors can be offset through system design, as well as the revenues that firms can generate from carbon credits. Recent research from Clean Prosperity and the Transition Accelerator found that revenue generated by carbon credits is the largest policy incentive available to most sectors within heavy industry. They remain Canada’s lowest-cost policy option to attract low-carbon investment into the country. In the long-run, these investment flows can position Canada to be globally competitive in new low-carbon industries.

Beyond Industry Bottom lines
Cost competitiveness, however, should not be equated with profitability and the long-term viability of an industry. Profitability ebbs and flows with economic cycles.

The viability of any industry depends on long-term demand. Canadian exports to the U.S. are concentrated in three industries, with oil, natural gas and refined petroleum products, such as gasoline, accounting for 79% of all EITE exports. Greater electrification, including the shift from gas-powered to electric-powered cars, less reliance on natural gas for space heating and electricity generation, and energy efficiency improvements is changing the U.S. energy mix, and shrinking the long-term demand for oil and natural gas.

Falling demand and market size at the industry level does not necessarily lead to broader economic stagnation. A study of B.C.’s carbon market found that, in the aggregate, carbon pricing does not have an adverse impact on its economy or employment, with employment shifting from emission intensive industries to cleaner ones. A study of the French carbon market also found similar greening of employment—evidence that carbon markets are operating as predicted by economic theory.

Similarly, Germany, the European Union’s largest economy and heaviest emitter within the EU carbon market, was able to leverage carbon pricing to cut the emissions intensity of industries, by reducing consumption of natural gas and petroleum and improving the energy efficiency of industrial processes, according to a study. This was achieved without lowering employment, GDP growth or exports.

There are limited data and studies providing insights on how Canadian provinces have adjusted their economic development strategy to safeguard their EITE industries. Some jurisdictions such as Alberta have addressed this policy challenge by building regulatory compliance flexibility into its carbon pricing regime.

Such policies also aim to ensure industries are not fiscally penalized, in the short run, as they invest in low-carbon technology, which are costly long-term investments. Under Alberta’s Technology Innovation and Emissions Reduction Regulation (TIER) system, firms can seek regulatory relief if compliance costs exceed 3% of sales or 10% of profits. In these situations, firms can use a greater number of carbon credits to reduce their compliance obligations and/or seek a greater “free” emission allowance.

Businesses repeatedly cite regulatory uncertainty as an impediment to moving forward with investment decisions. Harmonization can provide investors and markets with the certainty they need to invest in the country’s energy transition.

Navigating politics
Despite the many economic and trade benefits, and industry’s appetite for less regulatory complexity, harmonization has not been pursued for two key reasons. For some provinces, there’s a perception that harmonization could lead to an erosion of provincial autonomy to make decisions that protect their key industries. Harmonization introduces the need for greater coordination and consensus building. Processes that some provinces fear could limit their regulatory responsiveness to changing global market and regulatory conditions, and which is required to keep the industries located within their borders competitive. Many of these concerns can be addressed through governance frameworks when harmonizing the country’s LETS.

How To Harmonize LETS

LETS in Canada are already harmonized in some rudimentary ways, primarily through the headline price of carbon, which currently stands at $80 per tonne. But most of the finer details of both market design and market function vary from province to province—most notably the rules around who can hold and trade credits.

Harmonizing LETS and removing these interprovincial trade barriers will require reconciling details across systems that are at different stages in their development and maturity.

Except for Quebec, which shares a cap-and-trade system with California, all provincial and territorial use LETS known as output-based pricing systems. These systems regulate facilities based on their emissions intensity, rather than on their total emissions as with cap-and-trade. We limit this analysis to harmonizing output-based LETS across Canada. Integrating cap-and-trade and output-based markets beyond the headline price would be a far more complex, long-term challenge.

On both the substance and process of harmonizing LETS, federal and provincial governments can lean on their experiences with domestic trade deals in the pursuit of harmonization.

We outline two broad approaches.

All Parties Model
Harmonization through the All Parties Model requires strong central leadership with common standards across all provincial LETS. The Canada Free Trade Agreement (CFTA) offers a useful analogy for this more “top-down” approach to removing trade barriers. In the CFTA, the federal government and all provinces and territories have agreed to a shared set of provisions, definitions, rules, exceptions, institutional arrangements (e.g. dispute resolution), and exceptions, with a stated objective to “reduce and eliminate, to the extent possible, barriers to the free movement of persons, goods, services, and investments within Canada and to establish an open, efficient, and stable domestic market”.

Canada’s current approach to LETS, under the umbrella of the federal Greenhouse Gas Pollution Pricing Act (GGPPA), is but one possible version of the All Parties Model. Under the GGPPA, provinces are encouraged to establish and administer their own LETS.

On a rolling five-year basis, Environment and Climate Change Canada (ECCC) evaluates the performance of provincial LETS and negotiates with the provinces regarding the “equivalency” of their performance to federal standards. ECCC assesses equivalency every five years, with the next review coming in 2026. This will be the first review for some of Canada’s youngest LETS, most notably British Columbia, Saskatchewan, and Ontario.

Willing Partners Model
The Willing Partners Model offers a roadmap for any two (or more) provincial governments to harmonize their carbon markets. An analogous, “bottom-up” approach to removing trade barriers is the New West Partnership Trade Agreement (NWPTA). Through this effort, signatory provinces—British Columbia, Alberta, Saskatchewan and Manitoba—engage in a mutual effort to “liberalize trade, investment and labour mobility”. The provinces continue to amend, expand and update the agreement, most recently in 2022.

The Willing Partners Model is fundamentally an opt-in model. In the NWPTA, provinces agree to six shared criteria: definitions, obligations, rules, provisions, dispute resolution mechanisms, and exceptions to the agreement. Establishing shared criteria would be a starting point for any iteration of the Willing Partners Model for LETS. Fewer negotiating parties with a model that is voluntary can lead to an agreement with stronger shared criteria with a clearer value proposition for participating provinces.

A Willing Partners Model can also coexist alongside an All Parties Model. Just as any province can exceed the federal standards for LETS set out in the GGPPA, the NWPTA also defers to the Canada Free Trade Agreement (CFTA), where the provisions of the latter are “more conducive” to liberalization of interprovincial trade.

Degrees of harmonization
Beyond broad design details like the headline carbon price, there are many program elements of LETS that are not harmonized. Integrating these systems does not have to happen all at once. This gradual, step-by-step harmonization is also known as degrees of harmonization.

Two Components Of Harmonization

There are two core components to market harmonization. Governments can pursue each subcomponent individually or as part of a larger effort toward full harmonization.

Harmonizing market design
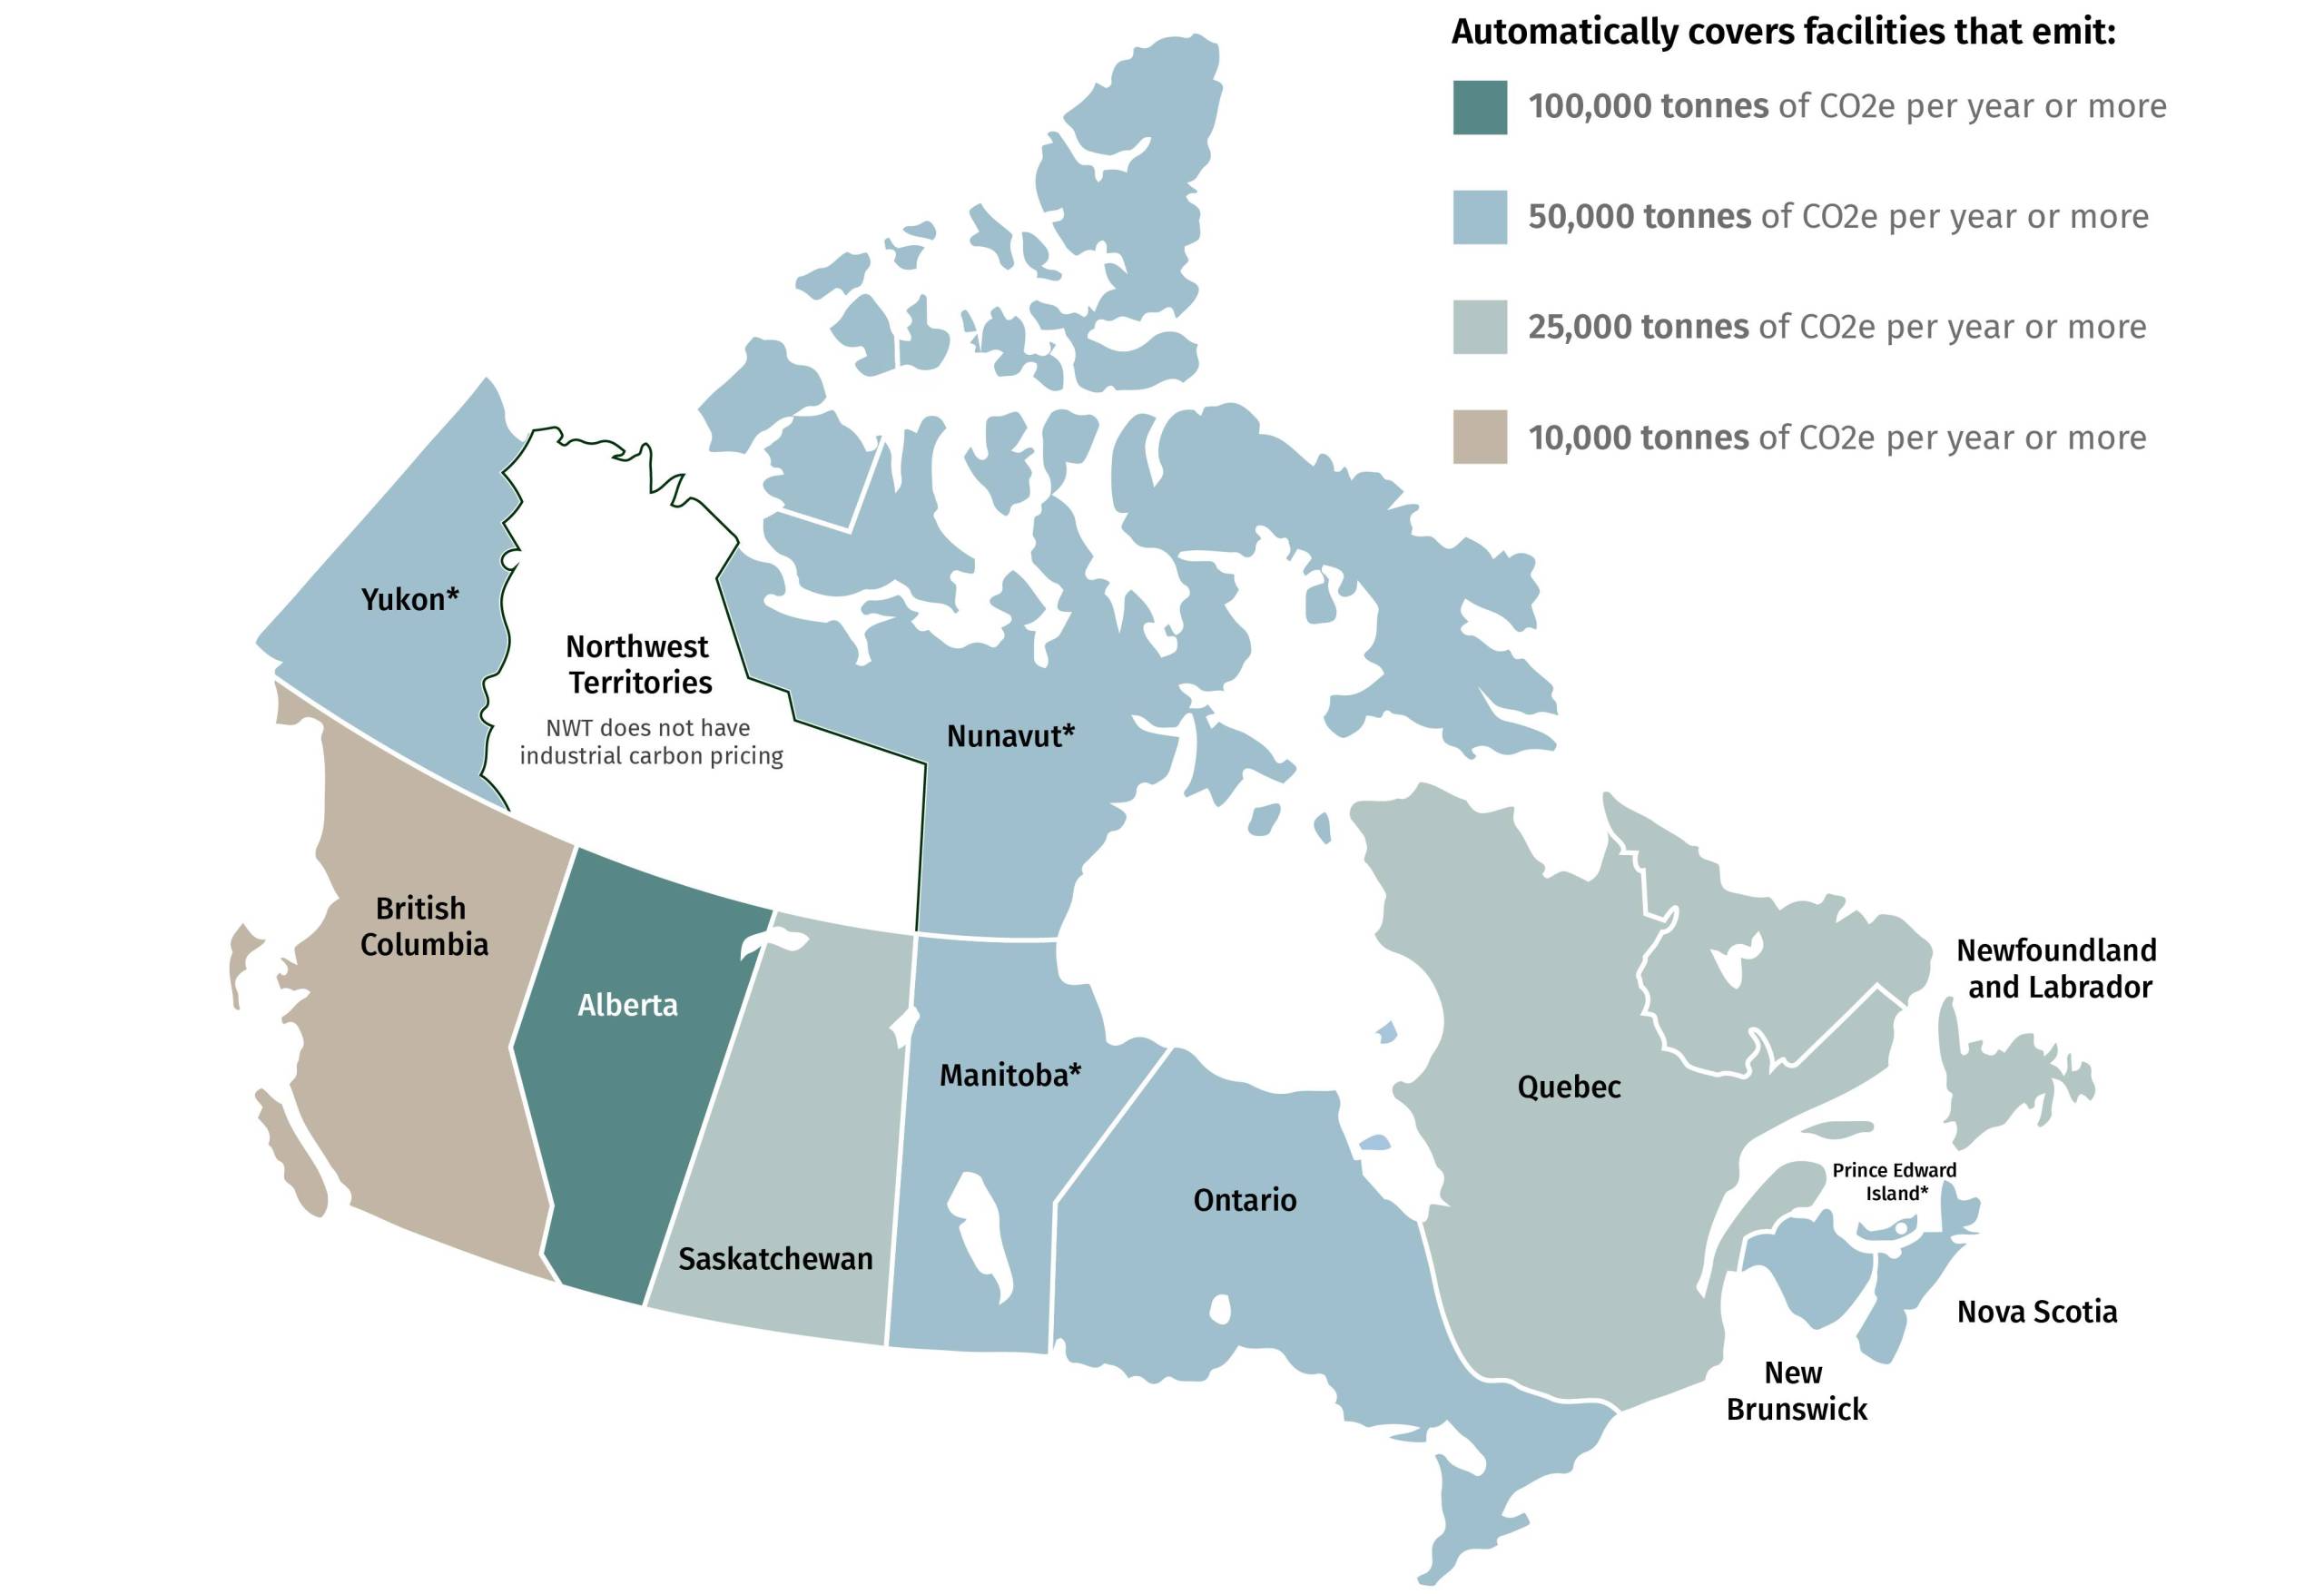
LETS market design involves decisions around how the carbon market will legally operate. This include what sectors will be covered by the program, the price of carbon and how exposed emitters will be to that price, who can hold carbon credits and under what conditions, and rules around monitoring, reporting and verification (MRV), including enforcement and non-compliance penalties. To take just one example, facilities that emit above a certain amount are automatically covered by LETS, but this coverage standard varies widely from province to province. Most LETS also allow smaller facilities to opt into and benefit from the program, but this standard also varies from province to province.

A Patchwork Of Carbon Coverage Standards

Canadian jurisdictions have different coverage threshold for large emitters

*Covered under federal framework

Source: RBC Climate Action Institute

Bringing markets in synchronicity
Full harmonization of market function includes full removal of interprovincial trade barriers, with fungible credits that are tradeable across provincial borders.

There are several elements of market design that need to be harmonized before this can occur. Some LETS have many different types of credits with unique properties. Alberta’s TIER system, by far the largest and most mature provincial carbon market, makes use of many different types of carbon credits to facilitate growth in different sectors. For instance, Alberta has two types of carbon credits with features that are specifically designed to encourage adoption of carbon capture technologies. Most other systems have a single credit type, and are more restrictive on who can hold carbon credits and participate in the market. These rules would need to be relaxed to facilitate harmonization of market function.

Beyond the mechanics of credit trading, true fungibility would also require harmonizing decisions around governance and review, including shared processes for evaluating the efficacy of different markets and the competitiveness performance of the firms participating in these markets.

Different provinces have very different industrial profiles and therefore face different competitiveness challenges. There is an urgent need for research detailing the opportunities and risks facing Canadian heavy industry as it seeks competitive advantages in a carbon-constrained world.

Canada’s current governance model for LETS—reviews in five-year increments—is sluggish. Provinces have the discretion to review and adjust benchmarks as needed, but have not done so to date even with looming risks of credit oversupply. Harmonized markets would need to make greater use of proactive strategies that can stabilize expectations around credit prices, respond to rapid or disruptive change in global markets, and reduce regulatory uncertainty for investors and operators. These strategies could include but should not be limited to policy tools such as carbon contracts and adaptive benchmark tightening.

Lastly, a shared commitment to measuring the outcomes of harmonization and the effects on provincial economies could help ensure data-driven decision-making around LETS moving forward. Provinces could also share digital infrastructure, registries, and programs that allow for credit tracking across participating provinces to maximize transparency to the broader public.

A Chance For Policy Alignment

Securing Canada’s economic future requires seizing every competitive advantage available. Many provinces have spent the better part of a decade (or more) standing up their LETS as a central plank of their decarbonization and low-carbon economic strategies. But the country’s fragmented approach to LETS presents significant opportunities for improvement. Taking stock of global market dynamics and trends towards protectionism, nearshoring and decarbonization, it may be time for a dialogue about what the next decade should look like for LETS in Canada. Harmonization, as part of a broader vision of economic competitiveness, should top the list for discussion.

Harmonization could help ensure that LETS play an outsized role in advancing Canada’s economic, environmental and geopolitical objectives. Global economic competitiveness, investments in technology and innovation, reduced regulatory red tape and costs: These and other benefits arising from harmonizing LETS are too numerous to ignore.

As policymakers shift their attention to the back half of the 2020s, and a more fragmented world, a fresh approach to our carbon markets could strengthen both trade and climate policies, and foster a new cycle of lower-emissions growth.

Contributors:

Myha Truong-Regan, Head of Climate Research, RBC Climate Action Institute

Brendan Frank, Director of Policy and Strategy, Clean Prosperity

Dale Beugin, Executive Vice-President, Canadian Climate Institute

Yadullah Hussain, Managing Editor, RBC Climate Action Institute

Caprice Biasoni, Graphic Design Specialist

Related Reading

Owning the climate podium:

10 ways Canada can accelerate investment in decarbonization

High Rise, Low Carbon:

Canada’s $40 billion Net Zero building challenge

Power Shift:

How Ontario Can Cut Its $450-Billion Electricity Bill

For more, go to rbc.com/climate.

Download the PDF

Download

Policymakers in Canada’s fastest growing cities face a triple challenge over the next decade: how to build their infrastructure for a rapidly growing population, continue lowering greenhouse gas emissions, and ensure that neither strain municipal finances.

Against this backdrop, low to zero-carbon district heating systems, and in general district energy systems, are emerging as a fiscal and climate tool that municipalities are deploying to tackle their growth, climate and fiscal trilemma. The low-carbon neighbourhood systems have the potential to lower building emissions by just over a third in Canada’s biggest cities, according to our research.

District Heating Systems – A Solution for Multiple Challenges

District heating is a large-scale approach to heating a cluster of buildings with energy produced by a central heating plant. It’s not new to Canada, though. The first central steam heating plant was established in 1878 in London, a mid-sized city in southwestern Ontario. The plant provided downtown businesses with heat, distributed through an underground network of pipes to individual buildings. The network-based neighbourhood approach to heating fell out of favour in the country around the late 1950s, as natural gas became widely available for space heating.

Canada’s ratification of the Paris Agreement in 2016—a legally binding international treaty on climate change—has compelled municipalities to explore ways to transition away from natural gas for space heating while also scaling their greenhouse gas reduction efforts. And district heating systems are increasingly emerging as their solution of choice. These new systems are designed to be low to zero carbon and take advantage of the most cost-effective and low carbon feedstock in close proximity to a system’s central heating plant. Common feedstocks include recovered heated sewer water, such as those from showers and dishwashers, heat stored up to 350-metre deep below the ground, or biomass, such as wood chips and plant waste. Heat pumps or heat exchangers, powered by electricity, are used to move heat generated at a central plant to buildings in the heating network.

The Climate Imperative

Buildings is the third largest source of emissions in the country and the single largest source of municipal emissions, accounting for an estimated 50-60% of all its emissions1.

The challenge of building physical infrastructure is that it’s locked in for up to 60 years in some cases. The strategic and political choices made today will dictate the long-term fiscal and climate health of these cities for more than half a century.

Embodied emissions, which is the carbon in building materials, is more challenging to decarbonize than operating emissions, due to the “green premium” and limited availability of low-carbon building materials.

Given this constraint, municipalities are focusing their policy efforts on reducing emissions from space heating, which account for 65% of operating emissions. A common policy lever is to mandate construction of more energy efficient buildings. A shortcoming of such policies is their failure to address a key change crucial to reaching Net Zero—to switch away from natural gas to carbon free energy sources, especially for space heating. Energy efficiency policies’ intent to lower the amount of energy consumed, and decarbonization policies’ focus on reducing emissions, has led to the emergence of another policy lever that can achieve both policy outcomes: the deployment of low or zero-carbon district heating systems.

Scaling district heating systems could lower building sector emissions in Canada’s largest cities by 36%

Building upon analysis that engineering consultants RWDI undertook for the Climate Smart Building Alliance, the Climate Action Institute estimates that building sector emissions in Canada’s largest cities could conservatively be reduced by 36% annually, were 27% of all new building floor space connected to a district heating system powered by low or zero-carbon energy sources2. That’s four and a half times greater than the current rate of decarbonization for the electricity sector, which has already experienced the fastest decline in emissions in Canada over the past several years3.

The Fiscal Imperative

Municipal infrastructure is costly to repair and maintain. The Federation of Canadian Municipalities’ latest report estimates that local governments across Canada have a $170 billion infrastructure repair backlog, an amount that is 217 times greater than Vancouver’s 2024 capital budget4.

Property taxes, originally conceived to fund community-wide infrastructure and services, such as fire protection, roads and parks, have evolved since the 1990s to fund infrastructure that only benefits a subset of the community’s households and businesses. The trend towards socializing the costs of private benefits, combined with limited revenue raising tools, legislative requirements for balanced budgets and limits on public debt issuances have all contributed to the massive infrastructure repair backlog.

The on-going structural challenges of municipal finance, and the high capital and operating costs of greening infrastructure has municipalities on the hunt for innovative fiscal tools that can shift costs from taxpayers to ratepayers. Privatization of utility costs is emerging as a potential solution. To date, the greatest adoption of this practice is the provision of low or zero-carbon thermal energy through the creation of a district energy system.

District thermal systems, a subset of DES, provide a hat-trick of benefits for municipalities. They facilitate the creation of low to zero-carbon thermal grids, they are crucial to increasing the pace of building decarbonization, and they don’t impose a burden on municipal finances. For municipally owned systems, district thermal systems serve as a new and significant revenue stream, which can be tapped into without new legislative authority5. Revenues are generated, at the building level, from a variable charge for thermal energy consumption and a fixed charge for the amount of system capacity required to provide heat to a building.

The enabling factors for the triple benefit are a business model predicated on full cost recovery, spread over a 30-year time horizon, and aided by regulatory requirements that all buildings must have a utility connection for thermal heating6. System owners take on the initial capital risk of designing and building a system. These capital costs, in addition to operating costs, are directly passed onto ratepayers once a system enters operations. System owners are compensated for the asymmetric risks at project onset, through 30 years of steady, predictable and recession-proof streams of revenue.

The Path To Greater and Faster Adoption

Market forces have primarily driven the deployment of district heating systems to date. Five supply and demand policies, if enacted through Official and Secondary Plans, by-laws and climate strategic plans can speed up their scale and adoption.

  • Policy Support 1: Introduce Mandatory Connection By-laws

    The current crop of new low carbon district heating systems is driven by real estate developers looking to decarbonize their master planned greenfield projects. Devoid of infrastructure connections and utility connections, such developments are fertile ground for the deployment of district heating systems. The blank canvas gives real estate developers complete freedom to choose and build the most cost effective and climate friendly energy sources for their development, unlike other types of developments.

    District heating systems have also been deployed for brownfield developments, such as the redevelopment of the False Creek Neighbourhood in Vancouver. On brownfield sites, however, district heating systems often must compete with natural gas or other pre-existing thermal energy infrastructure. By-laws requiring real estate developers to connect their buildings to existing district heating systems can help in scaling demand, by removing developer discretion of the type of thermal energy connection to provide for their developments. Mandatory connection by-laws are common in Vancouver and the lower mainland of British Columbia.

  • Policy Support 2: Promote Integration of District Heating in New Projects

    District heating systems are most cost effective when deployed in high density, mixed-use developments where infrastructure costs can be spread across a greater number of buildings. The mixed-use characteristic of a development is important as it contributes to variable heating demand throughout the day, given the different demand patterns between residential and commercial buildings. This variability in peak demand is important for minimizing system build and operating costs. A smaller system can be built to handle total and peak demand, and peak operating costs are lowered as consumption is spread out.

    Introducing policies in Official and Secondary Plans that lay out the circumstances of when district energy systems should be considered will aid in their adoption and economic viability. The City of Toronto’s Official Plan has several policies requiring developers to consider the incorporation of district energy systems when planning new neighbourhoods or when developing in areas zoned for mixed-use projects.

  • Policy Support 3: Recognize and Reward Adoption

    An increasing number of municipalities have adopted Net Zero strategies and emissions reduction goals as part of their target-setting framework or building design and performance requirements, such as the City of Toronto’s Green Standard. These frameworks recognize the environmental benefits of low carbon district energy systems, including district heating systems. Municipalities can reward developers for their pursuit of low-carbon systems by refunding a portion of development charges and/or fast-tracking review of their applications.

  • Policy Support 4: Create a Strategic Energy Plan

    Municipal-wide energy plans, such as those adopted by the cities of Guelph and Edmonton, are another emission-reduction tools municipalities have adopted. Identifying where district energy systems will be built in an energy plan can aid in their adoption. They can be used to attract developers interested in incorporating ready-made, turnkey district energy systems in their projects. That’s the strategy the City of Guelph employed when it developed its district energy strategic plan in 2014. The plan identified 10 nodes in Guelph where district energy systems would be built by the city and the types of development targeted for each node.

  • Policy Support 5: Encourage Development of District Energy-Ready Buildings

    Requiring real estate developers to construct “district energy-ready” buildings to spur future demand has emerged as another proactive policy lever. Under these policies, developers construct their buildings with the equipment necessary for future connection to a planned district energy system.

Related Reading

High Rise, Low Carbon:

Canada’s $40 billion Net Zero building challenge

Timber Rising:

How Wood Can Spur Canada’s Green Building Drive

Power Shift:

How Ontario Can Cut Its $450-Billion Electricity Bill

For more, go to rbc.com/climate.

Download the Report

Download

Contributors:

Lead author: Myha Truong-Regan, Head of Climate Research, RBC Climate Action Institute

Yadullah Hussain, Managing Editor, RBC Climate Action Institute

Shiplu Talukder, Digital Publishing Specialist

Caprice Biasoni, Graphic Design Specialist

  1. Buildings generated 89MT of emission in 2022.
  2. Estimate based on the following DES connectivity ratios by building typology and floor space, for new construction occupied between 2024 to 2030: 50% commercial and institutional; 25% multi-residential; 10% single detached and attached homes. Annual savings starting in 2030.
  3. The average annual rate of emissions reduction for the electricity sector between 2020 to 2022 was 8%.
  4. Making Canada’s Growth a Success: The Case for a Municipal Growth Framework.
  5. Depending on system size and heating demand, a district heating system can generate profits equivalent to 15% of a municipality’s property tax revenue.
  6. All builders are required to provide utilities to their buildings. In the absence of regulation and ESG related emission reduction targets, builders have discretion over whether heating will be powered by electricity or natural gas. District energy systems, given their scale, can enable the use of wasted forms of heat, which is not economically viable at a building level.

Nuclear’s winter is over. It’s hard to imagine five years ago thousands of people would have trekked to Ottawa to talk nuclear. But a decarbonizing drive and a global pledge to triple nuclear energy by 2050 at COP28 has given the low-carbon source plenty of momentum.

Scores of engineers, financiers, and policy makers from around the world descended upon the nation’s frigid capital this week to discuss the prospects of a tried-and-tested tech, but with a new twist: small modular reactors (SMRs).

The new darling of energy transition was the theme of the invitation-only OECD Nuclear Energy Agency (NEA) event in Ottawa last week. It’s not hard to understand why. There’s a comfort level with SMRs since they are based off conventional nuclear reactors that are operational since the 1950s. The modular approach to manufacturing reactor parts also holds the promise of lower costs, compared to onsite construction. That’s an alluring quality as conventional nuclear projects have a long history of cost overruns, that’s led to losing taxpayer and political support.

Event participants were bullish on SMR’s ability to decarbonize hard-to-abate sectors. Their reasoning: Ontario’s 50-year nuclear pedigree. The province’s experience with the Bruce and Darlington nuclear plants is seen as a springboard for SMRs, leveraging a deep pool of skilled labour and technical knowledge, social licence, and a regulatory framework that’s best in class.

Yet, being an SMR first-mover comes with an eye-watering price tag of at least $1 billion in design costs. That’s even before construction begins. It has led to a waiting game with many in heavy industries and oil and gas sitting on the sidelines in the hope that a competitor makes the first move. The industry would need to move quickly to test SMR’s potential. Until SMRs’ high capital costs industry can be sufficiently de-risked, its potential to decarbonize sectors such as oil and gas and mining will remain on ice.

Why we wrote this

Last fall RBC partnered with BCG’s Centre for Canada’s Future and Arrell Food Institute at the University of Guelph. We set out to explore what we believe is Canada’s moonshot: to produce 26% more food by 2050 (enough to maintain our contribution to the global population as it grows) with fewer emissions. The result was The Next Green Revolution: How Canada can produce more food and fewer emissions.

Throughout the past year, here’s what we learned:
  1. Canada is uniquely placed to lead: Our assets are unparalleled, but we need to do more to maximize them. Other nations are allocating substantial funding to promote climate-smart agriculture. Canada can proportionally match those investments while establishing new market mechanisms to help finance agriculture’s sustainable transition.
  2. Nothing will happen without accurate measurement technology: Tools to monitor emissions accurately (especially carbon sequestration in soil) are essential to building markets and helping producers take advantage of them.
  3. Cross-sector collaboration is key: A successful transition to Net Zero demands a new approach. It requires public-private actors across the fragmented agriculture supply chain to work together, as one sector, toward a single vision.
  4. Private sector R&D is insufficient: Canada has invented some of the most important agricultural technologies globally. But private sector funding for innovation is at an all-time low. To remain leaders in this space, we’ll need private actors to invest.
  5. Skills gaps are limiting growth: The sector requires more workers to drive the Net Zero transition. From on-farm managers to data analysts, qualified workers and advisors are desperately needed on Canadian farms, but post-secondary funding is insufficient.
  6. Early adopters should be rewarded: A significant number of producers across Canada have engaged in climate-smart agricultural practices for years—if not decades. These pioneers could be left out as programs develop to financially incentivize farm operators making their first transitions to better soil health methods. To continue growing current carbon stock levels, early adopters must receive a financial benefit for their continued contributions.
  7. The world needs Canada more than ever: With global supply chains under stress from the Ukraine-Russia War and extreme climate events, many countries are facing food shortages or unstable supply lines. As a politically stable country, and a reliable supplier of safe, high-quality food, Canada has an opportunity to become the world’s sustainable breadbasket.

Key takeaways

  • The building sector is the 3rd most carbon intensive industry in Canada, accounting for 13% of all emissions in 2022, or 92 million tonnes (MT) of CO2e. Canada aims to cut that amount to 53MT by 2030.
  • Widespread adoption of wood, specifically mass timber, as a substitute or complement to concrete and steel could cut embodied emissions in buildings by as much as 25%.
  • Mass timber deployment in new apartments, condos, and office towers could cut emissions by at least 9MT, or nearly 10% of the sector’s emissions, by 2030.
  • Aside from emissions savings, greater use of mass timber in building construction could conservatively grow the mass timber market by $1 billion by 2030. A share of this growth is anticipated to flow to Indigenous communities as they are in the employment catchment areas for logging sites, sawmills and mass timber manufacturing facilities.
  • Addressing the cost of construction and occupancy insurance, and mismatch between supply and demand is essential before Canada can achieve emissions savings, economic, and job growth opportunities.
  • Canada has all the puzzle pieces required to become a global leader in mass timber. The country’s climate commitments are an opportune time for all players in the building sector to come together to act on this collective ambition.

British Columbia And Quebec Spearheading Canada’s Timber Drive

Completed mass timber projects, 2022

Source: Natural Resources Canada’s Mass Timber database, RBC Climate Action Institute

661

The number of completed mass timber projects in Canada

87%

B.C., Ontario & Quebec’s share of Canada’s mass timber projects

12

The number of storeys permitted for mass timber projects in Canada

A 10-storey building rising near Toronto’s Harbourfront may not stand out among the crush of the city’s skyscrapers, but as an environmental statement it stands tall. George Brown College’s Limberlost Place is a mass-timber-and-glass structure with ambitions of being a net-zero carbon emissions building. It’s an idea whose time has come. While towering steel-and-concrete structures once symbolized economic growth, they are now emblematic of the climate challenge that needs to be scaled. The extensive use of carbon-intensive cement, steel and aluminum in buildings has made it the third most emissions generating sector in Canada, accounting for 92 MT of CO2e1, or 13% of all emissions in 2022. Rising populations, continued urbanization and a rush to develop multi-storey concrete buildings to address a housing supply crisis could make it harder to rein in emissions. Canada can tap into its rich forestry resources to create a global market for large beams, panels and posts made of treated wood, that can potentially replace concrete and steel or dramatically cut their use—and their associated emissions. The rise of Limberlost Place, and the smattering of similar structures dotting Canada, suggests we may be on the cusp of the next wave of sustainable buildings: made with low-carbon mass timber and assembled like an Ikea wardrobe to help bring down emissions.

Rise of mass timber

The emergence of mass timber in Canada as a complement and alternative to concrete and steel first emerged in 2007, with the completion of several commercial and institutional buildings in British Columbia, Ontario and Quebec2. These include the College of the Rockies Kootenay Centre South in Cranbrook, B.C., the Winnipeg Humane Society in Manitoba, and the OslerBrook Golf Clubhouse in Collingwood, Ontario. Prior to this point in time, national and provincial building codes did not permit the use of mass timber. Canada now boasts 661 completed mass timber projects. The United States, in comparison, has about 356 completed projects. Governments or colleges/universities commissioned most of the early commercial and institutional buildings. And while they still dominate the building type mix, there’s a notable shift to multi-storey residential buildings, driven by private developers and builders. Today, a third of all planned and under construction mass timber projects are residential multi-storey projects.
Insight

Wood first: B.C.’s Mass Timber Playbook

Several enabling policies has made British Columbia a leader in the use and production of mass timber within Canada and internationally.

The long-time champion of its forestry sector and its products, B.C. introduced The Wood First Act in 2009, with the mandate to use wood in provincially funded buildings. The “wood first” procurement approach for public projects continued with successive governments and culminated with the establishment of the Office of Mass Timber Implementation in 2020. A Mass Timber Demonstration Program was announced in 2020 to support early adopters of mass timber, such as Adera Development, to accelerate wider adoption of this low-carbon building material. The province remains quick footed in addressing regulatory barriers, specifically building code requirements. British Columbia was the first province to permit six-storey wood frame residential buildings. When the National Building Code of Canada (NBC) was revised, in 2020, to permit 12-storey mass timber buildings, the province followed suit, even though the NBC was not finalized.

The province leveraged its abundant forestry resources to mirror the playbook used by many European countries to promote mass timber. Countries with sizeable forestry sectors, such as Austria, Germany, Sweden and Finland were some of the first European countries to remove building code restrictions on wood—the most significant obstacle to mass timber use and adoption. Recognizing that government support is often needed to commercialize and scale widespread adoption of new products, these governments also provided project development, and research and development grants for builders and developers to build with mass timber.

The 9 MT emissions imperative

12-25%

Drop in buildings emissions if developers swap concrete & steel with mass timber

6%

Concrete, steel and aluminum’s contribution to Canada’s emissions

9%

Decline in building sector emissions due to widespread use of mass timber

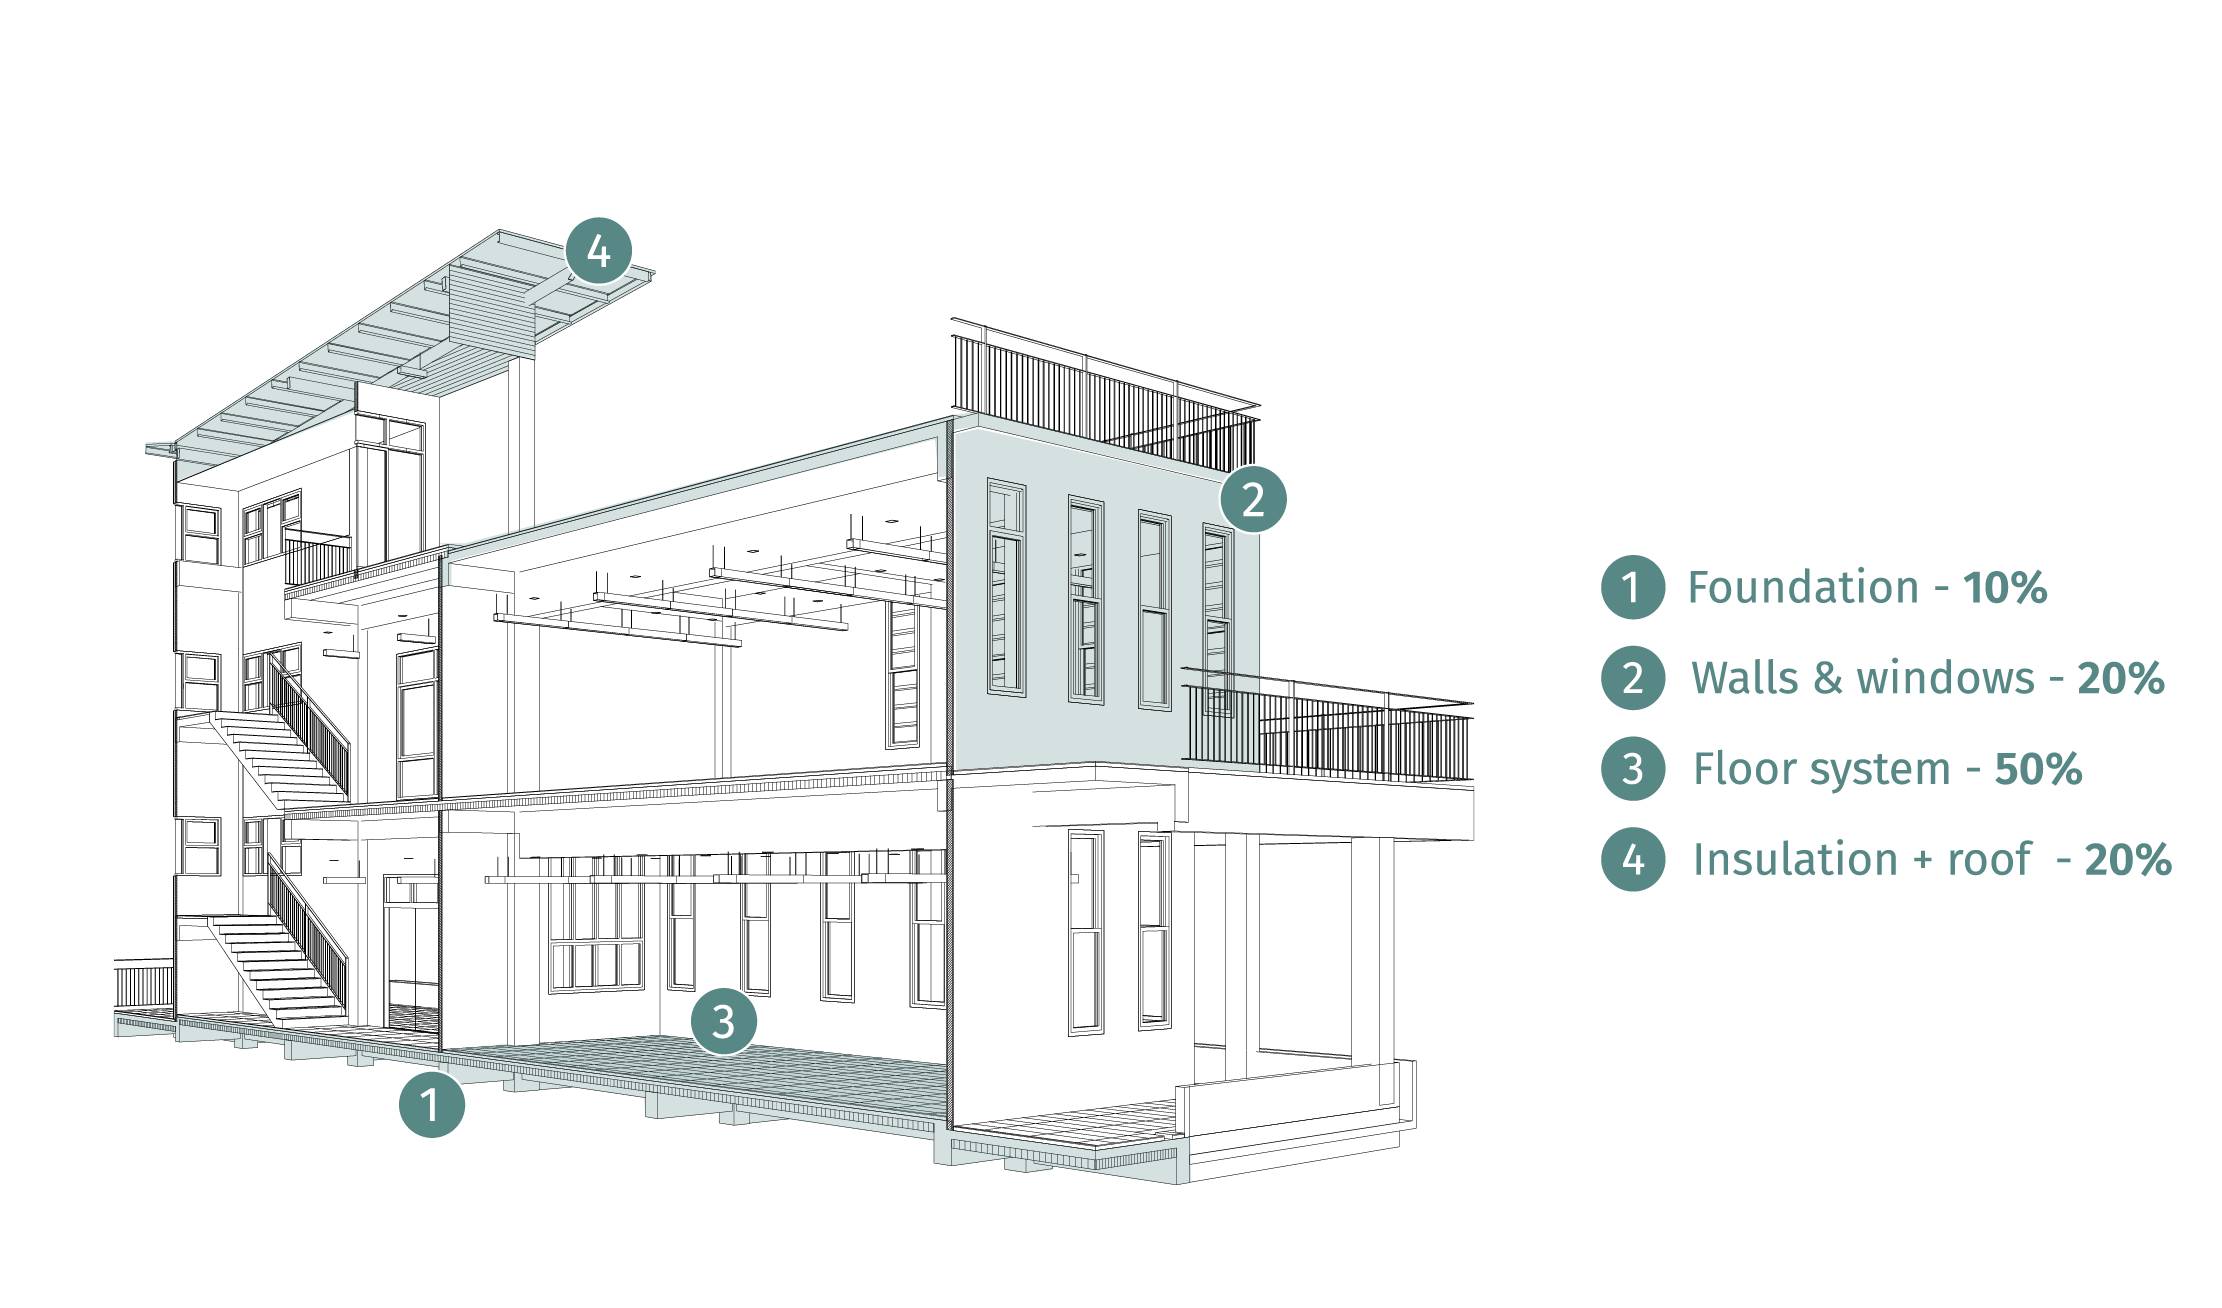
Concrete and steel’s emissions profile is 6 and 5 times greater than wood, respectively3. Within the context of buildings and embodied emissions, concrete, steel, and aluminum account for 6% of Canada’s total emissions or 41 MT of greenhouse gas emissions, in 20224. In multi-storey buildings, the floor system is the largest total surface area within a building and accounts for 50% of a building’s embodied emissions,5 which reside in the materials that are considered especially challenging to decarbonize. Given the emissions profile of a building’s floor system, much of current decarbonization efforts have focused on this structural building element. Multi-storey buildings constructed with a mass timber floor system can reduce their average emissions by 27% for the floor system and 12% to 25% for the entire building structure6, according to builders with extensive experience working with mass timber.

Embodied emissions profile of a mid-rise tower

The sector could cut 5.5 MT in emissions by 20307 if one-third of all new apartments and condos and all new office towers, in major urban centres, were constructed using mass timber. Emissions could decline by another 3 MT if all future apartments and condos were constructed using a mass timber floor system and domestic manufacturing capacity was not a constraining factor8. These emission savings demonstrate that small efforts, such as changing one element of a building’s structure, can lead to significant emissions savings, even though the size of the gains may pale in comparison to other purely technology-based solutions, such as heat pumps or electric vehicles. Construction with mass timber could also lower on-site vehicular traffic and reduce the use of fossil-fuel powered heavy equipment. Unlike concrete, mass timber is a prefabricated wood product that can be delivered in a few shipments and then stored on a construction site. Mass timber practitioners, Veronica Madonna of Athabasca University and founder of architect firm Studio VMA, and Lee Scott of Element5, a mass timber manufacturer with plants in Quebec and Ontario, have found that this storage benefit can reduce on-site vehicular delivery traffic by 80 to 90%, compared to the construction site for a traditional concrete and steel building.
Insight

The story of embodied emissions in steel and concrete

Mass timber, steel, and concrete all have their origins as natural materials extracted from or below the earth’s surface.

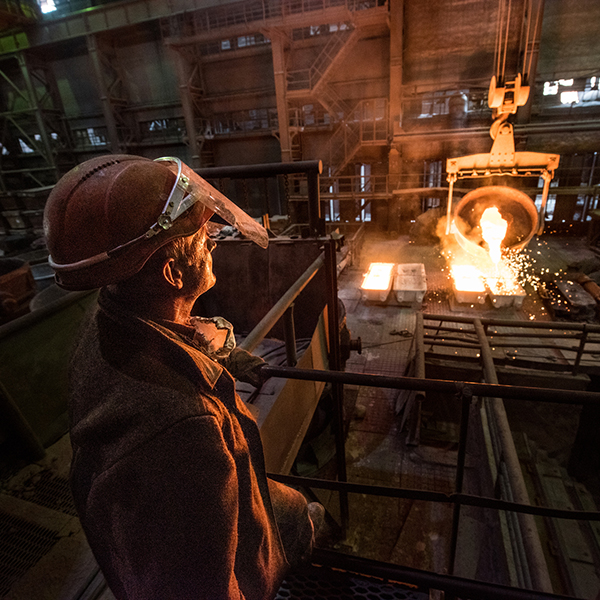
The energy and industrial processes required to transform iron ore into steel and limestone and clay into cement, and eventually concrete, are the reasons for their high embodied emissions profile, compared to mass timber. The industrial processes for steel and concrete require using extraordinarily high heat, between 1,400 to 1,600 degrees Celsius, to transform raw materials in blast furnaces or kilns. Energy required to power blast furnaces for steel-making accounts for 87% of emissions generated in the steel making process, according to the International Energy Agency. For cement production, the reverse is true, with 65% of emissions attributable to industrial processes, specifically, the release of greenhouse gases from the heating of limestone and clay in kiln ovens. Mass timber’s significantly lower emissions profile can be attributed to a manufacturing process that largely leaves the original raw materials intact.

Another advantage is that mass timber weighs about 30% less than concrete. The downstream benefit of lower on-site delivery traffic and higher weight differential is lower transportation related emissions. The prefabricated nature of mass timber combined with its relative lightness compared to steel and concrete, means that less heavy machinery such as cranes are needed on a construction site. And when they are used, they have a shorter running time. Both practices reduce the fossil fuel used to operate construction machinery, lowering emission levels.

Canada’s opportunity to capture a slice of the global mass timber market

3x

Growth in Canadian jobs associated with mass timber by 2030

3x

Growth in Canadian GDP from mass timber by 2030

$4.9B

Global mass timber market by 2030

Mass timber accounted for 1% of all building construction materials in North America last year. The global mass timber market reached $1.6 billion in 2022 and is forecast to rise to $1.9 billion this year10. Analysts estimate the market could reach $4.9 billion by 2030 if global demand continues to grow at an annual rate of 14.5%. Canada’s share of the global mass timber market is $379 million in 2023. And it’s growing, with an additional $649 million expected to be added to the country’s economic output from the production of mass timber, under a scenario where there’s no new manufacturing capacity by 2030. Increased production capacity and efforts by Canada to capture 25% of the global mass timber market could see economic output surpass $1.2 billion by 2030. If the construction material mix moves away from carbon-intensive concrete and steel and mass timber industry takes off, it could account for a larger share of the estimated $2.6 trillion global building materials market by 2030. While there are no official employment data for the mass timber sector, we estimate that the sector employs, directly and indirectly, about 4,000 Canadians in 202311. The sector’s job growth is anticipated to triple by 2030, to a high of 12,150 jobs across manufacturing, technology, forestry, design and engineering, if future demand materializes. Some of these jobs are anticipated to flow to Indigenous peoples as the employment catchment areas of logging sites, sawmills and mass timber manufacturing facilities often encompass their communities.

Canada’s Forestry Resources Could Boost Its Low-Carbon Economy

Two scenarios for Canada’s promising mass timber economy

RBC Climate Action Institute derived analysis using data in Polaris Market Research’s Cross Laminated Timber Market report, Natural Resources Canada Mass Timber data base, and Statistics Canada sectoral GDP data.

Barriers to Canada’s mass timber and climate ambitions

The steady increase in the number of mass timber projects underway in Canada is a testament to the building sector’s green ambitions. Industry interviews suggest a strong desire to increase the use of mass timber, but fundamental challenges are preventing market participants from raising their ambitions at a pace necessary to reach Canada’s climate goals.

Mass Timber’s Big Opportunity To Grab Greater Market Share

Breakdown of building construction materials use in North America

Source: RBC Climate Action Institute, Mantle Developments, 2022

Insurance underwriting has emerged as the most difficult challenge for both building construction and occupancy insurance. Presently, each building requires a bespoke policy, which significantly adds to a project’s final cost,12 and is ultimately passed down to the end buyer. Construction insurance premiums for a mass timber building can be up to 10 times the costs of a similar building constructed with steel and concrete. This layer of cost erodes the competitiveness of buildings featuring mass timber and hampers its widespread use in residential, commercial, and institutional buildings13. A second structural issue is a mismatch between the location of mass timber production and demand for the material. Patrick Chouinard, the founder of Element5, noted that B.C.’s early mover status resulted in a manufacturing base that is concentrated in western Canada, but current and emerging demand largely coming from eastern Canada and central and northeastern United States. Patrick Crabbe, Director of Mass Timber at Bird Construction, an early adopter and proponent of mass timber, estimates that 62% of capacity and 22% of demand is concentrated in western Canada, but 78% of demand and 38% of capacity is concentrated in eastern Canada14.
Insight

Sky-high premiums for mass timber buildings

Lack of data to assess the fire risk of mass timber buildings is primarily why building construction and occupancy insurances for mass timber buildings is 6 to 10 times higher than conventional steel and concrete buildings.

Exacerbating this situation is the small and niche market for mass timber. The lack of actuarial data has meant that insurance companies typically insure mass timber buildings to the closest approximate building structure archetype—a wooden frame house constructed with 2×4 lumber. Recognizing that wider adoption of mass timber is necessary to decarbonize the sector, construction services firm Ellis Don has made attempts to bridge the knowledge and information gap that exists in the insurance industry, by bringing industry players together to discuss the insurance challenge and explore potential solutions. These actions have yet to yield the desired outcome, either in Canada or internationally, and continue to present a significant obstacle to scaling the use of mass timber.

For manufacturers, one of the biggest impediments to scaling their operations is the cost of acquiring specialized mass timber machinery and technology, which is produced by only a handful of European based manufacturers. High cost of manufacturing equipment is also preventing new players from entering the mass timber business. The capital required to set up a manufacturing facility, with 50,000 m2 capacity, is estimated to cost $200 million, with the bulk of the costs attributable to machinery. Canada’s sawmills are dominated by players who produce “dimension lumber”, which are the 2×4/6/8 lumber found at big box home improvement stores and used to build the structural frame of single detached homes. Mass timber products are manufactured using dimension lumber but the moisture content and milling requirements of the lumber are materially different. These differences have created a shortage of appropriate mass timber “feedstock”, leading to a mass timber supply storage. Craig Applegath, a partner and architect at DIALOG, and early adopter of mass timber, estimates that there’s a two-year waitlist for mass timber in Canada15. Some mass timber manufacturers have addressed this third structural issue through backwards integration, by purchasing sawmills to control the type of wood that is sourced and how it is processed into feedstock. Bird Construction’s Crabbe applauds the leadership role that various governments have taken to spur interest in and use of mass timber. He notes that the success of their efforts has unintentionally led to the supply and demand imbalance. If not resolved, this market imbalance could slow the pace of mass timber adoption and the building sector’s decarbonization goals.

Recommendations

Canada may be late to the mass timber market, but it has caught up with its European competitors in less than a decade, both in the use and manufacturing of mass timber. It didn’t happen by chance either. Tailored federal and provincial policies and programs that were attuned to evolving market and regulatory forces, combined with visionary entrepreneurs along the building value chain drove Canada’s early successes. But we are just getting started. Canada has an opportunity to play a leading role in the global mass timber movement if it adopts the following recommendations: Standardize insurance underwriting to lower costs. Standardizing insurance fire risks for mass timber buildings, during building construction and occupancy, will lower insurance premiums and overall costs for builders and building owners. Continue funding capital expenditure grants. Federal and provincial grants have played a pivotal role in lowering machinery costs and enabling additional manufacturing capacity, either from existing manufacturers or new entrants. Continuing these programs would ensure supply can keep pace with double digit growth in domestic and international demand.

Conclusion

In the course of conducting research for this report we repeatedly heard from builders, architects, engineers, and manufacturers that Canada can and should be a global leader in mass timber research, manufacturing, and use, while spearheading efforts to decarbonize the building sector. While there are fundamental challenges that must be addressed before these ambitions can be realized, there’s industry consensus that these challenges are not insurmountable. Now is the time for all players in the building sector to work together to act on these challenges and solutions. And for Canada to showcase to the world that we are a nation of innovators in building construction and climate action.

Related Reading

The $2 Trillion Transition:

Canada’s Road to Net Zero

High Rise, Low Carbon:

Canada’s $40 billion Net Zero building challenge

The Next Green Revolution Project:

Food is again at the forefront

For more, go to www.rbc.com/climate-action-institute.

Download the Report

Download

Contributors:

Lead author: Myha Truong-Regan, Head of Climate Research, RBC Climate Action Institute

Farhad Panahov, Economist Yadullah Hussain, Managing Editor, RBC Climate Action Institute Darren Chow, Director, Content Strategy & Creative Production Shiplu Talukder, Digital Publishing Specialist Caprice Biasoni, Graphic Design Specialist

Patrick Chouinard
    • , Founder, Element5
Patrick Crabbe
    • , Director of Mass Timber, Bird Construction
Mark Gaglione
    • , Co-lead, EllisDon Building and Material Sciences Department
Vince Davenport
    , Co-lead, EllisDon Building and Material Sciences Department

  1. Estimates from the Canadian Climate Institute Early Emissions Estimates, 2023.
  2. Some architecture historians would argue that mass timber is not a new building material to Canada.  Mass (or heavy) timber had been used in Canada since the late 1800s.  The oldest surviving heavy timber building in Canada, which was built in 1895 and is still in use today, is located at 312 Adelaide Street West in Toronto.
  3. Hsu, S.L. (2010, June). Life cycle assessment of materials and construction in commercial structures: variability and limitations. Massachusetts Institute of Technology.
  4. RBC Climate Action Institute estimate based on analysis of data from the United Nations Environment Programme: 2022 Global Status Report for Buildings and Construction (section 3.3 Emissions in the Buildings Sector) and the Canadian Climate Institute’s Early Emissions Estimates for 2022.
  5. Interview with Mark Gaglione and Vince Davenport, co-leaders of Ellis Don’s Building and Material Sciences Department.  Craig Applegath of Dialog estimates that for some building forms, a building’s floor system can account for 70% of total building materials used.
  6. The floor system emissions reduction savings is based on the assumption that the mass timber building is constructed with a concrete and steel foundation.  The 12% and 25% total savings is for a mass timber structure versus an equivalent structure constructed using a composite steel and beam method.
  7. Residential units constructed between 2025 and 2030.
  8. The current mass timber manufacturing capacity in Canada is estimated at 1.1 million cubic meters, based on data from Natural Resources Canada.  In comparison, Architectural Record reports that European capacity is 1.6 million cubic meters.
  9. The emissions from using a mass timber floor system would be negative, were biogenic carbon taken into consideration. Ellis Don’s Building Materials and Science Department has estimated biogenic carbon savings of negative 170Kg/CO2e/m2.
  10. RBC Climate Action Institute derived analysis using data in Polaris Market Research’s Cross Laminated Timber Market report, Natural Resources Canada Mass Timber data base, and Statistics Canada sectoral GDP data.
  11. RBC Climate Action Institute derived analysis using data in B.C’s Mass Timber Action Plan, Polaris Market Research’s Cross Laminated Timber Market report, Natural Resources Canada Mass Timber data base, and Statistics Canada sectoral GDP data.
  12. Builders of projects that cost more than $50 million to construct typically need to bring in several insurance carriers to provide coverage for their projects.  This practice cannot be avoided because insurance carriers have a lower maximum insurable limit for mass timber than other conventional building materials such concrete, steel, and traditional wood.
  13. Builders with extensive experience in building with mass timber have been able to achieve cost parity with conventional steel and concrete buildings by optimizing design, construction, and scheduling practices.
  14. Data presented by Patrick Crabbe at the Brookfield Sustainability Institute’s Toronto Mass Timber Conference, September 2023.  Data obtained from Forest Economic Advisor Mass Timber North America report, July 2022.
  15. Estimate made in October 2022 in a Medium article titled: 10 Reasons to Build with Mass Timber.