RBC Thought Leadership The Growth Project

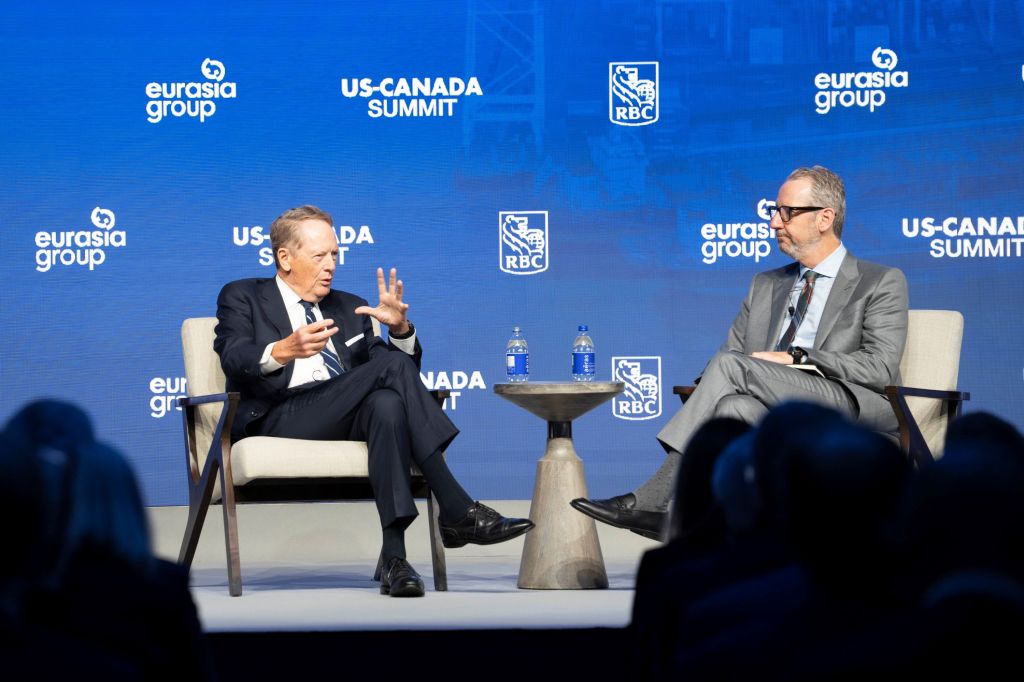
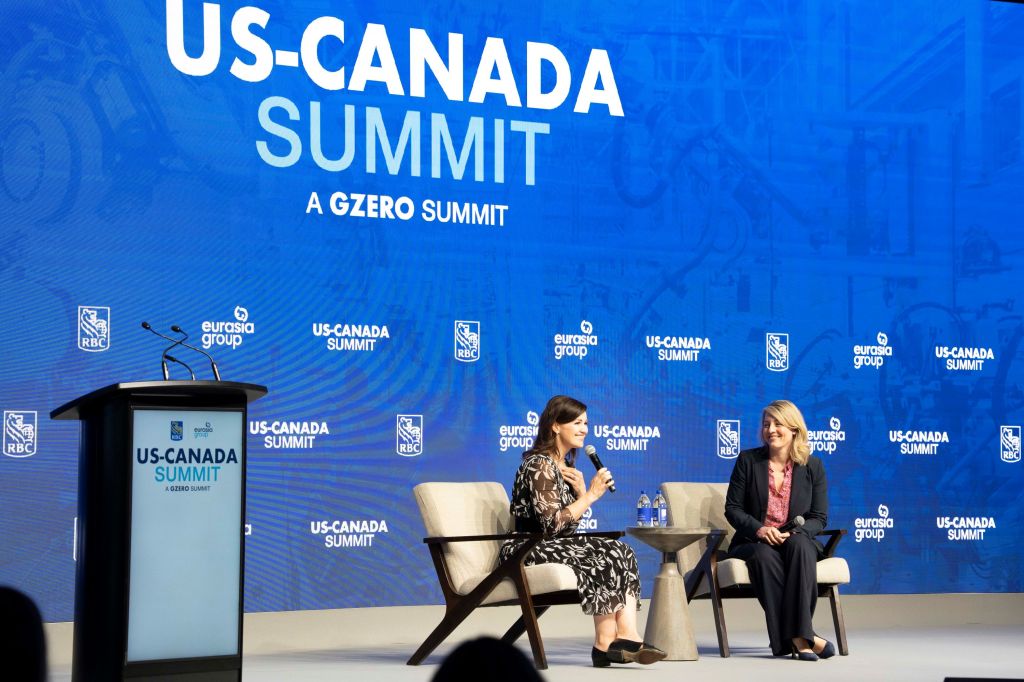
More than 500 business, government, policy, and community leaders, along with policy thinkers and academics, came together for the annual U.S.-Canada Summit, hosted by RBC and the Eurasia Group in Toronto on June 11, to discuss where the world’s most prosperous relationship is at—and where it might go.


Here’s some of what emerged:

Tone matters—and this year’s summit carried none of last year’s hostility. Both countries’ ambassadors spoke of hope, although with different expectations, and both sides spoke of tariffs as a new normal, again with different expectations. The fundamentals are too large to ignore: $1.3 trillion in annual two-way trade, 120-million border crossings per year, and a relationship woven through shared IP, talent, capital, and innovation. Trump’s former trade czar Robert Lighthizer acknowledged Canada is not the main problem—America’s real frustration is with China, Germany, and Japan. But Canada isn’t exempt, and he was blunt: tariffs aren’t going anywhere for a generation.

That’s not to suggest there’s rapprochement. Business leaders agreed the damage to Canada-U.S. relations is not irreparable—but there is damage, and it will take time to heal. Trust comes back slowly. Uncertainty recedes slowly, too. But the economic logic of closer Canada-U.S. ties remains strong. One Canadian portfolio manager said that no matter how they run their risk models, they end up with a 50-60% allocation to the U.S. The two governments now have the summer, and likely part of the fall, to find a way forward on trade. They’ll also have to recognize how much their economies are changing at the same time. This isn’t your parents’ trade zone anymore.

As hopes for free trade fade, a new age of state capital is evolving. Both Washington and Ottawa are now explicitly using government spending, tariffs, procurement, and regulation as tools of economic strategy—and the era of assuming that politics would leave globalization alone is over. Daleep Singh of asset manager PGIM put it plainly: we are in a world of fiscal dominance, with industrial policy in the midst of renaissance. Every cross-border linkage—trade, capital, energy, technology—is now at risk of being weaponized for geopolitical leverage. The result is more government debt, higher trend inflation, more political risk and a stronger case for physical assets connected to economic security.

Will this also mean a return to mercantilism? If governments try to gain economic favour by diminishing and constraining others—competitive strength over comparative advantage—Canada will need to play its many cards more assertively: low-carbon natural gas, critical minerals, food and fertilizer, nuclear fuel, and a stable rule-of-law environment that capital increasingly prizes. It presents material opportunities for business, too, as governments create incentives to reshore economic sectors and underwrite the scaling of companies, from AI to life sciences. Annesley Wallace of pension manager HOOPP captured the investor mood: Canada now has the attention of global investors in a way it didn’t a few years ago. But capital wants to see execution and policy certainty, not just ambition.

Data centres are the new factories—the physical infrastructure of the AI economy. And Canada is largely absent from the map. Hamid Moghadam of Prologis, one of the world’s leading logistics companies with $5 billion invested in Canada, was direct: companies building data centres go where it is easiest. Canada is not on that list. Prologis currently has no AI data centre capacity in Canada, with the Netherlands and the United States dominating. The culprit is a “quirky provision” in Canadian tax law that imposes a 15% burden on U.S. tax-exempt capital invested in Canadian properties—a friction that doesn’t apply in reverse. That could be the greatest cross-border risk as enterprise users (unlike the hyperscalers) turn more to inference models that can use low-latency infrastructure. Bell Canada is seizing on that with a new data centre in Regina that is, initially at least, expected to rely on U.S. users.

The slower pace of AI adoption in Canada—fewer than one in five companies, and fewer public sector users have deployed the technology—is starting to show up in economic and business performance. Canada is trying to catch up with a new national AI strategy that aims to invest in AI awareness and skills, as well as business adoption. Jenny Johnson of investment management firm Franklin Templeton put it starkly: the pace of AI is moving so quickly that companies that get it right will leave others in their sector behind permanently. She told her own executives: if you aren’t building agents yourself, you’re already behind. Trouble is, citizens in both countries are increasingly anxious and skeptical about AI. That’s leading to more grassroots pressure, including in this year’s mid-term election campaigns in the U.S., to regulate AI. 

Both Canada and the United States are navigating a crisis of public trust in technology—but they are responding in ways that could put them on a collision course over regulation, data, and digital trade. In the U.S., the AI boom is turbocharged by private capital, hyper-scalers, and a permissive regulatory culture. The concern is less about governance and more about falling behind China in the AI arms race, although local resistance to data centres, especially over their use of electricity and water, could change the conversation. Canada, by contrast, is pursuing a more rights-based, sovereignty-first approach. 

In both countries, and across their borders, the AI revolution is moving so quickly that governments seem destined to react. Ian Bremmer, Eurasia Group’s founder and president, warned of a deepening crisis in which no political leader could overcome a structural gap between technological transformation and outdated governance systems. Technology companies, he said, increasingly act as functional sovereigns in their own domains—and the absence of governance around AI is one of the most urgent risks on the horizon. Canada’s AI Minister Evan Solomon acknowledged the paradox: Canada’s best and biggest AI partner remains the United States, and access to frontier models, compute, and capital still flows primarily north-south. But as Canada builds its own AI sovereignty framework—and as the Safe Social Media Act, new privacy rules, and the AI for All strategy take shape—conflicts over data flows, platform regulation, and digital trade are increasingly likely. 

Defence is again central to the relationship, and central to emerging divisions. One big one: what technologies will dominate the battlefields and defensive lines of tomorrow? Case in point: Three days before the summit, an Iranian drone shot down a U.S. Apache helicopter, and then an American sea drone rescued the two downed airmen. The U.S. is investing heavily in AI systems, robotics and autonomous war machines, as well as bio- and cyber-weaponry. Canada is trying to catch up on advanced military technology, and at the same time restore and restock bigger hardware like fighter jets and submarines. The Canadian strategy is driven by economic policy as much as defence strategy, to build trade ties with European and Asian allies.

The wars in Ukraine and the Middle East have rewritten defence doctrine. Scalable production and resilient supply chains have proven as decisive as firepower. MDA Space CEO Mike Greenley put it this way: defence and space remain areas of full collaboration and full integration, even amid trade tensions. “The stronger we are, the better partner we are.”

That may require an intricate matrix of supply chains and partnerships in which Canada could continue to play a role in the F-35 fighter jet program while also building the GlobalEye partnership between Sweden’s Saab with Bombardier to make surveillance aircraft for Arctic defence. Energy and critical minerals will be a critical component of this new chapter. Vivek Lall of defence firm General Atomics identified a technology triad linking AI, nuclear energy, and autonomy as the defining framework for the next generation of defence capability—and argued Canada-U.S. collaboration has significant potential across all three.

The Arctic is no longer a remote policy afterthought. It has become a global economic, geopolitical, and strategic battleground—and one where Canada and the United States have no choice but to work together, and quickly. Olafur Grimsson, former President of Iceland, framed the challenge: the past decade has seen a flood of new arrivals into the Arctic, as China, Russia, and a constellation of Asian economies sought access. The old notion of sovereignty, where lines on a map settled the question, no longer applies in an environment that is rapidly becoming both economically accessible and strategically contested.

Thomas Dans, Chairman of the U.S. Arctic Research Commission, was direct about Washington’s view: both countries have “a lot of room both to catch up, but also to surpass and to really lead.”

He said North America needs to look over the North Pole and also toward the North Star. First challenge is Russia. Even though there may be room for cooperation over fisheries and shared resources with the Kremlin, Grimsson warned the West risks losing sight of what Moscow is doing in its own Arctic, particularly as Russia deepens energy, pipeline, and mining links with China, India, and other Asian powers. The same sort of resource development is possible on the North American side. Then there’s the skyward trajectory. Continental defence may rest in the ionosphere, but it doesn’t stay up there. The two countries need to develop land and sea-based systems in the Arctic to connect with their growing space-based defence operations.

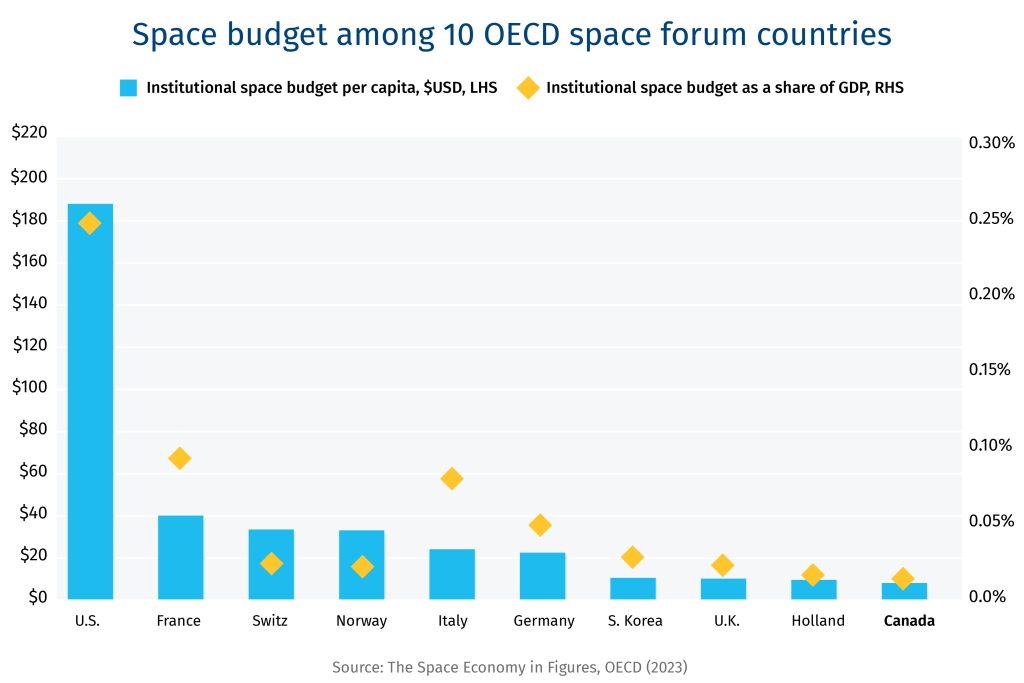
Canada has always punched above its weight in space—but largely as a junior partner to NASA. That posture is shifting. Canada is now trying to carve out a distinct space identity, rooted in its own strengths and connected to a broader set of international partners, while remaining deeply integrated with the U.S. It may pose the greatest challenge to continental cooperation. Canadian astronaut Jeremy Hansen said the two countries will find the most opportunity by playing to their strengths, rather than for diplomatic reasons. For Canada, those strengths include Earth observation, space-based communications, and robotics, as well as onboard computing.

Countries are increasing spending rapidly, creating a 2.5x economic multiplier for space manufacturing and technology. But leaving the so-called final frontier to commercial firms may underestimate the geopolitical tensions up there. In the race to return to the moon, China is partnering with 11 nations, the U.S. with 60. Canada is in the latter coalition and contributing meaningfully. Hansen compared the challenge to the ethos of a space crew: “People who can point out what’s broken and stop there is not acceptable in our space culture.” Canada’s space ambition requires the same discipline—specific proposals, not just aspirations.

Canada is seeking to diversify its economic and security relationships, without undermining its integral relationship with the U.S. Industry Minister Mélanie Joly said Canada has trade agreements with 52 countries. Discussions with the EU are deepening—not just as a response to tariffs, but to create genuinely integrated Canadian-European companies, and align industrial policies. Michael Sabia, Clerk of the Privy Council, was equally clear: Canada’s U.S. strategy and its broader global strategy are mutually reinforcing. “We are not decoupling. We are diversifying.” On China, his framing echoed U.S. language precisely—de-risking, not decoupling—with clear guardrails defining where Canada can and cannot engage.

But diversification is not free, and the infrastructure required to redirect Canadian trade is largely not built yet. West Coast pipeline capacity remains critically constrained, limiting Canada’s ability to sell oil and gas at premium prices in Asian markets. Port infrastructure in Vancouver and other Pacific gateways—rail connections, bridge capacity, terminal throughput—lags badly behind the ambition of a serious Pacific trade strategy. And permitting timelines for new infrastructure projects remain a systemic bottleneck. Those are solvable problems. Sabia’s closing argument was that Canada holds a genuinely strong hand—low-carbon gas, food, fertilizer, critical minerals, AI capabilities, and a trust premium that flows from values and history. “This is not a time for national anxiety. This is a time for confidence.” 

Download the Report

Canada and the United States are bound by the world’s largest bilateral trade relationship—one now under unprecedented strain. In what follows, we focus on four strategically significant industries: critical minerals, energy, automotive, and defence, which sit at the intersection of that relationship. We explore how deepened strategic alignment can enhance North American security, competitiveness, and resilience—and how that could be achieved.

The Challenge: The Canada-U.S. auto trade is under pressure on several fronts

  • U.S. Section 232 tariffs introduced friction at precisely the moment the industry needed continental coordination.

  • The deep structural threat to the US$100-billion Canada-U.S. auto trade is China, which produced 33 million vehicles in 2025—more than a third of the global total. China’s rising dominance is underwritten by scale, superior technology, development speed, and vehicle affordability. 

  • Four other mega forces compound that challenge:

    • Electrification is stalling in North America, even as Chinese-led propulsion electrification is accelerating everywhere else;

    • Vehicles are becoming software-defined platforms, with value increasingly concentrated in chips, sensors, and software rather than mechanical hardware;

    • Industry 4.0 is transforming manufacturing operations and reducing labour demand;

    • Market maturity, as slowing population dynamics and the rise of shared mobility platforms are changing ownership patterns among urban consumers.1

Collective Strengths

  • The U.S. brings the scale, capital, and market demand. American manufacturing expertise, R&D infrastructure, and domestic policy levers shape where investment flows across the North American system.

  • Canada brings complementary assets: award-winning assembly plants, global calibre parts-makers (e.g., Magna, Linamar), and a tech cluster with capabilities in sensors, AI, lightweight materials, and autonomy. BlackBerry QNX software, for instance, is already embedded in more than 250 million vehicles worldwide.2

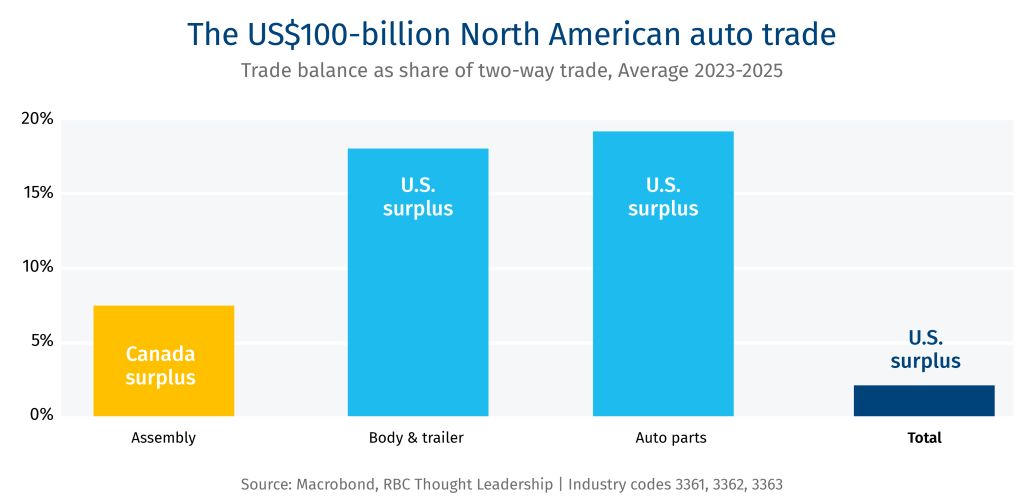
    The US$100-billion North American auto trade. Trade balance as share of two-way trade, Average 2023-2025.
  • Both countries have strengths in AI and autonomy, but trail China in battery chemistry, primary extraction and refinement of battery elements, and the manufacturing scale that drives efficiency.

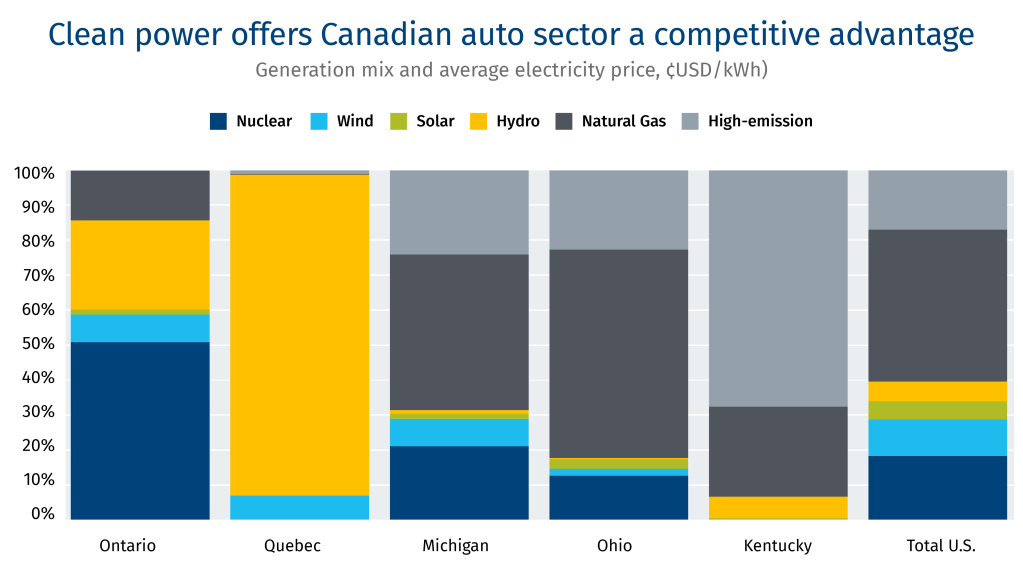
  • Canada’s power grid is clean and more competitively priced than comparable auto jurisdictions like Michigan and Ohio. This is becoming more strategically significant as electrification, onboard computing, and autonomous systems raise the power load per vehicle.

  • Canada’s critical minerals are a hedge against dependence on China. The mining and refining of copper, cobalt, lithium, and graphite would strengthen integrated battery, EV, and smart car supply chains. From mine to finished vehicle, the entire value chain can be completed within North America—much of it within a day’s drive to assembly plants.

  • Batteries are expensive and dangerous to transport (owing to their chemical composition), which makes Canada’s rail, Great Lakes shipping, and cross-border trucking a competitive advantage.

The Obstacles

  • Tariff uncertainty is the most immediate obstacle to growth and innovation. For Canada, the threat is existential. More than 90% of Canadian vehicles are shipped to the U.S. Even with a relatively low effective tariff rate, plant margins would be compressed, changing the calculus for investment committees in Detroit and Tokyo.

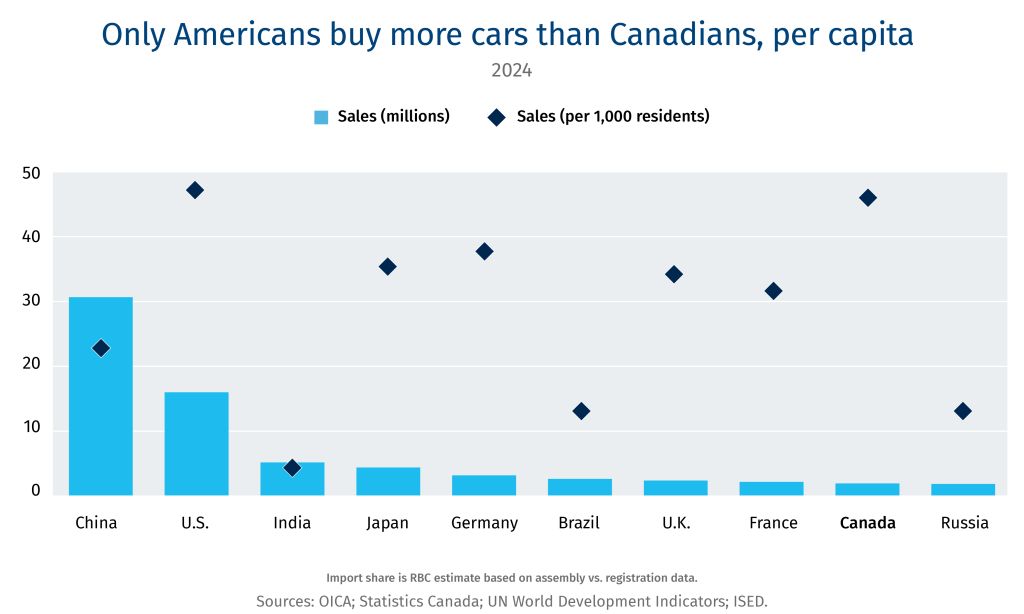
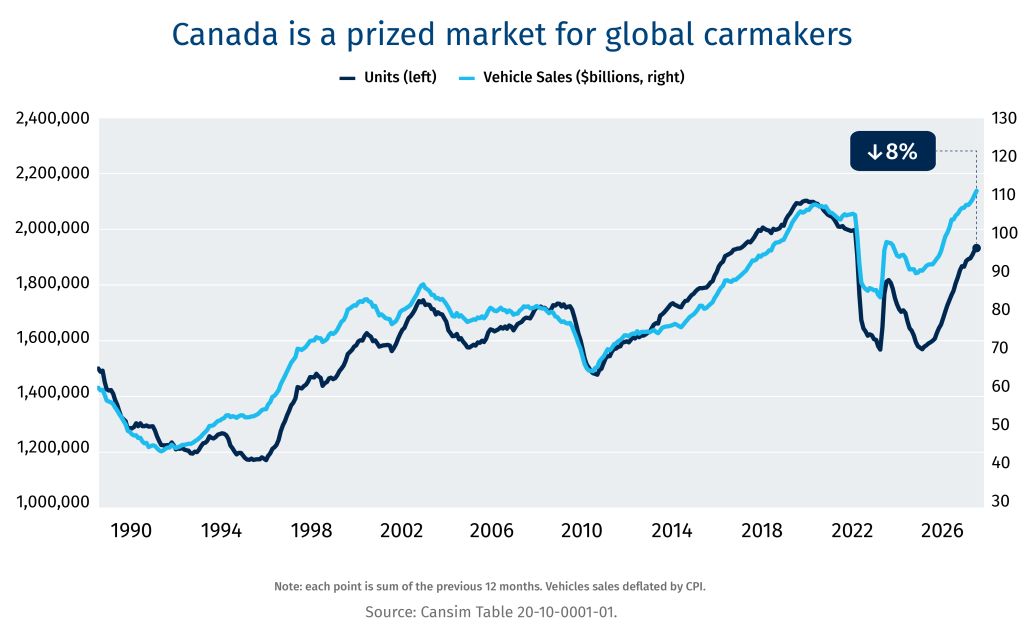
  • For the U.S., retaliatory tariffs are damaging but not fatal. Canada’s consumer market is large and lucrative—on a per capita basis, Canadians buy more vehicles than any other country. save the U.S. Canada is not only the largest export market for U.S. vehicles—it’s larger than the next 10 countries combined.

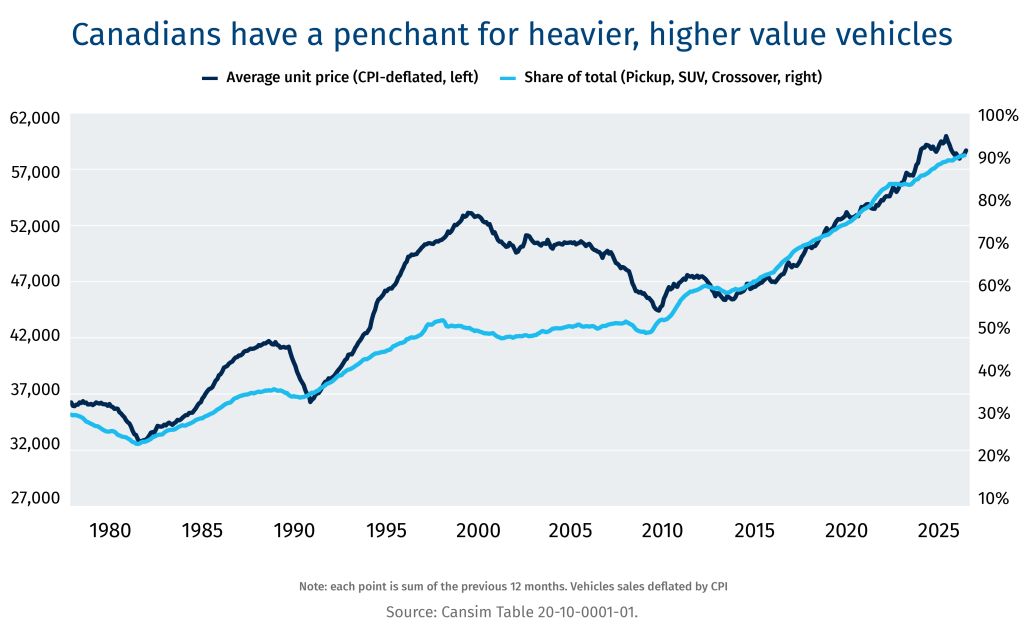
  • Relocating assembly within the U.S. would make vehicles more expensive for American consumers. Canadian aluminum is produced using clean, low-cost hydro and nuclear power and is a critical input for lightweighting vehicles. The Ford F-Series is North America’s top selling vehicle and contains some 850 pounds of aluminum. Canada supplies more than half of the total U.S. aluminum consumption. Reshoring production with tariffed aluminum could cost U.S. auto consumers US$1 to US$2 billion.3 Vehicle affordability has already deteriorated on both sides of the border. The average transaction price for a new vehicle now exceeds $50,000 in the U.S. and $60,000 in Canada, putting new vehicles out of reach for many consumers.4 The result is an aging vehicle fleet, as households stretch replacement cycles or exit the market entirely. Tariffs, onshoring mandates, and the cost premium associated with electrification threaten to compound the affordability challenge.

  • The EV retreat is stranding capital without solving the competitiveness problem. Detroit automakers US$53 billion in write-downs reflects a genuine misread of consumer behaviour and policy stability.5 Industry forecasters project North American vehicle production will remain below the 2016 record of 18 million light vehicles through the end of the decade.6 The pivot back to ICE and hybrid platforms buys time, but Chinese OEMs continue to build technological and scale advantages on the platforms—electrified, software-defined—that will dominate the coming decades.

The Path Forward

  • Trade Policy Reforms. Washington’s goal—repatriating manufacturing—reflects a legitimate industrial concern, but the production the U.S. seeks to recover did not migrate to Canada. Since 2000, both Canada (-1.7 million units) and the U.S. (-2.6M units) saw assembly volumes shrink as the continental assembly footprint migrated to Mexico (+2.2M units). Canada, the U.S., and Mexico could align and strengthen the Rules of Origin and reform Most Favoured National tariff policy, which would incent global OEMs to locate production within the bloc, while jointly levying tariffs on EVs, parts, steel and aluminum from outside the bloc—hedging Chinese dumping. Reforms to the Labour Value Content provisions such as raising the content share and the wage rate would help rebalance investment and production within the bloc, which has long been biased toward Mexico.7

  • Critical Minerals Auto Pact. Cooperation on an end-to-end supply chain would tie Canada’s world-class geology and mining expertise with American capital markets industrial demand. In exchange for duty-free access to the U.S. market, Ottawa and the provinces could formalize free trade for steel, aluminum, and copper, and off-take agreements, stockpiling arrangements, and price floors for cobalt, lithium, graphite, and rare earths—commercially de-risking private investment and converting Canada’s processing infrastructure into implicit U.S. supply chain security with no net new capital cost to either government. Extraction and refinement could utilize Canada’s vast capabilities in clean power.

  • Cooperation in Skills and Research. North American OEMs are pivoting toward extended-range electric vehicles (EREVs) and hybrids as the bridge between ICE and full electrification. Co-investment in testing facilities, SR&ED reform to cover autonomy, connectivity, and cybersecurity mandates, and immigration reform to attract engineering and AI talent would deepen the skills density needed to compete with China.

The Potential Outcome: Canada and the U.S. could be better prepared for an electrified, autonomous, and increasingly software-defined auto future by building on a bilateral partnership that ties Canadian aluminum, clean power, critical minerals, and advanced manufacturing capability to American capital markets, OEM headquarters, and consumer demand. Preserving market access for both parties could help keep vehicle prices competitive for consumers while excluding Chinese content from continental supply chains.

The Challenge: China’s Structural Dominance

  • Chinese dominance in the refining and manufacture of critical minerals is the most direct threat to industrial sovereignty in North America. China dominates processing for 19 of the 20 most critical minerals, commanding, on average, 70% of market share. For tech and battery materials like gallium, graphite, and rare earths, its share exceeds 90%.8

  • Questions about the weaponization of supply chain dependence are no longer theoretical. China imposed export controls on gallium, germanium, rare earths, and battery chain technologies during the height of trade tensions with the U.S. In 2025, Ford shut down its Chicago assembly plant for one week following China’s rare earth export restrictions. The U.S. Geological Survey estimates that a 30% supply disruption of gallium could reduce U.S. output by US$600 billion—2% of U.S. GDP.9

Collective Strengths

  • The continental response—who mines, who refines, and who captures the downstream value—will shape North American industrial and defence competitiveness through 2040.

  • Canada and the U.S. are already each other’s largest minerals trading partner—approximately $150 billion in bilateral minerals trade annually.10 Canada is the top source for U.S. critical mineral imports, supplying 20%.11 But the current system is fractured: Canada mines, China refines, and the U.S. manufactures. Closing the gap is the defining industrial policy challenge of the coming decade.

  • Canada has world-class geology across cobalt, copper, gallium, germanium, graphite, lithium, nickel, tungsten and rare earths, with a seven-fold supply potential by 2040.12 Canada also has mature or developing refining infrastructure, including Anglo Teck’s Trail Operation (germanium), Neo Performance Materials’ Rare Earth Metals Facility (gallium), the Sudbury corridor (copper, nickel, cobalt), and the Bécancour mineral processing ecosystem, which connects Quebec’s mines with processing plants and downstream battery manufacturing.

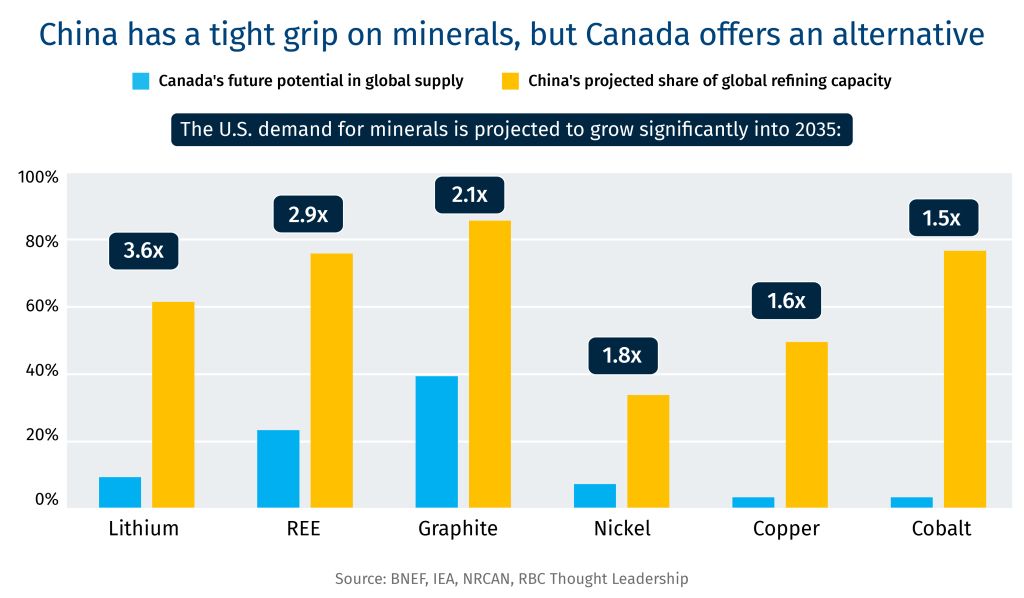
    China has a tight grip on minerals, but Canada offers an alternative. The U.S. demand for minerals is projected to grow significantly into 2035.
  • Canada has clean, affordable power and abundant water. The U.S. has manufacturing scale, dominant capital markets, and the political will to strengthen supply chains.

The Obstacles

  • China has access to nearly unlimited, state-subsidized capital to finance mines and processing plants.

  • The talent and R&D gap with China has widened. China has 39 university degree programs to train engineers and technologists in critical minerals—Canada has none.13

  • For many critical minerals, North American demand is too thin to anchor the market. In 2024, the U.S. accounted for less than 2% of rare earth consumption—far below the threshold needed to make offtake agreements commercially viable.

  • Investment cycles in mining are long. In a world where capital is flowing into short-cycle AI, attracting investment into the refining of low-volume minerals is economically challenging.

  • High labour and environmental standards are strategic advantages in the long run, but they generate permitting timelines that extend well beyond those in China. Processing facilities face additional environmental impact assessments.

  • Supply chains will form around demand, not supply, but most demand will come from renewables and EVs, not defence. Battery chemistry is evolving rapidly, and with it, mineral intensity. Until recently, cobalt was considered essential. Lithium iron phosphate chemistry has since displaced it as the dominant cell technology. Sodium-ion and solid-state could similarly disrupt lithium demand.

  • Canada cannot pursue a strategy across all 34 critical minerals simultaneously. Capital, talent, permitting bandwidth, and infrastructure are finite. A more credible strategy would concentrate investment in minerals where Canada has refining infrastructure already in place and where Canada’s clean power advantage is most decisive. The strategy could also be geared toward minerals with demand that is technology-path-independent and is supported by multiple end uses beyond EV batteries.

  • While states have a role to play in creating and supporting markets, regulatory capture by a few anchor firms is a threat to the public good.

The Path Forward

  • Canada’s supply infrastructure and U.S. demand architecture are symbiotic. A formal Critical Minerals Partnership would tie Canadian geology, clean power, and mining expertise with American capital markets and North American manufacturing demand in a pairing that no other allied combination could match.

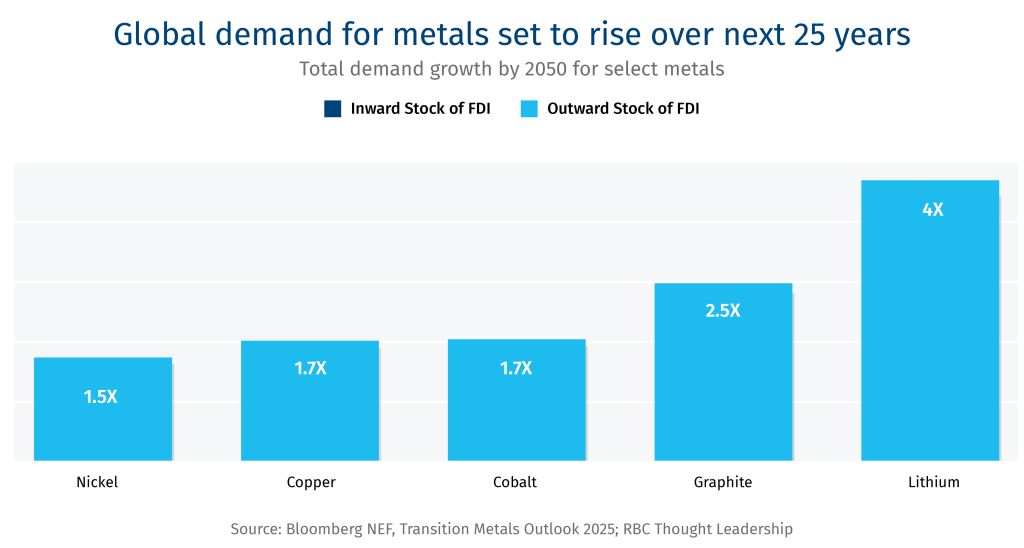
  • Long-term demand for critical minerals is expected to be strong. The IEA projects demand growth to 2040 for copper (30%), cobalt (50%), graphite (130%), lithium (350%), nickel (70%), and magnet rare earth elements (65%), driven by renewable energy, EV adoption, grid battery storage, and electricity network expansion. Defence layers on top of these, reinforcing the strategic case to build these supply chains now. Demand aggregation across the U.S., Canada, the European Union, the U.K., Australia, India, Japan and Korea could expand the market beyond 2.5 billion people.14

  • Project Vault works better with Canada. Canada’s federal strategy targets the same six minerals—lithium, graphite, nickel, cobalt, copper, and rare earths—mirroring Project Vault’s key focus areas. Ontario’s $500 million Critical Minerals Processing Fund is building the midstream refining capacity that U.S. OEMs need as a Vault counterparty. Explicit Canadian rules-of-origin eligibility under Vault—so that minerals refined at these facilities qualify as U.S. domestic supply—would convert existing Canadian processing facilities into implicit U.S. industrial capability with no net new capital cost to either government.

  • Allied demand aggregation works better if the U.S.-Canada bilateral partnership is the foundation. The Forum on Resource Geostrategic Engagement (FORGE) could be recast along NATO-like lines, wherein allies commit to procuring refined minerals from other allies as part of their NATO spending targets.15

  • China’s price manipulation is the shared threat that makes bilateral price stabilization essential. Use of a contract-for-difference (CFD), price floors, and volume guarantees could be applied bilaterally to Canadian processors, which would insulate North America’s supply chains against Chinese price manipulation.

  • Sustained investments in R&D, processing chemistry, and engineering talent are needed. Joint investment, shared technical training programs, and co-location of processing and end-use manufacturing could help build the skills density that neither country could develop on its own.16

The Potential Outcome: A North American supply chain could lead to reduced dependence on Chinese refining, tying Canadian geology and mining with American financing and manufacturing demand, deepening supply chain resilience and strategic capabilities simultaneously.

The Challenge: Security, Affordability, and Optionality

  • In 2024, Canada exported $170 billion worth of hydrocarbons to the U.S.—crude oil, natural gas, natural gas liquids, and refined products—accounting for 22% of Canadian exports. Canada supplies more than 60% of U.S. crude oil imports and virtually all natural gas imports. Two-way energy trade sits at $215 billion, underpinned by over 100 transboundary pipelines and transmission lines.17

  • Three imperatives define the relationship:

    • Energy security and sovereignty: Canada’s export dependence on a single buyer exposes both countries to disruption risk—political, logistical, or geopolitical. For oil, future demand growth is in Asia. For natural gas, demand growth is both Asian and North American.

    • Consumer affordability: Energy price volatility, whether caused by conflict in the Persian Gulf, tariff friction, or infrastructure constraints, passes through to households and industry on both sides of the border.

    • Value Maximization: The WCS-WTI price differential—historically US$10-25 per barrel—represents a structural transfer of value from Canadian producers to American refiners, driven by Alberta’s landlocked geography and insufficient export optionality.18

  • The crisis in the Persian Gulf has tightened heavy crude markets, elevated prices, and sharply illustrated the vulnerability of relying on politically unstable supply. The U.S. and Asian allies are assessing alternatives. Canada is the obvious answer.

Collective Strengths

  • Canada is the world’s fourth-largest oil producer, pumping 5.8 million barrels per day. The oilsands are a distinctive asset: long-lived, capital-intensive, and—unlike U.S. shale—resilient to short-cycle price volatility. U.S. crude production is plateauing: the EIA’s long-run reference case projects peak production in 2030, followed by decline in the 2030s. As the shale boom recedes, Canadian imports become more strategically important.19

  • North American heavy crude demand is structural. U.S. Midwest and Gulf Coast refineries are configured to process heavy, sour Canadian bitumen—the same configuration increasingly common in India and China. U.S. refineries with heavy conversion capacity will require a replacement source. Venezuelan production remains constrained by security, risk, and infrastructure. Canada is the only proximate heavy supplier at scale.20

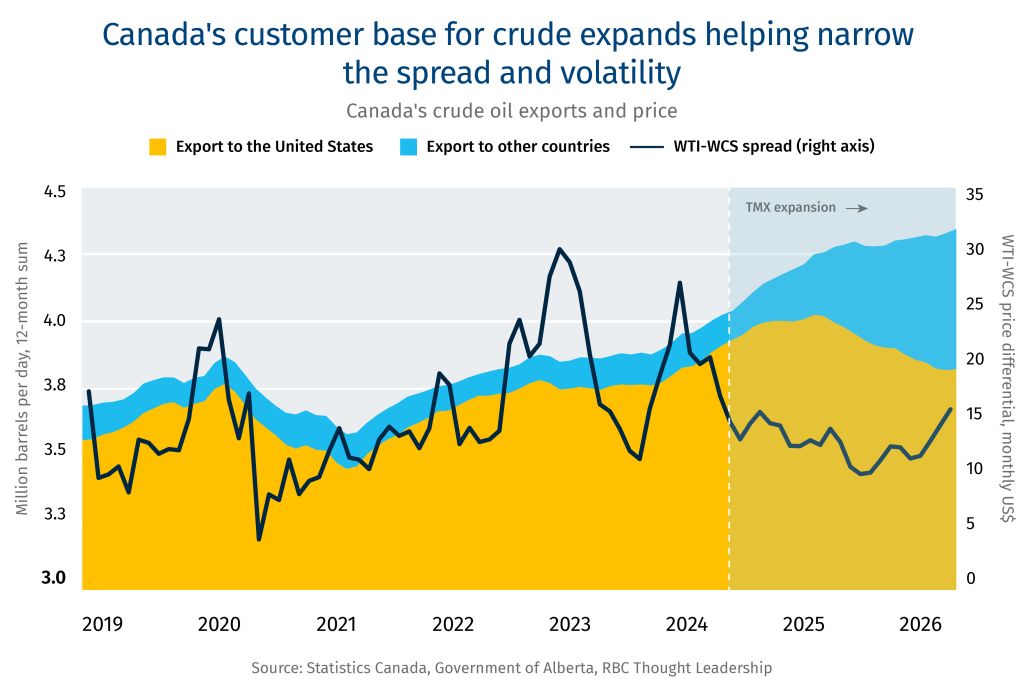
  • The Trans Mountain Expansion (TMX) has begun to transform Canada’s strategic position. Since it came online in 2024, TMX has tripled capacity to 890,000 bpd to tidewater. The WCS-WTI discount narrowed and stabilized from nearly US$30 per barrel in 2022 to approximately US$10 by 2025. Each additional barrel shipped to Asia rather than into the continental market compresses the differential, improving producer netbacks.21

    Canada's customer base for crude expands helping narrow the spread and volatility. Canada's crude oil exports and price.
  • On natural gas, Canada’s Montney formation in northeastern British Columbia is one of the largest natural gas resource plays in the world, and LNG Canada’s Kitimat facility, which shipped its first cargo on in June 2025, has opened Canada’s first large-scale Pacific LNG export route.

The Obstacles

  • Oil prices: low and volatile prices challenge greenfield expansion and pipeline infrastructure; high prices trigger demand destruction and accelerate the energy transition. Sustained greenfield expansion will require policy stability and expanded export infrastructure.

  • Greenfield investment in the oilsands is limited. Growth from existing facilities is achievable but requires a policy environment that fosters growth and does not disadvantage Canada relative to other jurisdictions. A resolution of the Gulf crisis—returning Saudi, Iraqi, and potentially Iranian heavy sour supply to the market—would loosen the premium that currently benefits Canadian barrels in Asia. Venezuelan production, if rehabilitated under a U.S. policy shift, would compete more directly with Canadian heavy than U.S. shale.22

  • On gas, substitution is a constraint that does not apply to oil. Asian buyers can switch from LNG to coal, nuclear, or renewables. LNG Canada’s competitive position in Asia depends on carbon policy coherence, shipping costs relative to Qatari and Australian exporters, and whether Canadian gas can price below coal.

  • The Pathways Alliance—Canada’s five largest oilsands producers—has committed $16.5 billion for carbon capture and sequestration through 2030. The tension between energy security and climate policy has led to policy volatility on emission management, which compounds the technical and financial challenges associated with CCS projects.

The Path Forward

  • Optionality benefits both countries. The strategic logic for oil and gas runs in opposite directions, and both countries’ energy policy could reflect that asymmetry. For Canadian oil, diversification into Asia is the value-maximizing move: every additional barrel shipped via TMX to Asian buyers narrows the WCS-WTI discount and increases netbacks for Canadian producers. Pushing more heavy oil into the continental U.S. market has the opposite effect. For natural gas, the calculus is reversed: AI-driven electricity demand has elevated Henry Hub pricing, making the U.S. a premium gas market. LNG Canada’s Pacific route remains strategically important for Canada’s long-run diversification. The U.S., likewise, could continue to seek optionality for its refineries, securing Canadian supply while finding new import sources.

  • A formal Energy Security Partnership. One with harmonized pipeline permitting and regulatory timelines, joint strategic reserve coordination, bilateral CCS and methane abatement collaboration, and a common framework for infrastructure investment that treats Canadian production as implicit U.S. supply security without requiring government capital from either side. This could be expanded to include the G7 and NATO allies.

  • Oil is a market that works. The continental oil and gas system—hundreds of pipelines, integrated refining, established commercial flows—functions efficiently when policy does not distort it. Tariffs on Canadian energy raise prices for U.S. consumers, widen the WCS discount, and reduce producer revenue without repatriating any production. The U.S. refining system—particularly the heavy conversion capacity—was built for Canadian oil. Disrupting that relationship would require billions in retooling at U.S. refineries or sourcing heavier barrels from less stable suppliers.

  • Gas is complementary, not competing. Henry Hub natural gas prices have spiked with AI-driven electricity consumption in the U.S., making gas sales to the U.S. market economically attractive for Canadian producers. The Montney gas basin and U.S. demand growth reinforce each other. Investment in Montney production infrastructure by U.S. and Canadian investors alike expands the continental gas supply that both countries need for power generation, industrial use, and LNG export.  

The Potential Outcome: A bilateral energy partnership could link Canada’s world-class oil and gas resources, pipeline infrastructure, and Pacific tidewater access with U.S. refining capacity, capital markets, and continental demand to deliver affordable, secure energy to consumers while expanding strategic optionality in global markets for both.

The Challenge: Heightened threat environment, fraying alliances

  • World military expenditure reached US$2.9 trillion in 2025—the ninth consecutive annual increase. The U.S., China and Russia accounted for roughly half of that—unchanged from 2000. However, the relative share changed dramatically: in 2000, Russia and China combined to spend a tenth of U.S. expenditure; today, they spend more than half that of the U.S.23

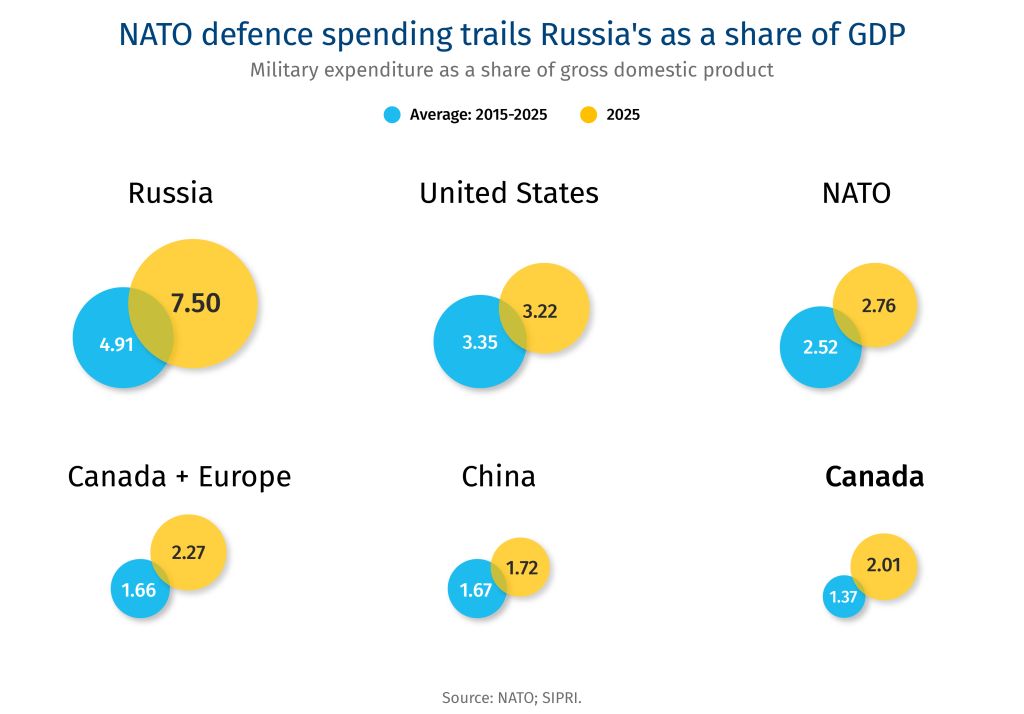
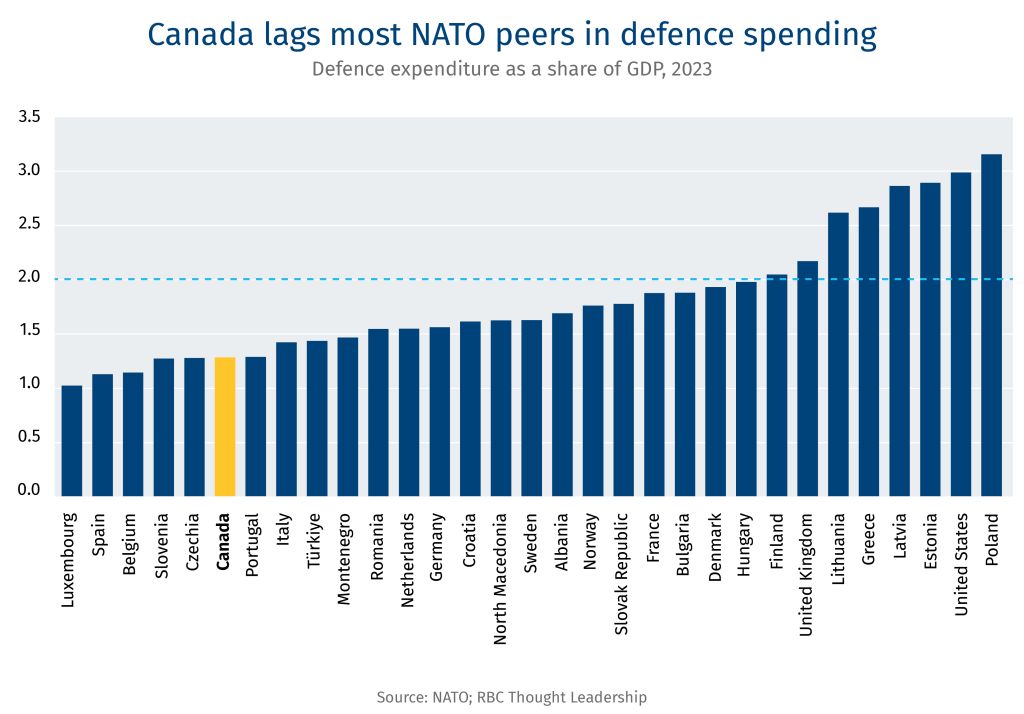
  • Russia’s invasion of Ukraine broke the security calculus for Europe. NATO responded with a historic commitment: at the 2025 Hague Summit, all 32 allies met the 2% GDP target for the first time since the 2014 Wales pledge. And NATO Allies agreed to a new benchmark of 5% of GDP by 2035.24

  • Russian and Chinese exercises and probes around the Arctic illustrate the rising threat level for North America.25 The Canada–U.S. defence partnership faces four frictions:

    • Defence Expenditure: Canada increased its military spending by nearly 70% from 2022 to 2025—hitting the 2% NATO target for the first time since the 1980s.26 Despite pledging to reach 5% of GDP by 2035, Canada has yet to produce a roadmap Washington finds convincing, prompting the U.S. to suspend the Permanent Joint Board on Defence.27

    • F-35 Procurement: Canada’s review of the program comes amid deepening trade tensions. The U.S. frames the delay not merely as a procurement decision but as a test of whether Canada intends to remain operationally relevant in an era of fifth-generation air and missile defence. The trade tensions also call into question whether Canada will continue to buy the most sophisticated U.S. hardware. 

    • The Golden Dome: Designed to provide continental defence, the Congressional Budget Office has pegged the cost at US$1.2 trillion over 20 years.28 Canada’s role remains undetermined.

      NATO defence spending trails Russia's as a share of GDP. Military expenditure as a share of gross domestic product.

Collective Strengths

  • In addition to unmatched platform scale, capital depth, and technological sophistication, the U.S. possesses a dynamic defence innovation economy, R&D density, and an advanced defence industrial base.

  • Canada brings world-class capabilities in domains critical to modern defence, including avionics, aircraft maintenance repair and overhaul, marine sensors, electronic warfare, UAV’s, and training and simulation—all of which are designated as priority sovereign capabilities in Ottawa’s Defence Industrial Strategy (DIS).29 In space, Canada has a six-decade legacy spanning Earth observation, satellite communications, and positioning-navigation-and-timing systems. Canada contributes heavily to the early-warning capabilities via the northern radar networks and operates a portion of the North Warning System (NWS), and maintains Forward Operating Locations in the Arctic.30 Nearly half of Canadian defence output is exported, with 70% to U.S. and Five Eyes partners, underscoring deep interconnection into global markets.31

The Obstacles

  • Over 90% of Canadian defence firms are SMEs. The absence of large defence primes depresses capital formation, posing challenges to the ambition to scale up Canada’s industrial base. Canada’s venture capital pool—roughly $12 billion—is less than 5% of the U.S. equivalent. Collateral assets in defence (specialized facilities, restricted IP) are often illiquid, with persistent mismatch between up-front investment requirements and revenue timing.32

  • Protectionist procurement policies: Both Canada and the U.S. are pushing to buy domestically, increasing trade frictions. For Canada, directing contracts to domestic firms where industrial capacity does not yet exist at scale could increase costs and extend timelines. Outside of space, ocean, and some aircraft, the target of 70% Canadian content in defence acquisitions by 2035 (up from ~40% today) requires building industrial infrastructure that cannot be created quickly.

  • Arctic sovereignty is another tension. Russia and China pose threats to the Arctic, and despite American pressure to invest in Arctic defence, the region remains exposed (current investments in Arctic defence notwithstanding).

  • The U.S.’s defence industrial base is production-constrained, not merely capital-constrained. The conflict in Ukraine and Iran have exposed munitions stockpile gaps while ‘Buy American’ provisions and export controls have restricted supply chain integration with allies.33

The Path Forward

  • Develop distinct but interoperable industrial bases. Canada has set itself on a clear, distinct path to diversify its defence industry from the U.S. and develop its own sovereign manufacturing capacity. This will create divergent capabilities and more Canadian autonomy. However, it will be important for key capabilities, particularly those important to joint commands, to maintain technological and operational interoperability for the long-term functioning of North America’s defence framework.

  • Deepen in areas of mutual operational necessity. NORAD modernization is foundational. Canada’s ~$40 billion, 20-year investment—over-the-horizon radar (including the $6.5 billion Arctic system being co-developed with Australia), space-based surveillance, command and control, and northern infrastructure—signals deep commitment to the partnership. Canada could negotiate its participation in a future Golden Dome: Canadian sensors, Arctic radar infrastructure, and airspace access are genuine contributions that warrant cost-sharing terms, Canadian IP rights over jointly developed systems, and a defined Canadian role in intercept decision-making.34

  • Explore cooperation on space and drone technology. Recent conflicts demonstrate that uncrewed systems are redefining warfare. At the same time, space is a strategic domain that’s increasingly contested. Ukraine has become the “Silicon Valley” of defence innovation and recent NATO exercises have shown the effectiveness of these capabilities against outdated militaries. This phase of rearmament will not take the same form as previous ones. Canada must update its military equipment and infrastructure writ large, and the U.S. is facing depleted stockpiles and asymmetric threats. Therefore, both must re-prioritize what defence technology they need to develop and procure, creating opportunities for collaboration to avoid duplication in areas of shared security interests.

  • Deepen partnership on critical minerals. Canada’s geology, if twinned with refining capacity, could hedge reliance on adversarial powers. Formalizing supply agreements for NATO’s defence-critical minerals—with off-take arrangements, price stabilization mechanisms, and Rules of Origin eligibility that treat Canadian-refined inputs as U.S. domestic supply—would strengthen both countries’ industrial resilience.

  • Diversify on platforms and partnerships. Canada’s $530 million European Space Agency investment, its participation in the European Union’s SAFE initiative, and its emerging bilateral arrangement with Australia reflects Ottawa’s efforts to diversify its defence industrial base. European partners will expect access to Canadian procurement as the price of access to European markets.

The Potential Outcome: The Canada–U.S. defence relationship has historically rested on an implicit bargain: Canada provides geographic depth, on the ground, under the ocean, on the ocean, in the air and in space; the U.S. provides an umbrella of security and protection, reinforced by unmatched platform scale, capital depth, technological sophistication, and R&D expenditure. Ensuring that bargain holds requires Canada to close the gap between financial commitment and operational credibility—delivering on NORAD modernization, resolving the F-35 decision , and building a genuinely capable domestic industrial base. For the U.S., a more reliable long-term partner will be secured by respecting Canadian sovereignty.

Acknowledgments

The authors would like to thank the external experts consulted for this report, some of whom are listed below.

Peter Dawe, BDC

Steve Carlisle, General Motors (Retired)

Robert Johnston, University of Calgary

Frank McKenna, TD Securities and former Canadian Ambassador to the United States

Michael Robinet, S&P Global Mobility

[1] Brennan, J. 2026. Steering Through Uncertainty: Four Future Paths for Canada’s Auto Industry. Toronto: RBC Thought Leadership.
[2] Brennan (2026), Steering Through Uncertainty.

[3] Canada exports ~US$11 billion in aluminum to the U.S., with more than one-third demanded by the transportation sector. At tariff rate at 50%, the impact on auto assembly alone could exceed $1 billion. When auto parts are layered in, the tariff cost moves higher. For economic analysis of tariffed Canadian aluminium, see Aluminum Association. 2025. Powering Up American Aluminum: A Roadmap for Next Generation Supply Chain Resilience. Arlington, VA: The Aluminum Association; Business Data Lab. 2025. How to Undermine U.S. Manufacturing: Debunking Aluminum Tariff Myths. Ottawa: Business Data Lab.; and Livingston, Brian. 2025. Canada’s Aluminum Production and US Tariffs. Intelligence Memos. Toronto: C.D. Howe Institute. September 2.

[4] Brennan (2006). Steering Through Uncertainty.

[5] Markman, J. 2026. ‘How Legacy Automakers Torched $53 Billion on EVs They’ll Never Sell’, Forbes, February 9.
[6] Robinet, M. 2026. New Automotive Geo-economics. S&P Global Mobility. Presented at PMA, May 2026.
[7] See Helper, S. and T. Tucker. 2026. ‘Challenges and Opportunities for the North American Auto Industry in the 2026 USMCA Renegotiation’, March 4. Washington: Brookings Institution; U.S. International Trade Commission. 2025. USMCA Automotive Rules of Origin: Economic Impact and Operation, 2025 Report. Publication no. 5642. Washington: USITC.
[8] IEA. 2025. Global Critical Minerals Outlook. Paris: International Energy Agency.

[9] Baskaran includes this claim in her testimony to the House Natural Resources Subcommittee—a claim we have not been able to independently verify. See: Baskaran, G. 2026. ‘Unleashing America’s Mineral Potential: The Critical Minerals Commodity Supply Chain’, Testimony before the House of Natural Resources Subcommittee on Oversight and Investigations. Washington: Centre for Strategic & International Studies.   

[10] Natural Resources Canada. 2025. Canada-U.S. Minerals Data Dashboard.

[11] Baskaran, G. 2025. ‘Canadian Tariffs Will Undermine U.S. Minerals Security’, Center for Strategic & International Studies, January 29.

[12] Merwat, S. 2026. Mine & Refine: Bridging Canada’s Critical Minerals Capital Gap. Toronto: RBC Thought Leadership.

[13] Merwat, S. 2025. The New Great Game: How the face for critical minerals is shaping tech supremacy. Toronto: RBC Thought Leadership.

[14] See Baskaran (2026).

[15] See Baskaran (2026) for a suite of policy recommendations which integrate extraction, processing, refining, and manufacturing with demand anchors.

[16] Merwat, S. 2026. Critical Minerals Processing: The West’s refining challenge and the technologies closing the gap. Toronto: RBC Thought Leadership.

[17] Canada Energy Regulator. 2025. Market Snapshot: Overview of 2024 Canada-US Energy Trade. Available online at: https://www.cer-rec.gc.ca/en/data-analysis/energy-markets/market-snapshots/2025/market-snapshot-overview-of-2024-canada-us-energy-trade.html

[18] Part of the differential reflects quality and transportation cost, but another part is derived from insufficient export diversification. See Alberta Energy Regulator. 2025. Alberta Energy Outlook ST98. Calgary: Government of Alberta.

[19] Energy Information Administration. 2026. Annual Energy Outlook. Washington: U.S. Department of Energy.

[20] Merwat, S. 2026. Six charts that analyze Canadian-U.S. oil ties amid new geopolitical developments in oil markets. Toronto: RBC Thought Leadership.

[21] Johnston, R. 2026. ‘Asia’s Oil Demand Outlook and Geopolitics’, Presented to PwC Canada/School of Public Policy Asia Oil Outlook, May 7.

[22] See the Oil Sands Alliance’s explainer on the Pathways Project: https://oilsandsalliance.ca/pathways-project/.

[23] Author’s calculations based on data from SIPRI Military Expenditures Database (constant 2024 $USD). 

[24] NATO. 2025. Defence Expenditures and NATO’s 5% Commitment. Brussels: North Atlantic Treaty Organization. Available at: https://www.nato.int/en/what-we-do/introduction-to-nato/defence-expenditures-and-natos-5-commitment.

[25] Bingen, K.A. 2026. ‘Orbits of Influence: Emerging Threats to U.S. Space Security and Foreign Policy Implications’. Statement before the House Foreign Affairs Subcommittee on Europe. Washington: Center for Strategic and International Studies, April 29.

[26] NATO data indicates that Canadian defence spending rose from US$26 billion in 2022 to US$44 billion in 2025—an increase of 69% (using current prices and exchange rates). SIRPI data indicates that Canada spent 2.06% of GDP on defence in 1987. 

[27] Some interpret the suspension of the PJBD as a response to Canada’s decision to review the F-35 program (and not as a response to Canada’s planned military expenditures, despite advertisements to the contrary).

[28] May 2026 report from the Congressional Budget Office: https://www.cbo.gov/system/files/2026-05/62379-golden-dome.pdf.

[29] Department of National Defence. 2026. Canada’s Defence Industrial Strategy: Security, Sovereignty and Prosperity. Ottawa: Government of Canada.

[30] See NORAD Backgrounder: https://www.canada.ca/en/department-national-defence/news/2022/06/north-american-aerospace-defense-command-norad.html

[31] See Canada’s (2026) Defence Industrial Strategy.

[32] Ashcroft, T. 2026. Frontline Investments: How to Advance Defence Finance in Canada. Toronto: RBC Thought Leadership.

[33] See reporting from the Associated Press, ‘US Will Need Years to Replenish Stockpiles of Advanced Weapons Used in Iran War, New Analysis Finds’, May 27. Available online at: https://www.usnews.com/news/business/articles/2026-05-27/us-will-need-years-to-replenish-stockpiles-of-advanced-weapons-used-in-iran-war-new-analysis-finds

[34] Department of National Defence. 2025. Fact Sheet: Funding for Continental Defence and NORAD Modernization. Ottawa: Government of Canada. Available at: https://www.canada.ca/en/department-national-defence/services/operations/allies-partners/norad/facesheet-funding-norad-modernization.html.

American excellence in artificial intelligence has had an unintended side-effect: a hyper concentration in computing software and hardware. Three U.S. tech firms account for around 85% of Canada’s cloud infrastructure spending, while another three account for roughly 88% of enterprise foundation model usage. Meanwhile, NVIDIA makes up about 80-90% of the advanced AI chip market.

Canadian firms and governments do not play a meaningful role in the global AI supply chain. But there is both a commercial and national demand to exert more control over our digital infrastructure to ensure deep AI capability as a country. The issue of “sovereign AI” has emerged as a critical issue as the world is swept up by the new technology. At the same time, choosing to build sovereign infrastructure and sovereign AI systems, or creating sovereign requirements for existing cloud infrastructure could involve a cost premium and could reduce technological competitiveness. Canadian businesses pursuing sovereign AI initiatives should consider which workloads to keep on existing cloud infrastructure, and which may require new architecture.

Canada is not alone in its pursuit of sovereign AI. More than 70% of global executives, investors and government consider sovereign AI as an “existential concern” or strategic imperative” to their goals, according to McKinsey & Co., which projects global sovereign AI to become a US$600- billion market by 2030.

For several years, the Canadian government has pursued new legislation to strengthen privacy protections and modernize its digital regulation. At the same time, a more assertive posture from Washington heading into the forthcoming Canada-U.S.-Mexico Agreement (CUSMA) review has cast some of Canada’s digital regulatory efforts as potential trade irritants. The result is a live debate—on both sides of the border—over how Canadian businesses can continue to access the latest AI innovations while maintaining robust safeguards and protections.

Canadian firms have found themselves making infrastructure, data, and vendor decisions in an environment that has materially changed in the last 18 months. The AI stack—cloud, compute, foundation models, and the data those systems run on—has simultaneously become a top subject of trade negotiations, regulatory design, procurement strategy, and operational risk management. The choices being made now at the negotiating table and in Canadian boardrooms will set the conditions for the next decade of the digital economy.

For a start, the U.S. is now more aggressively pushing for its interests and tech sector dominance, with an immediate challenge being CUSMA’s digital trade chapter, with a July 1, 2026, being the milestone for the six-year joint review.

Unlike several other trade agreements, on data localization specifically, CUSMA goes further than comparable agreements: unlike the Comprehensive and Progressive Agreement for Trans-Pacific Partnership, its rule against requiring domestic computing facilities (Article 19.12) contains no “legitimate public policy objective” exception, narrowing the space Canada would otherwise have to mandate local data storage for public services or citizen data.

Four provisions matter most for AI and data sovereignty: 1) limits on less-favourable treatment of foreign digital products, 2) restrictions on blocking cross-border data flows for business conduct, 3) prohibitions on requiring domestic computing facilities as a condition of operating, and 4) limits on source-code disclosure requirements. There is still room to move, but in narrower channels: the federal government’s national security exception, the federal procurement exclusion, and prudential carve-outs in financial services to preserve system stability. The federal government is also working on over a dozen targeted exceptions for defence.

Through a series of executive orders and policy shifts, the U.S. has hardened its position on digital trade. Washington is increasingly treating digital and AI regulation, including rules adopted outside its borders, as a trade irritant and barrier to market access. In March 2026 the United States Trade Representative (USTR) named Canada’s sovereign computing initiative, digital rules, and proposed regulations as trade barriers in its National Trade Estimate report. U.S. Trade Representative Jamieson Greer has noted that all options are on the table regarding the future of CUSMA. A U.S. executive order in 2025 creating a federal AI Litigation Task Force, while a White House recommendation calling for a “minimally burdensome national standard,” point in the same direction: AI regulation is being framed as commercial friction. In a CUSMA submission, the American industry-led Computer & Communications Industry Association (CCIA) labelled Canada’s Online News Act and Online Streaming Act as discriminatory, suggesting major headwinds ahead for the Canadian government and businesses to protect their interests.

Ottawa moved on June 4, 2026, releasing AI for All, its national AI strategy, organized around trust, opportunity, and sovereignty. Two of its six pillars target exactly these dependencies—a “sovereign AI foundation” in compute, data, and talent, and scaling Canadian champions—under a “build-partner-buy” approach. The headline commitments are concrete: infrastructure “operated under Canadian control and Canadian law,” sovereign-compute partnerships of 850 megawatts by 2030 scaling toward 2.3 gigawatts, a public supercomputer by 2031, and $700 million in affordable compute for smaller firms. Depending on execution, this may help address some of the gaps.

For Canadian leaders, sovereignty in the AI era should not mean isolation. It means freedom from coercion: the ability to choose which AI models to use, whose hardware runs AI inference, which jurisdiction governs data, and which providers can be substituted under pressure. Notably, Canada’s domestic stack for infrastructure is developing faster than the prevailing narrative suggests, including Cohere’s CoreWeave build out, Bell AI Fabric, TELUS AI data centres, the ThinkOn– Hypertec–Aptum–eStruxture consortium, and a new Canadian supercomputer are all building domestic AI and data infrastructure. Furthermore, Canada has many successful, global enterprise technology companies across AI models, financial services, healthcare technology, knowledge management and data storage, and beyond.

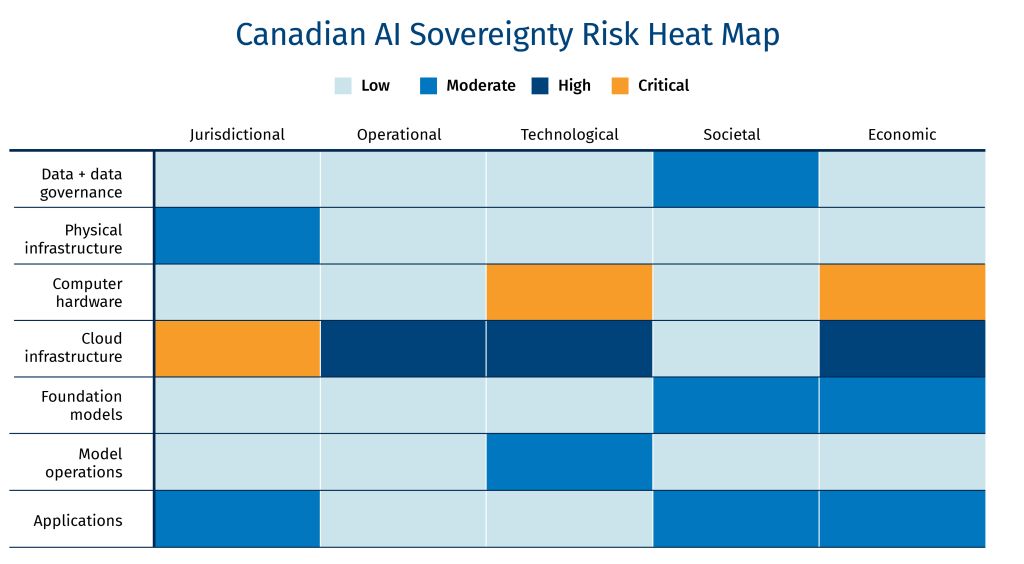
Canadian AI Sovereignty Risk Heat Map

In Sovereign by Design (Mullin & Khan, 2026) the above heat map rates “the severity of risk to Canadian AI sovereignty” at each layer/dimension, where sovereignty means freedom from coercion, and the ability to structure dependencies so they can’t be used as leverage. The four tiers map to how concentrated the dependency is and whether Canada has a viable substitute:

Reading the heat map. Each cell rates the severity of sovereignty risk where a layer of the AI stack (rows) meets a dimension of digital sovereignty (columns). Severity reflects the degree of foreign dependency, supplier concentration, and substitutability—and how much leverage a disruption would hand to an outside actor.

  • Low—Minimal exposure. Canada has domestic capacity, diversified supply, or ready substitutes; the dependency creates little room for foreign leverage.

  • Moderate—A real but manageable dependency. Concentration or foreign exposure exists, but allied alternatives, partial domestic capacity, or workarounds limit the leverage it confers.

  • High—A significant vulnerability. Heavy reliance on a small number of foreign providers or jurisdictions with few near-term substitutes; a disruption or coercive act would impose serious costs and be slow to route around.

  • Critical—A severe chokepoint in Canada’s supply chain. Dependence on a single (or a few) foreign-owned sources with few viable domestic or allied substitutes. Loss of access could halt or severely degrade AI capability and cascade through the stack.

Four questions sit on the table for any Canadian firm of meaningful scale considering measures to increase its AI sovereignty. The stakes vary by sector—financial services, healthcare, and defence and critical infrastructure face the sharpest versions—but the underlying architectural choices are increasingly shared.

  1. Plan for three regulatory scenarios, not one

    The CUSMA review could produce continuity on digital trade (status quo), modest tightening of restrictions, or material renegotiation on digital trade. Firms could build their AI and digital strategies with each of these futures in mind. Domestic regulatory uncertainty compounds the trade variable. Canada’s patchwork of AI and data laws could get clearer—or more tangled—as the federal government reforms the Privacy Act, PIPEDA, and other digital rules all likely at the same time. The Connected Care for Canadians Act (now Bill S-5, reintroduced in the Senate in February 2026) intersects health data interoperability with AI training in ways the legislation leaves largely undefined; and Bill C-8 is poised to extend supervisory expectations to telecommunications and adjacent critical infrastructure operators. The April 2026 Canadian Financial Sector Resiliency Group (CFRG) convening on Mythos signalled that frontier AI is now treated as a financial stability and cybersecurity concern, not simply a technology one. This is a shift that companies in energy, telecom, transportation, and water should expect on their desks next, likely ahead of a finalized supervisory framework for dealing with super powerful AI.

  2. Treat sovereign AI as an opportunity, not just compliance

    Canada’s strengths in energy, expanding data-centre capacity, and emerging AI champions could form the basis of a sovereign stack that did not exist a few years ago. Firms in adjacent sectors—such as legal, professional services, and insurance—that adopt sovereign infrastructure could build a stronger position for future Canadian regulatory shifts or trade developments. Whether that stack reaches commercial scale will depend on procurement decisions by large anchor buyers. With bank AI adoption rising from about 30% in 2019 to 50% in 2023, and projected to reach 70% by 2026, the choices the Big Six and other major financial firms in the near future could determine whether a Canadian sovereign cloud ecosystem becomes truly viable. Canada’s Defence Industrial Strategy and new NATO commitments also create a parallel growth path for dual-use firms serving Canadian, Five Eyes, and allied demand.

  3. Get the talent and IP question right

    Many technology-focused STEM graduates leave Canada, particularly top university software engineering graduates. But without people who have deep AI capability within government, Canadian companies and institutions will struggle to realize their potential. Beyond source code, the IP, model weights, fine-tuning datasets, and prompt instructions accumulated in production deployments are increasingly proprietary and valuable. Companies could also treat top AI graduates and people with significant AI skills even as strategic assets. The point lands hardest in healthcare, where procurement cycles for AI scribing, triage support, and administrative automation are top use cases.

  4. Act collectively

    No Canadian firm acting alone can move these questions. Industry associations—the Canadian Bankers Association, the Canadian Marketing Association, the Canadian Council of Innovators, and sector-specific bodies—are natural vehicles for some of the conversations now needed with government. The Business Council of Canada has made CUSMA review a central advocacy priority. Firms and industries that have not yet defined what they want from those conversations should do so now. 

Financial services, healthcare, and defence and critical infrastructure are the Canadian sectors that face the highest stakes in the convergence of AI and digital sovereignty. Executives in these sectors are likely considering some of the same architectural decisions in the coming years. What follows is a frame of some of the major policy and technology choices in front of them.

Canadian banks have moved past the question of whether to deploy AI at scale, with AI adoption moving from approximately 30% in 2019 to 50% in 2023, with 70% expected by the end of 2026, according to joint Office of the Superintendent of Financial Institutions (OSFI) and the Financial Consumer Agency of Canada (FCAC) data. In April 2026, the Canadian Financial Sector Resiliency Group (CFRG), a public-private partnership led by the Bank of Canada, convened on Mythos, signalling that frontier AI is now treated as a financial stability and cybersecurity concern, rather than simply a technology one The practical consequences are concrete. First, model risk management built for credit and market models is the floor for AI governance, not the ceiling. Second, risk frameworks need to consider the whole pathway for inference data (where and what data queries are being processed by AI models) not simply training. And third, AI-enabled cyber scenarios are among the top threats for financial stability at a systemic level.

What the Big Six and other major financial service firms procure in the next 24 months may determine whether the Canadian sovereign cloud ecosystem reaches meaningful commercial scale. Financial services are not only a subject for Canadian AI policy, but they are also among the largest forces shaping it.

The Pan-Canadian Health Data Strategy continues to advance through Health Canada and the Canadian Institute for Health Information, but the infrastructure for moving health data across provincial boundaries remains underdeveloped. Quebec constrains cross-border health data transfers as a matter of binding provincial law, while Alberta, Ontario and British Columbia have parallel systems that overlap unevenly. The Connected Care for Canadians Act (Bill S-5), advancing through Parliament in 2026, includes provisions on health data interoperability that intersect with AI training data in ways the legislation leaves largely undefined.

Canada has a patchwork of laws on AI and data, which could get clearer, or even more tangled as the federal government reforms the Privacy Act, PIPEDA, and other digital rules. Further, the current provincial patchwork of laws is unlikely to be resolved anytime soon. Meanwhile, procurement cycles for AI scribing, triage support, and administrative automation are already moving without clear sovereign requirements to procure against.

Healthcare leaders and hospital executives likely have options when it comes to digital sovereignty and protecting Canadians’ data—that might include federated learning, workload partitioning, deliberate data-flow design—but future leaders may want to invest in solutions that can ensure the data sovereignty of Canadians’ health data. Either choice is defensible. But it is crucial to determine the choices through governance and technology architecture decisions, rather than leaving them up to international vendors.

Canada’s Defence Industrial Strategy and new NATO commitments create growth opportunities for dual-use firms. Cloud infrastructure for defence presents three options: build within the U.S. ITAR compliance, build outside it for Canadian/allied demand, or build both. Canadian-classified data may require sovereign, separately operated infrastructure, while Five Eyes data likely needs more interoperable infrastructure. For critical infrastructure operators in energy, telecommunications, transportation, and water, the AI policy questions that financial services firms are working through are relevant. It will also be important to monitor the supervisory framework being considered in Bill C-8, an act respecting cyber security, amending the Telecommunications Act and making consequential amendments to other acts. The operators must decide whether to adopt AI risk management proactively or defer implementation until regulatory requirements are finalized.

The Canadian entities below are operating, contracted, or rapidly building, and are among the major domestic firms currently available for sovereign AI procurement and partnership. 

The Toronto-based company was founded in 2019. Cohere is the only Canadian-headquartered company building frontier-class language models with enterprise traction in regulated sectors, and recently reaching a combined ~US$20 billion valuation through its merger with Germany’s Aleph Alpha. A federal MoU recognizes Cohere as a strategically important Large Language Model (LLM) provider, with $240 million in committed federal funding, and it is the anchor tenant of a new Cambridge, Ontario, AI compute facility operated by U.S.-based CoreWeave under the Sovereign AI Compute Strategy. Cohere’s enterprise positioning includes sovereign deployment options for customer Virtual Private Clouds (VPC) and on-premises environments. The recent merger with Aleph Alpha extends reach into regulated European markets. The CoreWeave operating relationship has prompted reasonable questions in the ecosystem about how much Canadian ownership across the stack is required, achievable, or desirable; on balance, strengthening Cohere’s competitive position by available means likely improves Canada’s overall AI standing. RBC is a national partner and user of Cohere’s North platform.

Bell’s $2 billion+ investment in Canadian AI compute, announced in 2024 and expanded in 2025, is anchored by NVIDIA infrastructure. It’s positioned as Canadian-jurisdiction sovereign capacity for enterprise customers, with initial capacity targeted at federal, provincial, financial services, and health customers. The U.K., Germany, and France have adopted the telco-anchored sovereign cloud model, and Bell’s scale makes it the largest single domestically controlled compute investment outside the federal program.

Announced in 2024, the second major Canadian telco offering domestic AI infrastructure began operations in 2025, in Rimouski, Quebec. The facility targets customers that require Canadian-resident, Canadian-operated AI compute with carrier-grade reliability. Two telco-anchored options mean meaningful procurement competition for Canadian sovereign cloud.

It’s a coalition of mid-sized Canadian-owned data centre and cloud operators—ThinkOn, Hypertec, Aptum, eStruxture—offering sovereign cloud services for federal and regulated workloads. ThinkOn describes itself as the only Canadian-owned cloud service provider approved under the Shared Services Canada Framework Agreement for Secure Workloads at Protected B. The consortium could be an answer to the public-sector buyer’s problem of needing scale without single-vendor lock-in.

The three CIFAR-funded Pan-Canadian AI Strategy institutes—Vector (Toronto), Mila (Montreal), AMII (Edmonton)—generated much of the research base that produced Cohere, Element AI (now part of ServiceNow), and a deep bench of senior AI talent.

Other Canadian-owned providers, universities, and consortia currently operate at smaller scale, including in research compute and specialized regulated-sector hosting. Notably, Queens University and Simon Fraser University have signed a partnership on AI compute.

Download the Report

Linked sources are publicly available. Government documents, regulatory guidelines, and major reports cited in the brief are listed by topic. Disclaimer: not all sources may be precisely accurate nor are former legal opinions or forward guidance.

Trade and U.S. policy

AI sovereignty and Canadian capacity

Financial regulation and AI risk

Defence and dual use

Privacy, data governance, and provincial frameworks

  • Quebec Law 25 (Loi modernisant des dispositions législatives en matière de protection des renseignements personnels). Commission d’accès à l’information du Québec — cai.gouv.qc.ca.

  • PIPEDA Personal Information Protection and Electronic Documents Act. Office of the Privacy Commissioner of Canada

  • EU Adequacy Decision for Canada (2024 renewal) European Commission Justice and Consumers

Cyber threat and critical infrastructure

This report is part of RBC Thought Leadership’s Growth Project, our ongoing initiative to generate new ideas for the Canadian economy. Canada’s auto industry, which employs 125,000 people and accounts for 10% of Canadian exports, is central to the dynamism of the country’s wider advanced manufacturing sector and economic relations with the U.S. Over the past 10 months, to help chart a path forward for the industry at this critical moment, we spoke with automakers, parts suppliers and other industry experts to inform the research, which sets out four different futures for the industry.

  • Canada’s auto industry is at an inflection point within the North American industry. Washington’s focus on reviving domestic production threatens to rip up decades-old Montreal-to-Detroit supply chains. In our most pessimistic scenario, auto assembly plants in Canada could shutter by 2040.

  • Alternatively, Canada’s unit volume could grow to two million by 2040. Continued tariff-free access to the U.S. market could ramp up manufacturing in our most optimistic scenario.

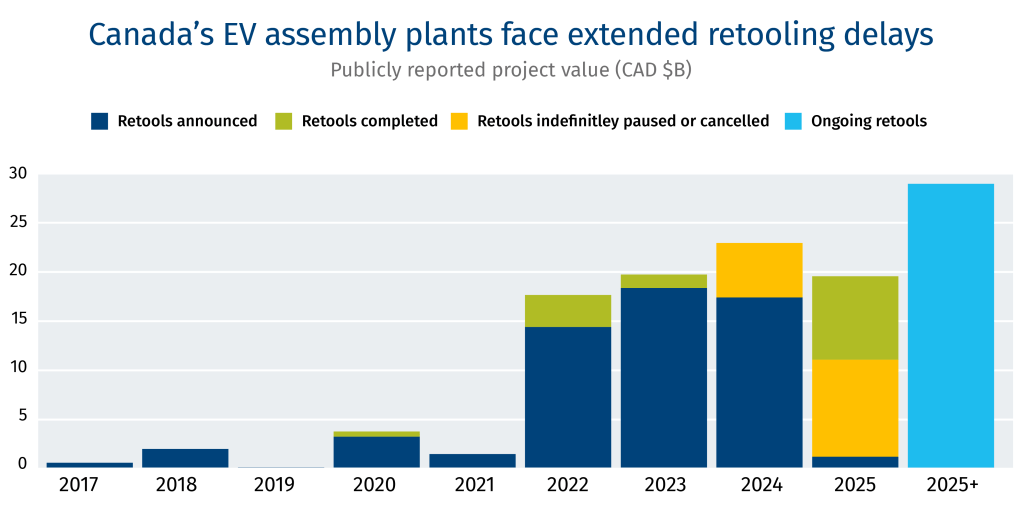
  • The industry is also grappling with two global transitions unfolding at different speeds. Electric vehicle adoption is proceeding more slowly than forecast, stranding billions in investments. Meanwhile, AI, autonomy, and software revolutions are accelerating faster than original equipment manufacturers (OEMs) can embed in assembly lines, creating a mismatch between capital commitments and market-ready technology.

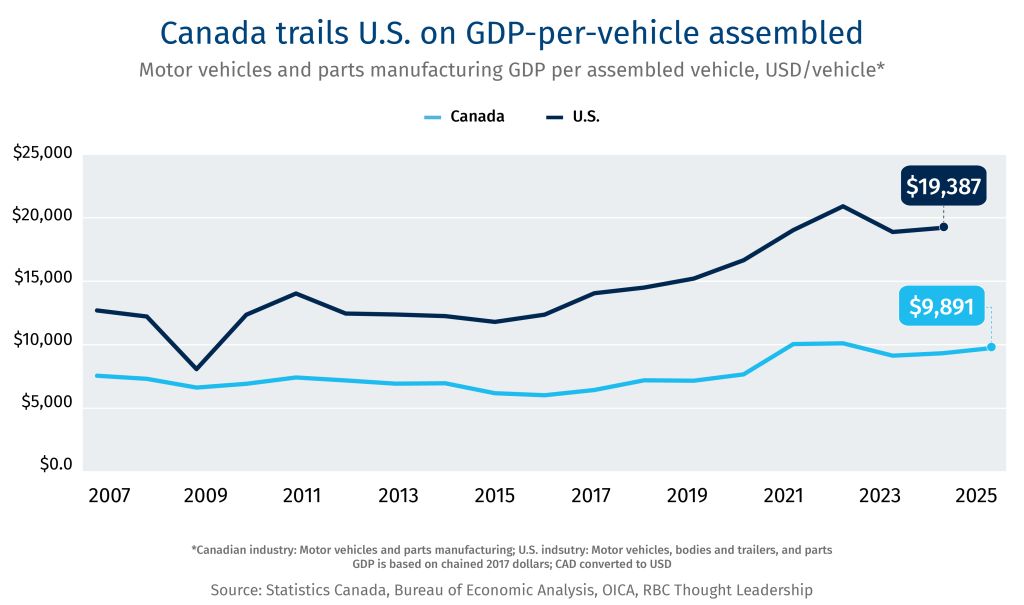
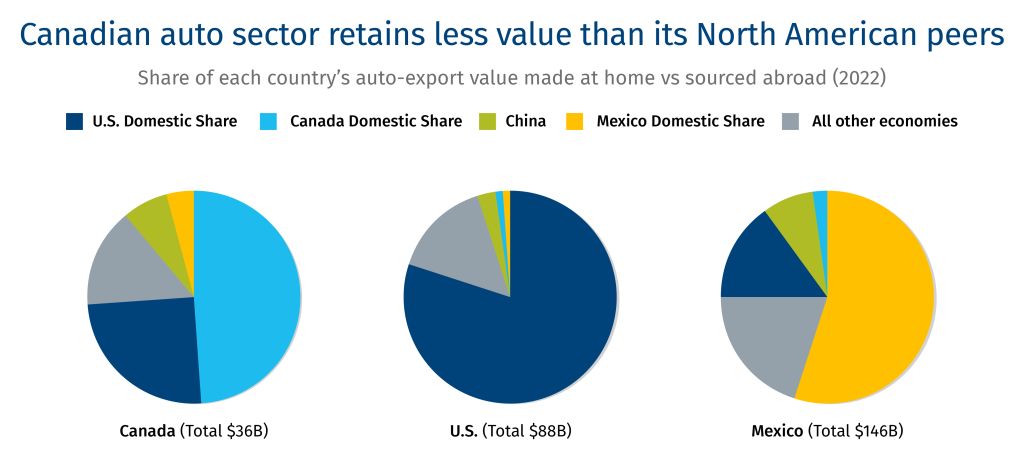
  • The auto industry’s future will be increasingly defined by the value generated per vehicle. The U.S. captures roughly twice the amount of GDP per assembled vehicle than Canada–and the gap is widening. Automation and robotics could lead to a world where fewer workers build more vehicles.

  • Market access is a powerful, underutilized asset. Only Americans buy more cars, per capita, than Canadians. With 90% of the Canadian market supplied by imports, Canada can link market access to investment commitments across manufacturing, R&D, software, testing, and certification.

Canada’s auto industry is at the centre of a storm. This isn’t the first time the industry has been threatened by precipitous conditions, but the present deluge poses a serious—perhaps existential—threat. The greatest source of upheaval comes in the form of President Donald Trump’s use of tariffs to repatriate manufacturing capacity to the American heartland. The year following Trump’s re-election was dotted with a painful series of product line cancellations, plant closures, and the most job losses in Canada’s auto industry since the Great Recession.

Adding to the tariff turmoil are four structural shifts in the industry: 

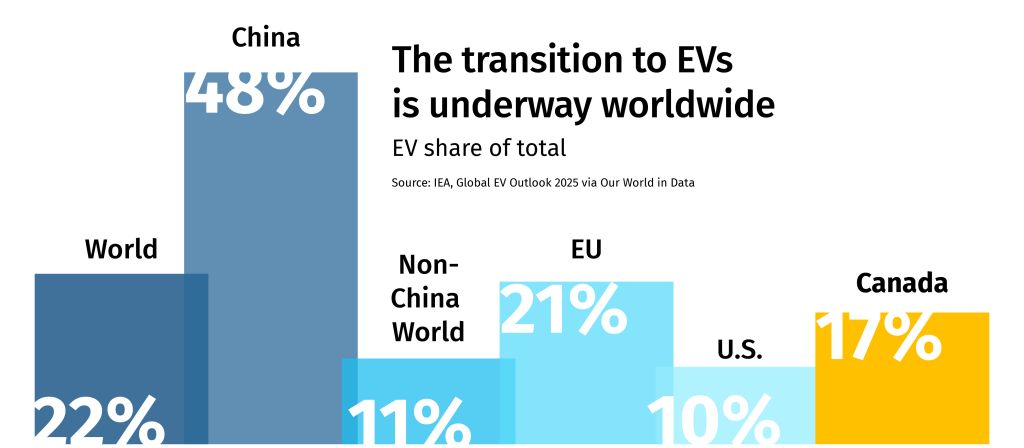
Electric vehicle adoption initially grew quickly thanks to consumer incentives, emissions rules, and industrial subsidies. But recent incentive rollbacks have made EVs less attractive for consumers, hurting sales, and prompting automakers to pause or cancel EV programs. In the short term, EV adoption may remain uneven due to affordability and charging infrastructure concerns. Long-term, frequent oil market shocks could accelerate adoption as domestically generated electricity leaves countries less exposed to geopolitical instability. 

As new models come loaded with connectivity, autonomy, AI, and electric propulsion, cars are increasingly becoming rolling technology platforms. More of a vehicle’s performance and value depends on batteries, chips, sensors, and software. As a result, the value pool expands beyond final assembly. That’s leading to a retooling of the industry as demand for new expertise and components disrupt the established skills and supply chains.

In 2025, some 92 million vehicles were sold globally, down from 95 million in 2017. Sales in the U.S. peaked in 2016, with Canada following a year later.1 The combination of an aging population and rapid urbanization is triggering structural shifts in global demand. That’s even before an impending autonomous vehicle revolution that could reimagine car ownership.

Chinese automakers surpassed their Japan rivals as the world’s largest car seller in 2025, having grown its market share from less than 1% to ~35% over the past 25 years. The country’s rising dominance in the global auto market, often with superior technology and lower prices, poses the most significant long-term threat to North America’s auto industry.  

Ultimately, Canada must decide how it positions itself in a transformed global auto system. With US$735 million in annual R&D spending, auto manufacturing is a high-tech, high value industry with substantial spillover benefits across sectors.2 Canada has several competitive advantages, too—skilled labour, clean and affordable power, and award-winning assembly facilities—that position it well to capture value across the supply chain. Success depends on maintaining the competitiveness of the ecosystem of suppliers, services, and technology providers.

With punitive Section 232 tariffs on steel, aluminum and copper still in force and the Canada-U.S.-Mexico (CUSMA) renegotiations imminent, Canadian policymakers and industry need to weigh the tradeoffs between competing strategic orientations. With that in mind, we look out to 2040 and explore four potential paths for Canada’s auto future.

China's rising dominance in the
global auto market poses the
most significant long-term threat
to North America’s auto industry.

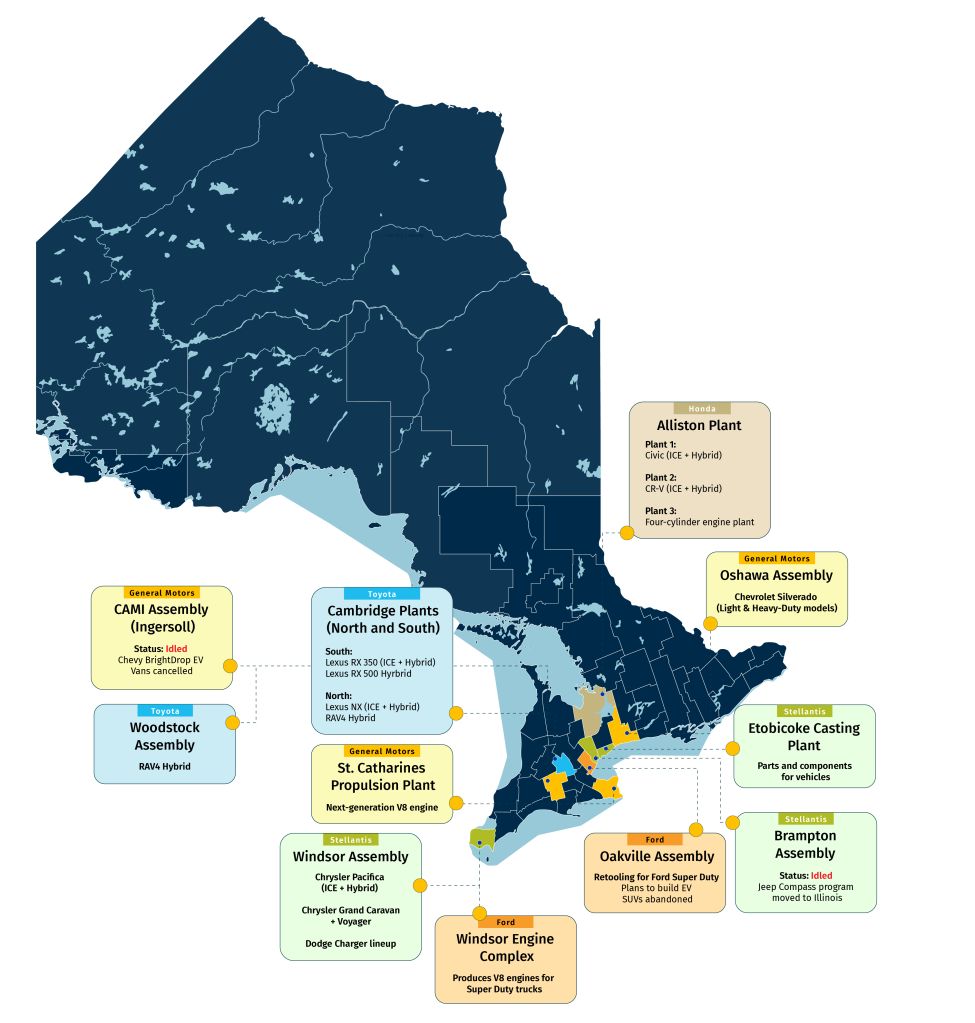
Toyota: Woodstock Assembly - RAV4 Hybrid

General Motors: CAMI Assembly
(Ingersoll) - Status: Idled Chevy BrightDrop EV Vans cancelled

Toyota: Cambridge Plants
(North and South); south - Lexus RX 350 (ICE + Hybrid)
Lexus RX 500 Hyrbrid; North - Lexus NX (ICE + Hybrid) RAV4 Hybrid

General Motors: St. Catharines
Propulsion Plant - Next-generation V8 engine

Stellantis: Windsor Assembly - Chrysler Pacifica (ICE + Hybrid), Chrysler Grand Caravan + Voyager,  Dodge Charger lineup

Honda: Alliston Plant
Plant 1: Civic (ICE + Hybrid); Plant 2:
CR-V (ICE + Hybrid); Plant 3: Four-cylinder engine plant

General Motors: Oshawa Assembly - Chevrolet Silverado - (Light & Heavy-Duty models 

Steelantis: Etobicoke Casting Plant - Parts and components
for vehicles

Ford: Oakville Assembly - Retooling for Ford Super Duty, Plans to build EV, SUVs abandoned

Stellantis: Brampton Assembly - Status: Idled; Jeep Compass program moved to Illinoi
MeasureEstimate Quantities
Employment125,000 workers: assembly (35,000), parts (71,000), body and trailer (18,000)
Units Produced1.3M (2024)
Value Added (GDP)$17B (2024)
Shipments$102B ($64B vehicles + $38B parts)
OEMsToyota, Honda, Stellantis, GM, Ford
# Parts Suppliers700
Gross Capital Stock$65B (replacement cost)
Robot Density1,475 robots /10,000 employees

1. Fast Lane—Higher volume, more value and closer integration

Key assumptions

  • Canada secures duty-free access to the U.S. market

  • Reforms are made to the rules of origin, domestic content requirements, and most favoured nation tariff rates

  • Tariffs limit Chinese access to the North American market

  • The total cost of EV ownership continues to decline

  • Pledged EV investments proceed on a longer timeline

  • Advancements in AI and autonomy boost value per vehicle

  • Canada expands its low-carbon grid and strengthens its critical minerals refining capabilities.

Life in the ‘Fast Lane’

This is a world where North American integration holds, electrification advances, and value deepens inside existing ecosystems. The five OEMs (General Motors, Ford, Stellantis NV, Honda and Toyota) in Canada maintain their manufacturing presence, but plants that were furloughed or operating at low utilization win new product mandates and increase assembly volumes. The Windsor-Montreal corridor combines assembly plants, Tier-1 suppliers, tooling firms, automation, AI and software firms, and in-market engineering talent that few jurisdictions can replicate. The 700-plus suppliers feature world-class Canadian companies, including Magna, Linamar, Multimatic, and Martinrea.

The Fast Lane is narrow but navigable. The foundation is restored duty-free trade with the U.S. Reforms to the rules of origin, domestic content requirements, and most-favoured-nation tariff rates further incentivize OEMs to allocate product to Canadian assembly plants.3 Simultaneously, a protective tariff wall rises around North America to keep Chinese EVs out—creating the competitive breathing room that North American OEMs need to invest with confidence.

Restored access, coupled with improvement in EV affordability unlocks tens of billions in pledged investment, most of which was deferred during the tariff war. Units assembled climb from 1.3 million in 2025 to 2 million by 2040—as many vehicles as Canadians purchase annually. Plus, Canada’s capabilities in light-weight materials, mobile communications, sensors and controls, software, data analytics, AI, cyber security and battery research are leveraged to win new mandates higher up the value chain.4

The Windsor-Montreal corridor functions as a Silicon Valley of the North—with deep engineering talent in autonomy, AI, lightweight materials and embedded systems. This is important since, as McKinsey projects, the software, sensors, control units, and electronics segment of the global industry will grow from US$335 billion to US$520 billion between 2025 and 2035.

The electrification path is longer than originally forecast, but it arrives. After $70 billion in EV write-downs in 2026, battery costs continue to fall while range and charging infrastructure improve. By 2030, market-driven consumer adoption begins. PHEV and BEV penetration rises from 10% in 2025 to 25% by 2030 and more than 60% by 2040. British Columbia and Quebec lead adoption—EV registrations hold around 20% in hydro-powered provinces even after federal rebates expire—before expanding into other markets as economics improve.

Canada trails U.S. on GDP-per-vehicle assembled
Motor vehicles and parts manufacturing GDP per assembled vehicle, USD/vehicle*

*Canadian industry: Motor vehicles and parts manufacturing; U.S. indsutry: Motor vehicles, bodies and trailers, and parts
GDP is based on chained 2017 dollars; CAD converted to USD

--Insights from RBC thought leadership

Canada’s critical minerals strategy bolsters Canada’s case. The mining, processing, and secondary manufacture of copper, cobalt, lithium, and magnesium—increasingly concentrated along a Northern Ontario-Quebec supply chain—strengthens battery integrity and reduces OEM exposure to Chinese inputs. Clean, affordable power bolsters the investment case. Ontario and Quebec’s low-emissions grids—Quebec’s electricity prices already sit below auto hubs like Michigan and Ohio—matter more in the smart-car era because electrification raises the power load. Computing, testing, and validation add to that demand. A cleaner, cheaper grid widens the margin and reduces carbon exposure on vehicle exports to increasingly emissions-conscious markets.

The Waterloo-Ottawa-Montreal corridor functions as a Silicon Valley of the North—with deep engineering talent in autonomy, AI, lightweight materials and embedded systems. This is important since, as McKinsey projects, the software, sensors, control units, and electronics segment of the global industry will grow from US$335 billion to US$520 billion between 2025 and 2035.

By 2040, Canada has an ecosystem where value is created across the stack—from the mine to the battery cell to the software-defined vehicle—anchored by assembly.

In this world, it’s clear the auto industry has become a technology platform, not just a manufacturing industry. The winning auto jurisdictions are not only judged on the number of units they assemble, but by the amount of value captured within each vehicle. Industrial ecosystems, not individual firms, bestow sustained competitive advantage.

Strategic tensions

  • Canada strengthens its position inside the North America auto system but becomes more dependent (and more exposed) to U.S. policy volatility.

  • If OEMs vertically integrate, pulling more EV content, software, and system integration in-house, Canada’s move into EVs and smart cars could be threatened.

  • Restricting Chinese imports and foreign competition raises domestic vehicle prices and delays EV adoption, with implications for transportation emissions.

Canada’s EV assembly plants face extended retooling delays

Publicly reported project value (CAD $B)

What needs to happen

  • In exchange for duty-free access, Ottawa and the provinces could enter a critical minerals auto pact with the U.S., co-creating incentives (e.g., off-take agreements, stockpiling, price floors) that commercially de-risk private investment flows into the mining and processing of nickel, copper, lithium, graphite, aluminum and REE’s, bolstering North America’s strategic industrial supply chain.    

  • Canada, the U.S. and Mexico could take a coordinated approach to tariffing EVs, steel, aluminum, and auto parts outside the bloc to hedge against Chinese dumping. All three jurisdictions could align policy on the rules of origin and Most Favoured Nation tariffs to incentivize investment within the bloc.

  • To ensure an abundance of competitively priced, non-emitting power, Ontario could embark on an aggressive expansion of hydro, nuclear, and wind power, expanding and modernizing the grid. Federal and provincial governments could massively expand charging infrastructure to bolster EV adoption. 

  • To win new mandates in R&D and software, Ontario and Quebec could consider co-investing with assemblers and parts manufacturers in shared research, testing and validation facilities. Eligibility thresholds for the Scientific Research and Experimental Development (SR&ED) program could be lowered to attract investment mandates in electronics, connectivity, autonomy, cyber security, and lightweight materials.

  • Ottawa could consider reforming its immigration strategy to attract and retain professors and graduate students in computer and materials science, mechanical and chemical engineering, and AI and machine learning, deepening the ecosystem of competitively priced tech talent.


The transition to EVs is underway worldwide

2. Slow Lane—Assembly survives, EV adoption slows,value grows elsewhere

Key assumptions

  • CUSMA survives but is diluted

  • EV adoption continues but is slower than expected

  • Chinese OEMs expand their presence in Canada’s consumer market

  • The U.S. continues to exclude Chinese vehicles 

  • Critical minerals and clean power lead to select mandate renewals

  • Canada retains strategic value as a site for spillover capacity and assembly diversification

Drifting into the ‘Slow Lane’

Canada maintains its presence within the North American system, but its position and strategic relevance diminish. The trigger for the Slow Lane scenario is a sub-optimal outcome in trade talks. CUSMA survives the 2026 renegotiation but emerges narrower and less predictable. Canada secures a 10% headline tariff—a 5% effective rate on assembled vehicles—which compresses assembly margins close to zero. It’s not fatal to plant economics, but it changes the calculus for OEM investment allocation committees sitting in Detroit, Tokyo, and Stuttgart. And with the perennial threat of higher tariffs lurking in the background, investing in Canadian operations becomes prohibitively risky.

The Slow Lane is not a crisis—it sees Canada retain current production—but the higher value layers of the auto ecosystem grow elsewhere. Plants continue to run, retooling investments occur periodically, and assembly employment is largely maintained. Canada steadily cedes the investments, mandates, and capabilities that determine long-term industrial relevance, however. By 2040, Canada assembles 1.2 million vehicles, but Canada captures a smaller share of the value per vehicle over time.

Ironically, Canada’s auto industry was birthed behind protective tariffs on American-made vehicles.5 In the early twentieth century, a 35% National Policy tariff on imported cars was implemented to protect Canadian production from American competition.6 Rather than sustain Canadian automakers, the tariffs prompted American giants like Ford and GM to hop over the tariff wall and establish branch plants in Canada.7 This result: Canada became the world’s second-largest vehicle producer by 1930. By the turn of the century, Canada was assembling three million vehicles a year and ranked first when benchmarked against population. But the country lost that edge, assembling just 1.3 million vehicles by 2024.

The EV transition compounds the problem. Consumer adoption further slows after federal rebates expire—EV registrations fall below 10% nationally in 2025 and do not recover without sustained policy support. ICE and hybrid platforms extend their commercial life, which sounds like a reprieve for assembly but is a strategic trap: the investments Canada made in EV battery supply chains generate returns below their business case assumptions. EV supply remains stranded behind anemic consumer adoption, hindering Canada’s investability.

Meanwhile, the fast-growing layers of the industry migrate elsewhere. R&D mandates shrink as engineering and software functions consolidate around U.S. and Japanese assembly hubs. Contract revenues from OEM R&D programs thin out for the Windsor-Montreal corridor. STEM graduates take their skills to better-paying markets. Some of Canada’s homegrown giants remain globally competitive—but their growth happens in the U.S. Sun Belt, Mexico, and Germany, not in Ontario.

RankCountryUnits Assembled
(Million)
Share of
Global Total
Units Assembled
per 1,000 Residents
Per Capita
Rank
1China31.334%229
2U.S.10.611%318
3Japan8.29%663
4India6.07%415
5Mexico4.25%327
13Canada1.31.5%336
RankCountryUnits Assembled
(Million)
Share of
Global Total
Units Assembled
per 1,000 Residents
Per Capita
Rank
1U.S.1323%477
2Japan9.918%782
3Germany5.710%694
4France3.26%526
5Canada3.15.4%1011

Sources: OICA; UN World Development Indicators

Canada’s aging consumer market reinforces the trajectory. Vehicle sales peaked in 2018 and have not scaled to those heights even as the population had risen by four million by 2025. The slowdown signals structural shifts in ownership patterns among largely urban, younger cohorts who increasingly rely on transit, ride-hailing, and car-sharing. A market that fails to grow in volume gives OEMs less reason to invest in Canadian production capacity.

Governments respond by competing for individual mandates—matching U.S. incentives on a project-by-project basis. The approach is costly and reactive. Each subsidy dollar spent defending existing assembly is a dollar not spent building capabilities—testing infrastructure, advanced manufacturing clusters, engineering talent pipelines—that would make Canada competitive for higher-value mandates. The Parliamentary Budget Office documented that public support for the auto sector between 2020 and 2024 exceeded private capital committed.8 In the Slow Lane, that ratio worsens.

Canadian auto sector retains less value than its North American peers

By 2040, Canada still ships vehicles, but a growing share of the value inside those vehicles—the software stack, the battery chemistry, the electronic control systems—originates outside Canada’s borders. The ecosystem gradually thins out with each lost investment mandate.

It becomes clear that industrial erosion can occur gradually—not through collapse in unit production, but through declining value per vehicle. Value can migrate outside Canada’s borders while assembly remains within it. Industrial decline does not require plant closure; it occurs through missed investment cycles and diminished mandates.

Strategic tensions

  • Canada preserves employment and assembly operations but fails to capture the high-growth, high-value segments of the industry.

  • Governments increase subsidies to retain lower-value layers of the industry, raising fiscal costs without improving ecosystem competitiveness.

What needs to happen

  • Canada’s current industrial policy is optimized for this scenario. Investment incentives are concentrated in construction investment, not operational subsidy, and the SR&ED program excludes activities that would have qualified otherwise.

  • Public policy measures that lower power costs, improve tax competitiveness, reduce regulatory friction, or strengthen critical minerals supply chains are made sparingly, owing to fiscal constraints and industrial uncertainty.

3. On-Ramp—Canada turns to Eurasia for investment

Key assumptions

  • Canadian exports to the U.S. are tariffed at 15%—7.5% effective  

  • Canada dangles market access as a carrot to attract foreign investment

  • Modest tariffs are maintained on Chinese imports

  • The EV transition proceeds. By 2040, most vehicles sold in Canada are BEVs 

  • Canadian auto policy pivots to attract non-U.S. investment

Taking the ‘On-Ramp’

As North American integration slowly fragments under persistent tariffs—Canadian exports to the U.S. face an effective 7.5% rate—Ottawa recasts trade and industrial policy around a strategic remissions framework. OEMs that invest in Canadian manufacturing, R&D, engineering, or certification receive preferential market access. OEMs that do not are tariffed or exit. The definition of ‘investment’ is deliberately widened, encompassing not just assembly and parts but software development, testing facilities, systems integration hubs, and regulatory certification capacity.

This attracts a different mix of firms than the traditional North American model. Asian and European OEMs—Hyundai, BMW, BYD, and a cohort of emerging EV and software-defined vehicle producers—view Canada as a gateway market and a hedge against concentration risk in China and the U.S. Some build or expand assembly operations in partnership or independently; others focus on engineering, testing, and specialized production tied to global supply chains. The Windsor-Montreal tech corridor becomes a hub for compliance infrastructure and software validation, positioning Canada as a trusted jurisdiction capable of certifying vehicles for multiple regulatory markets simultaneously.

Only Americans buy more than Canadians, per capita

The purchasing power of the Canadian consumer also comes into play. Only Americans buy more cars than Canadians, per capita. Canadians spend nearly $110 billion annually on cars. And 90% of those vehicles are built abroad. That gives Canada the ability to leverage market access to secure investments. Canadian consumer preferences shape which OEMs make the investment. The Ford F-Series has been Canada’s best-selling vehicle for 15 consecutive years; the Toyota RAV4 and Honda CR-V dominate the SUV market. This truck-and-SUV profile aligns Canada’s consumer market with higher-margin, higher-content vehicles—the segment where EV and software integration creates the most value. An OEM that wins the Canadian consumer for its next-generation PHEV pickup or smart crossover earns returns that justify the cost of establishing a Canadian R&D or certification presence.

Canada is a prized market for global carmakers

The EV transition proceeds in parallel. By 2040, BEVs represent the majority of vehicles sold in Canada, with PHEVs serving as the bridge for the truck and SUV segments where range anxiety remains most acute. OEMs without an assembly footprint in Canada pivot toward R&D investment, software integration, and certification—embedding themselves in Canadian value chains without owning a stamping press. Employment concentrates in high-skill STEM occupations: systems engineers, software architects, regulatory specialists, and battery chemists working along the Windsor-Montreal corridor.

Canada’s critical minerals endowment and clean power grid serve a dual function. They attract European or Asian OEMs seeking to diversify supply chains away from Chinese inputs, and they give Canada credibility as a partner in global battery supply chains. A vehicle manufacturer that sources lithium and copper through Canadian mining and processing operations builds a supply chain argument for regulators in Europe and the U.S.—and a reason to deepen its Canadian footprint.

Canadians have a penchant for heavier, higher value cars

By 2040, Canada assembles a million vehicles—the majority sold into its own market. Exports to the U.S. continue to decline, constrained by tariffs that impair competitiveness on lower-margin models. But the measure of Canada’s auto economy is not just units assembled. It is also the value embedded in modules, systems, and services that Canada increasingly exports: software stacks validated on testing tracks in Oshawa and demonstration facilities in Markham, battery modules assembled from Canadian minerals, and engineering services rendered for global vehicle programs. Canada is less central to North American production decisions and more embedded in global value chains—becoming a technology integrator. That’s a more defensible position than the branch-plant model it replaces.

Clean power offers Canadian auto sector a competitive advantage

Strategic tensions

  • Trade diversification reduces dependence on the U.S., but risks provoking retaliation or reduced cooperation with Canada’s largest economic and security partner.

  • Greater openness to Chinese OEMs raises national security, data governance, and supply chain integrity concerns.

What needs to happen

  • Canada’s remissions framework could trade market access for investment. OEMs with Canadian operations could import a certain quantity of vehicles duty-free if they maintain Canadian-based production and investment commitments.

  • To incentivize OEMs to re-tool their plants for high-mix, low-volume assembly, Ontario and Ottawa could co-create a capital cost offset fund (carefully designed and stringently monitored) and allow full immediate expensing of investments in automation, robotics, and digital manufacturing systems.

  • Ottawa could help boost demand for Canadian-made vehicles through public sector fleet procurement and restriction of EV incentives to vehicles made in Canada.

4. Off-Ramp-Assembly anchors leave, industrial policy becomes reactive

Key assumptions

  • The auto provisions of CUSMA are scrapped or severely weakened

  • Canada opens its market entirely to Chinese imports in exchange for enhanced market access for Canadian agri-food and energy exports to China

  • By 2040, most vehicles sold in Canada are BEVs

  • Canadian industrial policy is transformed from proactive to reactive

Taking the ‘Off-Ramp’

The Off-Ramp begins with a pattern that has governed Canada’s auto industry for the past quarter century: plants continue to operate, but with diminished mandates. In this case, the mandates expire, as investment decisions tilt toward jurisdictions with lower tariff exposure and stronger policy certainty.

Historically, Canada did not lose assembly capacity during the contraction phase of the cycle; it lost it during the recovery, when the production footprint failed to return, having initially migrated to right-to-work states like Alabama and Tennessee and eventually to Mexico, which grew from 1.9 million units assembled in 2000 to 4.2 million by 2025. The Off Ramp is that dynamic, accelerated and made permanent through the collapse of CUSMA’s auto provisions.

Canada faces an effective tariff of 12.5%, which makes export-oriented assembly economically unviable. Companies continue to assemble vehicles, losing money, but try to hold onto market share for the valuable out-of-warranty parts and servicing of vehicles.

Canada follows Australia in allowing its auto industry to exit.9 By 2040, all auto assembly plants in Canada have shuttered. Low-cost BEVs from Chinese players BYD, Geely, and Leapmotor—already competitive on price and increasingly competitive on quality—fill the demand gap left by departing North American OEMs. By 2040, most vehicles sold in Canada are Chinese-built BEVs. For the Canadian consumer, vehicle prices fall and emissions decline.

Canada's auto sector lost productive capacity during expansion phases

For the Canadian auto ecosystem, the consequences are structural and severe. Plants anchor a supplier network that generates more economic activity than the facilities themselves. Tier 1 suppliers maintain their global competitiveness and continue exporting to U.S. and international customers. But the loss of domestic assembly volume erodes the density that makes Canadian Tier 2 and Tier 3 suppliers viable. Tool-and-die shops—of which Canada has few global peers—lose their customer base. Specialized component manufacturers close or consolidate. Some follow production south; others simply shutter operations. The fastest-growing segments of the auto industry—software, batteries and electronic control systems—were never deeply rooted and fade away without assembly to anchor them. The corridor’s density advantage, built over a century of branch-plant production, dissipates within a decade of losing its anchor customers.

Auto sector job losses and wage stagnation persist in Canada

The knock-on effects run deep. Steel mills in Hamilton and Sault Ste. Marie that have long supplied automotive-grade sheet metal lose one of their primary customers, as do chemical and plastics producers in Sarnia. The advanced manufacturing ecosystem spanning auto, aerospace, and defence loses the cross-pollination of skills, tooling capability, and engineering talent that assembly concentration made possible. Windsor, Oshawa, and Ingersoll face sustained economic decline: unemployment spikes, real estate prices fall, and tax bases erode, generating long-term pressure on social programs and government transfers.

Canada’s industrial policy pivots from active support to triage. Two separate tracks are pursued:

  • Incentives to retool auto parts makers for defence manufacturing. Parts suppliers with the capital and capability to succeed in defence manufacturing are supported through retooling funds, accelerated depreciation, and public subsidy of workforce retraining.

  • Transition the remaining workforce. Fiscal supports for OEMs are repurposed to facilitate displaced workers through retirement bridging, retraining programs, relocation.

The Off Ramp makes clear what other scenarios obscure: auto manufacturing is not just an industry. It is an ecosystem anchored by assembly. Remove the anchor and lose the density required for industrial dynamism across advanced manufacturing.

Strategic tensions

  • The loss of auto ecosystem density accelerates broader industrial decline, weakening adjacent industries.

  • By ending production subsidies, Canada preserves fiscal resources in the short run but loses industrial capacity and capability in the long run. Ironically, this threatens long-term fiscal capacity.

  • The end of domestic auto assembly removes the rationale for protectionism. Canada opens its market entirely to Chinese EVs, which create more affordable options for consumers and reduces Canada’s transportation emissions.

  • Policy focuses on managing industrial transition, redeploying capital and labour toward adjacent sectors such as aerospace, robotics, defence, and advanced manufacturing, and preparing the workforce for a painful transition.

What needs to happen

  • Ottawa could co-create an industrial strategy with key provinces to support the transition of parts makers to defence equipment manufacturing, including financing supports, supply chain integration, workforce retraining, and re-tooling of facilities.

  • To support affected workers and communities, Ottawa could strengthen employment insurance (across eligibility, benefit level, and duration) and, with Ontario, co-fund a targeted program to support auto workforce retraining, retirement bridging, and relocation. 

  • In anticipation of Chinese entry into the Canadian market, Ottawa could enact a connected vehicle security and data governance framework that covers software, hardware, and data localization.

Canada’s auto sector of the future will most likely be some combination of what’s outlined above. What’s critical is that public policy remains flexible and adaptive to any possible future. Cutting across all the scenarios are five strategic considerations that Canada must confront:

  • Defend the North American manufacturing corridor. Canada’s industry was built on preferential access to the U.S. market. Roughly 90%-95% of auto exports flow south. This concentration creates both strength and vulnerability.

  • Compete for value inside the vehicle. Vehicles are becoming technology platforms, with a growing share of value embedded in software, electronics, batteries, and systems integration. Historically, Canadian policy focused only on assembly volumes and employment. This policy focus needs to expand as automation advances and more value migrates toward engineering, software, electronics, and digital services.

  • Use market access as leverage. By global standards, Canada’s domestic auto market is large and lucrative. Production capacity is presently geared towards export economics. Market access can function as a policy tool to secure investment commitments across a range of functions and assets, including manufacturing, R&D, testing, and regulatory certification.

  • Deploy public capital strategically. Governments in North America, Europe, and Asia have committed tens of billions to auto manufacturing, battery supply chains, and advanced automotive technologies. Canada faces a difficult balance. Large-scale subsidies can attract investment, but they also expose public finances to significant risk. The Parliamentary Budget Office estimates that between 2020 and 2024, the $46 billion in pledged investment across the EV supply chain was matched with nearly $53 billion in government support. Taxpayers need to see value for money.

  • Preserve the industrial ecosystem: Assembly plants anchor a network of suppliers, engineers, tool-and-die firms, logistics providers, and service businesses, but they also create demand for other heavy industries such as steel, aluminum, chemicals and plastics. If the assembly anchors weaken or close, the wider ecosystem that supports advanced manufacturing could lose the density required for dynamism and efficiency.

Download the Report


The author would like to thank the experts who were consulted on this report, some of whom are listed below.

Tim Hollander, Toyota Canada

Brian Kingston, Canadian Vehicle Manufacturers Association

Scott MacKenzie, Toyota Canada

David Paterson, Government of Ontario

Brendan Sweeney, Pacific Manufacturing Association of Canada

Don Walker (Retired), Magna

Advanced Manufacturing Council. 2024. 2024 Advanced Manufacturing Council: Final Report. Toronto: Government of Ontario.

Cain, T. 2026. ‘How many vehicles—and which—were made in Canada in 2025?’, Driving, March 5.

Car Guide. 2026. ‘The 10 Best Selling Vehicles in Canada in 2025’, January 17.

Dykes, J.G., D. Anastakis. 2021. ‘Automotive Industry’, Canadian Encyclopedia.

Giswold, Jill. 2024. Tallying Government Support for EV Investment in Canada. Ottawa: Office of the Parliamentary Budget Officer.

Helper, S. and T. Tucker. 2026. ‘Challenges and opportunities for North American auto industry in the 2026 USMCA renegotiation’, March 4. Washington: Brookings. 

International Energy Outlook. 2025. Global EV Outlook 2025: Expanding sales in diverse markets. Paris: IEA.

Statistics Canada. 2025a. ‘Number of Canadian commuters increases for fourth straight year in 2025’, The Daily, August 26.

McKinsey & Company. 2026. The automotive software and electronics market through 2035.

Statistics Canada. 2025b. ‘Vehicle registrations, 2024’, The Daily, October 17 26.

Statistics Canada. 2026. ‘New motor vehicle registrations, fourth quarter 2025’, The Daily, March 12.

Tanguary, Ray. 2018. Drive to Win: Automotive Advisor Report. Toronto: Government of Ontario.

Williams, G. 2026. Why are Chinese EV’s so Cheap?  New York: Rhodium Group.

  • Canada is back on the radar of global investors. Last year, foreign direct investment in Canada reached nearly $100 billion, the highest level since 2015.

  • Global capital flows are shifting significantly. Geopolitical disruptions, most recently the conflict in Iran, are leading major investors and companies to rebalance their portfolios.

  • A $1.8 trillion investment opportunity over the next 10 years could make Canada the G7’s growth leader. RBC Thought Leadership’s research and analysis indicates that there is an immense opportunity in six export-oriented, R&D-intensive, and strategically significant industries:

    • Oil and Gas: $705 billion. New oil pipelines and LNG terminals could elevate Canada to energy superpower status, diversifying trade, providing energy security to allies, and fostering carbon capture and sequestration technologies.

    • Electricity: $670 billion. A transformative expansion of power across nuclear, hydro, and renewables, coupled with grid modernization, would ensure a reliable, affordable, non-emitting system while strengthening Canada’s competitiveness in a power-hungry heavy industry.

    • Agriculture and Food Processing: $205 billion. Enhanced support for R&D could unleash a multi-decade, export-led growth cycle that strengthens domestic food sovereignty and enables food security to allied countries.

    • Metals and Minerals: $200 billion. With NATO partners eyeing alternatives to a China-dominant critical mineral supply chain, Canada could hedge this concentration risk, power the West’s energy transition, and strengthen defence and advanced manufacturing supply chains.

    • Defence: $19 billion. Canada plans to nearly triple defence spending to 5% of GDP by 2035, which could generate $100 billion for Canadian companies and transform Canada from a defence equipment importer into a contributor to allied military capabilities, particularly in emerging areas like Arctic surveillance and space-based defence systems.

    • Space: $12 billion. Canada’s economic ambitions should extend out of this world. Investments in the space industry would advance the country’s excellence in satellite communications, space robotics, earth observation, and aerospace engineering, creating new opportunities in defence, high-tech and advanced manufacturing.

  • Canada is emerging from an unprecedented capital recession. The renewed interest comes after a decade of weak business investment, stalling productivity, and stagnating living standards. Between 2015 and 2024, more than $1 trillion of investment exited Canada—the largest capital exodus in Canadian history. For every dollar of inward FDI, two dollars exited.

  • To unlock investment, Canada needs a new capital formation framework. The non-financial corporate sector is sitting on more than $1 trillion in cash on its balance sheet. Its deployment could crowd in additional pools of capital: institutional, risk, foreign, and state capital. Our proposed capital formation framework includes four pillars, each targeting an incremental layer in the capital stack:

    • A brownfield to greenfield asset recycling program

    • Scale-enabling procurement

    • Reforms to the corporate income tax and foreign investment regimes

    • Leveraging of state capital

  • Canada’s new playbook must include Indigenous economic partnership, which not only helps to secure project approvals, but can accelerate project timelines. Partnerships work best when they are embedded early and aligned with community needs.

Canada is back on the capital radar.

Following a decade defined by record levels of capital flight and weak business investment, Canada is increasingly catching the attention of global investors and companies looking to rebalance their portfolios amid global uncertainty. Last year, foreign direct investment in Canada hit nearly $100 billion, the highest it’s been since 2015 and the first time in a decade when inflow exceeded outflow.

The opportunity is immense. If Canada can capitalize on this moment, it could lead the G7 in economic growth and industrial dynamism. RBC Thought Leadership’s research and analysis indicate that Canada requires $1.8 trillion in investment over the coming decade to galvanize growth in six export-oriented, R&D-intensive and strategically significant industries:1 Oil and Gas, Metals and Minerals, Electricity, Agriculture and Food Processing, Defence, and Space.

For an economy worth $3 trillion annually—and given that we are focused on six industries that, collectively, represent less than 10% of GDP—the $1.8 trillion figure is substantial. However, it is attainable over the next decade, especially given the pools of capital to draw upon. Between pension funds and asset managers, Canada is sitting on nearly US$10 trillion in capital. And while estimates vary, the global capital pool sits somewhere between US$150 to US$200 trillion.2

Simply put: There is more than enough capital to power the country’s growth ambitions.

With that in mind, we imagine two future scenarios: Trend Growth and Step Change. The Trend Growth scenario paints a picture of Canada 10 years out if current policies and investment patterns remain unchanged. The Step Change conceives a decade of purposeful national strategy, federal-provincial coordination and targeted investment.3

The latter, which represents a 65% capital injection boost from the Trend Growth scenario, shapes a new and prosperous Canada. One that could include two new oil pipelines, increasing production capacity by a third; an expansion of power generation across all sources, including nuclear; $300 billion in defence spending that strengthens advanced manufacturing and better enables Canada to contribute to NATO’s collective defence; the transformation of the mining sector into a linchpin of Canada’s industrial and geopolitical strategy; and sovereign launch capability just as space becomes the next economic frontier. 

Business investment and real GDP per capita reach historic lows

All of this would follow a 10-year capital recession. Over the past decade, Canada’s net outflow of investment exceeded $1 trillion, the most significant capital exodus in modern Canadian history. For every dollar invested in Canada from abroad, two dollars exited. Canada accounted for nearly 10% of global outward foreign direct investment over the past decade, having exported more capital than any country on Earth save the U.S. and China. Canada now ranks last among G7 nations in investment in both machinery and equipment (M&E) and intellectual property (IP). Only about 30% of Canadian capital formation goes into these productivity-enhancing categories—half the U.S. share.4

Canada has net $1T invested abroad

The unifying view of the experts we consulted—from pension funds to policymakers, manufacturers to miners—is that Canada doesn’t lack for capital. Instead, the barriers are execution, predictability, and risk tolerance. What’s needed is more boldness and commercial ambition. Growth requires tradeoffs in three interlocking areas:

  • Raise risk tolerance in the Canadian ecosystem and dismantle burdensome regulatory, permitting and project delivery barriers while respecting the rights of Indigenous people and protecting the environment.

  • Inject process certainty: Investors are adept at navigating risk but flee when hemmed in by vague rules and shifting frameworks.

  • Reward risk-taking and entrepreneurship to stimulate innovation and growth.

None of this will be easy. While Canada’s stock has been climbing, global competition for capital is intense. Canada isn’t the only nation in build mode. But it does have all the traits of an economic leader: a deep talent pool, abundant natural resources, political stability, and the rule of law.

The question is not whether Canada can grow—but how.

ScenarioTrend GrowthStep Change
Capital Required$430 Billion$705 Billion
No significant attempt to grow oil or liquefied natural gas productionTwo new oil pipelines increase output by one third
Investments incrementally expand outputThree new LNG export terminals
Expansion of carbon capture capacity

Canada’s oil and gas industry sits at a strategic crossroads. Canadian producers appear poised for growth: the International Energy Agency (IEA) forecasts that under current policy, global oil and natural gas demand will continue to increase through 2050.5 The demand for oil is driven in part by growth in developing markets, aviation, and petrochemicals. LNG capacity is surging to unprecedented levels—300 billion cubic metres of new export capacity is scheduled to hit the market by 2030—bolstering global LNG supply by about 50%, some two-thirds of which originate in the U.S. and Qatar.

Energy security has become a top geo-political concern. And that was before the war in Iran curtailed supply, sent prices soaring, and exposed the dependence of many advanced economies on the Middle East. The long-term impact of the supply shock remains to be seen. It’s also too early to conclude that demand for Canadian oil and gas will remain strong for the foreseeable future. And not just for energy purposes, but as feedstock into critical industries like pharmaceuticals and fertilizers. Venezuela remains a wildcard. It’s unclear if investment will flow into that country at the scale required to meaningfully augment its production and export capabilities. Strategically, this leaves the U.S. exposed, despite being the largest global producer of oil. With 46 billion barrels of recoverable oil, the reserve-to-production ratio means that the U.S. has less than seven years of proven reserves on current consumption patterns.

The operating environment in Canada, however, is constrained. Pipelines are near full capacity and several mega projects have been delayed or cancelled over the past decade. The Canada-Alberta MoU signals a policy inflection: for capital markets, it reduces political sequencing risk—historically one of the largest contributors to Canada’s cost of capital. In conjunction with Prime Minister Mark Carney’s commercial diplomacy, including LNG exports to the Indo-Pacific and accompanying trade infrastructure, the message to global capital is that Canada’s policy environment is more open to development.

Canadian natural gas and LNG are also in expansion mode. Strong interest from Asian and European countries seeking energy security and coal-to-gas transition offer a clear growth pathway. Canada’s West Coast is well-positioned to supply this demand—if export capacity, permitting, and Indigenous partnership are aligned.6 With the U.S. rushing into the LNG space, future growth will depend on predictable and accelerated permitting, environmental assessment efficiency, and policy harmonization across jurisdictions.

Oil & Gas (2024)

VariableValue
Employment148,000
Revenue$248B
Exports$115B
GDP$97B
Source: Statistics Canada

From a capital perspective, oilsands majors have emphasized capital discipline and shareholder returns, having deleveraged their balance sheets. The bulk of capital in the industry comes from operating cash flows and retained earnings. Canada’s oil and gas players hold tens of billion in cash on their collective balance sheets and generate tens of billions more in free cash flow. The industry is well capitalized to internally finance growth, but the debt and equity markets would readily respond to catalyzing investments. Between the heavy capital requirements of the industry—drilling programs, bitumen mining, processing plants, refineries, and pipelines—mere maintenance opex is extraordinarily expensive. The industry has been reticent to undertake the heavy capital investments required to expand productive capacity because it is so sensitive to policy and the uncertainty around pipeline approvals, not to mention commodity price volatility.

Capital tends to flow in the industry when policy certainty creates the extended investment horizon necessary for retained earnings to be channeled into durable, productivity-enhancing assets. Absent that, capital will tend to be returned to shareholders in the form of dividends and stock repurchases.

Capex per barrel collapsed—falling from US$75 per barrel in 2014 to US$20 per barrel in 2024 (adjusted for inflation). Production is more than twice as high today as it was in 2000, yet companies are investing less than they did a quarter of a century ago. As a result, Canadian energy infrastructure faces capacity constraints relative to resource potential.

Clean technology integration represents both a capital requirement and strategic necessity. Large-scale carbon capture and sequestration (CCS) projects like Pathways Alliance and methane emission reduction programs are important factors in securing market access and political support. IEA modelling indicates that decarbonizing the oil and gas sector will require adoption of tried, tested and affordable methane abatement technologies (e.g., leak detection and control devices) and heavy investment (US$100+ billion) in CCS technology to reach net zero. Without these investments, Canadian producers risk losing access to carbon-conscious markets.

Until key aspects of the Canada-Alberta MoU are realized, pipeline capacity will remain the defining bottleneck in Canada’s oil future. Climate policy, including industrial carbon pricing, remain in flux. The debate about the Oil Tanker Moratorium Act adds an additional layer of uncertainty. In the meantime, Canada’s export dependency on the U.S. will continue to pose sovereignty and resilience risks. Without new pathways to tidewater, diversification towards Asia will be aspirational.

Oil capital expenditure has dropped over the past decade

Capital is required to maintain and incrementally expand the current infrastructure and production patterns. Canada remains a strong player in international markets but continues to underplay its hand geo-politically.

  • Oil production grows 10%, rising to nearly six million barrels per day (bpd) in 2030 before plateauing. Canada remains reliant on U.S. buyers.

  • No new export oil pipelines: the system relies on improved efficiency within existing infrastructure.

  • For LNG, production grows with the completion of announced expansion projects (Woodfibre LNG and Cedar LNG), but Canada does not feed Indo-Pacific demand. No new greenfield terminals are added beyond what is already funded.

  • Limited CCS deployment constrains market access in Europe and Asia and deepens domestic divisions over hydrocarbon development.

Canada becomes a nation capable of providing energy security to allies, supporting global emissions reductions, and galvanizing national economic growth through long-term, capital-intensive investments.

  • Two new export pipelines anchor this scenario:

    • West Coast tidewater line to Prince Rupert or Kitimat could add one million-plus bpd.

    • U.S.-bound pipeline connecting Alberta to Gulf Coast refiners could add 800,000 bpd – which could be added in phases through existing systems or through a new large diameter pipeline expansion project.

  • Oil production grows to 7.1 million bpd by 2035. 

  • Large-scale carbon capture and sequestration (CCS) package becomes integral to Canada’s strategy, enabling expanding production. Emissions reductions were incorporated directly into our growth model:

    • Pathways, which would sequester up to 22 metric tonnes per year (Mt/year).

    • Additional projects could sequester oil sands emissions of similar scale (e.g., Alberta Carbon Grid or Origins).

  • Three new major LNG projects add 3.8 billion cubic feet per day (bcfd) to Canada’s LNG export capacity: LNG Canada Phase 2, Ksi Lisims LNG, and Tilbury LNG expansion.

Combined, these investments create a fundamentally different energy system. Canada contributes to the long-term energy needs of the U.S. and underwrites energy security for partners in Asia and Europe. Canada regains influence in the global oil and LNG markets, diversifying its trading partners and strengthening sovereignty. Indigenous equity partnerships are embedded in mega projects, aligned with community needs, facilitating accelerated project timelines. Upstream emissions are managed through large-scale CCS.

ScenarioTrend GrowthStep Change
Capital Required$400 Billion$670 Billion
Completion of projects underwayExpand wind and nuclear power to enable economy-wide electrification
Grid maintenanceGrid expansion and modernization

Canada’s electricity system is built on roughly 80% non-emitting power anchored by hydro and nuclear. However, the coming decades will test every part of the grid. Electrification of vehicles, buildings, industry, and data centres mean demand could double by 2050. To keep the grid reliable and affordable, Canada must massively expand and modernize a system that was built more than half a century ago. Policy momentum is building in this area, with a new pan-Canadian electricity strategy under development.

Electricity planning is shifting from a provincial utility logic to one that ties national infrastructure with industrial strategy. Hyperscale data centre commitments and applications are transforming load forecasting from incremental upgrades to step-change demand modelling. Electricity is increasingly viewed from the lens of industrial capability and economic resilience rather than power need and climate management alone. And there are areas for enhanced regional cooperation on generation and transmissions—think interties—with an important coordinating, financing and regulatory role for Ottawa.  

Modernizing Canada’s variegated systems will be expensive. The power sector differs from other industries—split between public utilities and private operators, all under the rubric of heavy regulation. It’s a balance sheet-driven sector where capital flows are highly structured. Investment tends to be financed through long-term debt, not equity. The risk-and-return profile is not only tied to market prices; instead, regulatory approval, the rate-setting framework, cost-recovery mechanisms, and occasionally, risk-sharing arrangements, attract long-horizon, liability-driven investors like pension funds and insurers who are attracted by the security and stability of returns.

Utilities Sector (2024)

VariableValue
Employment140,000
Revenue$51B
Exports$4.6B
GDP$46B
Source: Statistics Canada

Investment flows into multi-decade generation, transmission, and distribution networks, grid modernization, storage, and digital control systems. Unlike other heavy industries, productivity improvements tend not to be derived from labour efficiency, but from capital deepening—larger, more resilient, more flexible systems that lower costs and enable downstream economic activity.

At the generation level, each resource plays a distinct role in Canada’s system.

  • Nuclear is undergoing a revival. Ontario’s refurbishment anchors baseload supply, and the Darlington small modular reactor (SMR) will be the first grid-scale project in the Western world. Large-scale nuclear comes with significant cost and scheduling risks. A recent study found that of the two dozen project types, nuclear waste and nuclear power came in first and third, respectively, in terms of cost-overruns. Ontario’s refurbishment program, however, was delivered ahead of schedule and under budget—making it one of the most successful major infrastructure projects in Canadian history.

  • Hydro remains the backbone of power across Canada, but the storyline has shifted. Historically thought of as ‘endless surplus,’ hydro is becoming a balancing source of power as grid and demand requirements evolve. Drought conditions in Quebec, B.C., and Manitoba have exposed the fragility of relying solely on hydro power, too. The future of hydro is less about mega-projects and more about offering flexibility, the strategic use of interties, and providing inertia for the grid.

  • Wind makes up the largest share of new generation. On an incremental basis, wind is the lowest-cost source of new power. The challenge is intermittency and inertia. Integrating large volumes of renewable supply requires storage, grid stability, and flexibility.

  • Natural gas will likely remain a reliability backstop in various regions.

    Rapidly expanding electricity demand also puts strain on the grid and related infrastructure. Transmission and distribution of assets spanning 850,000 kilometres require massive upgrades, regional interconnection, and enhanced digitization. Canada’s patchwork of 10 provincial grids complicates this process. The long-horizon nature of investment planning is complicated by the multiplicity of demand drivers, which are politically, technologically, and culturally contingent.   

Canada is poised to expand its electricty grid

Canada completes what’s already approved, funded, or under construction and generates 20% more power across all sources.

  • Canada brings 63 GW of incremental capacity online across wind, solar, natural gas, and battery storage based on projects already planned and announced.

  • Two major nuclear additions in Ontario: Darlington SMR (online in 2035) and Bruce C Project (in 2041).

  • On the grid side, we assume routine reinvestment and incremental upgrade of Canada’s existing transmission and distribution lines, aligned with limited further progress on nation-wide decarbonization.

The baseline pathway does not materially alter the underlying structure of the system. With climate policy either stalled or in reverse, the policy incentives to decarbonize are less compelling. Global and domestic efforts to reduce emissions remains limited. Electrification proceeds in this scenario, but slowly.

Canada transforms and radically augments its energy system across generation, transmission, and distribution, including policy measures that drive decarbonization and electrification-led economic growth.

  • Canada builds 119 GW of new generation capacity—nearly double the trend growth scenario.

  • New nuclear projects include the Peace River (Alberta), Point Lepreau (New Brunswick), Wesleyville (Ontario), and Saskatchewan SMR nuclear projects.

  • Canada significantly ramps up its wind power beyond projects already in place. Grid expansion of 240,000 kilometres—double the trend scenario—with major costs from modernizing and digitizing the grid, including system reinforcements and new connections.

The expanded system is cleaner, more flexible and self-sufficient. It is responsive to economy-wide electrification and the major demand drivers that are likely to unfold in the coming decades, including:

  • Population growth and associated electricity demand at the household level (think electronics, heat pumps, etc.). This trend is in flux, as Canada’s immigration system is under increasing scrutiny.

  • Electric vehicle adoption, which has stalled with the removal of incentives, but may rebound with Ottawa’s new automotive strategy. Stricter tailpipe emissions standards, renewed EV rebates, and charging infrastructure aim to hit 75% EV sales share by 2035. This trend may extend beyond electrification of passenger cars into freight and heavy-duty transport, adding further load to the grid.

  • Data centres are a wildcard, creating both risks and uncertainty across the sector. Utilities are already signaling demand well beyond what outlooks have modelled:

    • Alberta provides a striking example: grid connection requests jumped from 6 GW to nearly 20 GW by September 2025–prompting the province to implement a two-phase integration program to maintain grid reliability and affordability.

    • Hydro Quebec expects data centres to account for 15% of net new electricity demand by 2032.

    • Ontario’s IESO projects data centres will account for more than 10% of new electricity demand through 2035.

  • Another wildcard: battery technology advancements, which are difficult to forecast, but the cost curve is trending lower.

This scenario supports a larger domestic population that consumes more clean electricity at home and utilizes clean power at work. Through interties and power corridors, Canada expands its grid horizontally, transporting electricity from power-generating regions to power-consuming regions, including abroad.

Power system stability, affordability and flexibility serve as a strategic advantage for Canada globally, helping Canada win new investment mandates in advanced manufacturing and frontier technology, while still working towards the goal of a net-zero grid by 2050.

ScenarioTrend GrowthStep Change
Capital Required$140 Billion$200 Billion
Maintain industry’s long-term growth rateDevelop new early- and late-stage mining projects

Mining has historically been a cyclical industry governed by market forces. But with recent developments in Washington and Beijing, the ever-expanding critical minerals segment of the industry is being steered increasingly by geo-political strategy. Canada, the U.S. and other NATO partners increasingly view mining through the lens of sovereignty, security, and strategic infrastructure.7 In doing so, they are beginning to mirror China’s playbook. Over two decades, China used industrial policy, state-backed finance, and non-market mechanisms to secure control over minerals essential to defence, advanced manufacturing, and clean technology, especially at the level of processing, refining, and secondary manufacture.

The Canada-led Critical Minerals Production Alliance announced more than two dozen new investments and partnerships, mobilizing some $6 billion in projects and designating critical minerals as ‘essential’ under the country’s Defence Production Act. Offtake agreements, price floors, and stockpiling are some of the non-market mechanisms being employed to mobilize private capital. 

The U.S. is going even further with Project Vault—a public-private partnership to finance and stockpile the minerals needed for advanced manufacturing and frontier tech. The White House is using a suite of de-risking instruments such as loan guarantees, offtake agreements, and direct equity stakes in mineral development companies to catalyze the development of lithium, copper, cobalt, and rare earths, among others. Almost overnight, Western governments have gone from observers of mining industry dynamics to market makers.

Mining Industry (2024)

VariableValue
Employment128,000
Revenue$85B
Exports$35B
GDP$32B
Source: Statistics Canada

For Canada, long-standing challenges come into sharper relief. Despite favourable geology, world-class mining finance and engineering expertise, growth has been held back by:

  • A lengthy, complex, and unpredictable permitting process.

  • Insufficient enabling infrastructure (roads, transmission lines, processing facilities).

  • Shortage of specialized mining talent, especially around operational execution.

  • Risk capital. Junior miners have struggled to raise funds from institutional investors as market sentiment pivoted to cannabis, then crypto, and increasingly AI.

To compete in this new era, Canada’s mining industry must move beyond market-driven dynamics into strategic national development. Indigenous equity frameworks are increasingly embedded at early stages, compressing the consultation cycle.

Global demand for metals set to rise over the next 25 years

Canadian mining remains on its long-term historical trajectory. Policy ambition remains high, but the obstacles to capital formation—permitting uncertainty, infrastructure gaps, talent shortages—are not meaningfully resolved. The regulatory environment does not improve fast enough to accelerate capital. Output grows slowly, tracking 0.5% annual GDP growth.

  • New mines struggle to reach final investment decisions.

  • Capital flows remain concentrated in base and precious metals.

  • Canada’s critical mineral potential remains under-developed, owing to dependence on market forces. 

These trends are sufficient to sustain operations and replace depreciating assets but not reshape Canada’s competitive position in global supply chains. Canada preserves its mining base, but supply chain dependence on foreign refining and processing persists. Canada retains relative strength in the wider mining industry but does not become a major player in the geopolitical race for critical mineral sovereignty, losing strategic clout with NATO partners in the process. 

Market forces continue to govern the exploitation of base and precious metals, but critical minerals have become a national priority. Ottawa leads coordinated federal-provincial action and advances several de-risking mechanisms.

The Step Change scenario reflects three fundamental facts about the global mining industry:

  • Many critical mineral projects are not commercially viableif left to market forces. Between small market size, absence of a global market price, or infrastructure barriers, global miners have no incentive to develop many critical mineral and rare earth resources.

  • Canada possesses dozens of strategically significant deposits,but they will require public-private cooperation to fully develop.

  • The U.S. and other allies are moving aggressively;Canada risks being left behind in the global race to build a critical mineral supply chain.

Canada develops a series of projects, both early and late stage, across a range of precious and base metals and critical minerals. Canada becomes a leader in the Critical Minerals Production Alliance, developing its reserves of copper, lithium, graphite, nickel, cobalt, and rare earths. To hedge processing and secondary manufacturing dependence on China, Canada partners with NATO and other allies in the creation of a critical minerals refining supply chain, leveraging existing smelting capacity.

Canada catalyzes:

  • Development of all late-stage projects, including the Eagle’s Nest nickel mine in Ontario’s Ring of Fire and the Casino copper mine in Yukon, among others.

  • Early-stage projects across the range of metals and minerals. Canada is a reliable supplier of critical minerals to NATO partners. Canada strengthens national and international supply chains while building domestic processing capacity. Mining is transformed from a natural resource industry into a linchpin of Canada’s industrial and geo-political strategy.

ScenarioTrend GrowthStep Change
Capital Required$10 Billion$19 Billion
Canada meets its 2% NATO spending targetCore defence spending increases to 3.5% of GDP by 2035

Geopolitical currents are changing rapidly. Uncertainty around the cohesion and stability of NATO has called into question Canada’s military capabilities. After decades of under-investment, Ottawa is sending the strongest demand signal in a generation. The federal government is making historic investments as part of its commitment to raise defence spending to 5% of GDP. Ottawa’s Defence Industrial Strategy serves as the beginning of a new blueprint, combining industrial capacity with strategic positioning.

An expansion of the funding envelope is being met with a change in thinking among the Canadian Armed Forces (CAF), which is shifting away from platform-centric thinking to a capability-centric approach. Uncrewed and autonomous systems—drones—provide an illustrative example of this shift. Drones sit at the intersection of defence, space, AI, and cyber and are quickly graduating from niche sub-sector to foundational capability. Canada’s Drone Surge initiative and the Canadian Army’s MINERVA program exemplify this evolution: government defines the mission or outcome and calls upon industry to provide the solution. Drones also capture the dual-use spirit of Canada’s defence-space strategy since they are already proven in commercial environments while offering scalable military applications when procurement timelines and risk-sharing mechanisms align. When it comes to Arctic sovereignty—a renewed focus for Ottawa—drones provide the persistence and responsiveness that complement space-based assets while maintaining a domestically sustainable capability.

Despite the renewed focus on funding, a series of interlocking challenges afflict the defence industry:

Defence Industry (2022)

VariableValue
Employment36,000
Revenue$14B
Exports$7B
GDP$9.6B
R&D Spend$440M
Source: ISED
  • Low and uncertain government spending has meant that domestic firms lack an anchor customer.

  • Canada’s procurement process can be slow, complex, and politicized. Multi-agency oversight, lengthy bid cycles and administrative complexities discourage investment and constrains innovation.

  • Export opportunities for Canadian companies can be limited in foreign markets because of regulatory, political and economic barriers designed to favour the host country’s sovereign industry over foreign competitors.

  • The persistent problem of scale, with many Canadian SME’s dependent on American conglomerates.

  • The defence supply chain remains fragile in the post-pandemic era, with backlogs and technical bottlenecks squeezing Tier 2 and 3 suppliers.

  • A shortage of skills means companies struggle to find engineers, scientists and technicians.

Capital dynamics in defence are driven by government procurement, long-term contracts, and public R&D funding signals that also attract venture capital and strategic equity for early-stage investment and to structure debt for more advanced companies. Capital flows fund research and development, specialized equipment, manufacturing facilities, and technological infrastructure and operations. Given the nature of the sector, government demand can scale industrial capacity for long-term contracts and derisk private investments.

Budget 2025 expanded the funding framework with new measures for dual-use technologies, critical minerals, AI, and sovereign space-launch capability. The procurement focus is clear:

  • Fighter jets, maritime patrol aircraft, under-ice submarines, and long-range rocket artillery.

  • Revitalization of Canada’s military and dual-use infrastructure, including Arctic installations, the strategy emphasizes air and maritime surveillance.

  • These latter capabilities depend on space, satellite communications, and cyber systems to connect and secure Canada’s digital defence systems.

All of this is nested in a still-emergent industrial policy with strong ‘Buy Canadian’ ambitions. There are forceful tailwinds for the industry, but momentum has yet to pick up.

Canada lags most NATO peers in defence spending

Canada spends 2% of GDP annually into 2035. This produces predictable demand.

  • Ottawa’s ‘Buy Canadian’ policy tilts procurement volumes towards domestic content.

  • The defence ecosystem gets a boost across the value chain, beginning with R&D, but expanding into facilities, and specialized machinery and equipment, resulting in enhanced capabilities.

Bottom line: Canada rebuilds its military incrementally, with expanded hardware in a few key areas. This enables Canada to better surveil the Arctic, patrol the coasts, and support our NATO allies. However, in a world where the integrity of the NATO alliance is in question, or abolished completely, Canada’s defence capabilities remain under-developed.

Canada reaches its full NATO target of 5% of GDP by 2035, including:

  • A linear rise in core defence assets.

  • A greater share of spending is allocated to capital equipment and military hardware.

  • Large domestic procurement for next-generation aircraft, ships, cyber defence architecture, and Arctic infrastructure.

Over the coming decade, this adds $300 billion to total defence spending. If Ottawa sustains its commitment to source at least 70% domestically over the coming decade (up from 30% presently), then Canadian producers stand to gain $100 billion in incremental revenue (this excludes spending on dual-use infrastructure). This is not just more spending. Defence is R&D-intensive, which has knock-on effects across IP production, with spillover benefits across advanced manufacturing, better enabling Canada to contribute to NATO’s collective defence.

Canada builds both sides of the defence-space axis, too. Defence spending revitalizes Canada’s industrial base. Space catalyzes dual-use technology. And Canada becomes a meaningful contributor to allied space and defence capabilities, which is not only an emergent ‘border’ to be defended, but a frontier consumer market as well.

ScenarioTrend GrowthStep Change
Capital Required$5 Billion$12 Billion
Industry grows at historical rate (1% annually)Canadian space sector doubles its global market share, rising to 2% by 2035

Space represents a unique convergence of strategic necessity and capital formation opportunity. As a strategic industry, space capabilities underpin national sovereignty through Arctic surveillance, defence communications, and climate monitoring but it also functions as a productivity layer across other industries—Earth observation and geospatial analytics enhance efficiency in agriculture, mining, energy, infrastructure, and insurance, making it essential to any capital-deepening strategy. The space-AI nexus also creates a powerful demand driver and intellectual property engine, where space data combined with artificial intelligence can strengthen automation capabilities, climate resilience, and defence readiness.

Canada has recognized excellence in satellite communications, space robotics, earth observation and aerospace engineering. As the third nation in space, with a long and decorated history, under-investment at the federal level combined with the failure to develop sovereign space-launch capability has constrained industry growth. That era may now be coming to an end, driven in part by the reconvergence of defence and space technologies.

Space Industry (2023)

VariableValue
Employment13,900
Revenue$5.1B
Exports$2.2B
GDP$3.4B
R&D Spend$650M
Source: Canadian Space Agency

There’s a two-pronged revolution underway and Canada has yet to find solid ground.

  • In the U.S., a policy-driven transformation of the business model unfolded over the past 15 years, with private industry increasingly in the driver’s seat when it comes to capital deployment and innovation.

  • The second locus of transformation is Europe and is just getting started. With the Russian’s invasion of Ukraine and the NATO commitment to increase defence spending, there’s a reconvergence between space and national defence. Traditional space companies are crowding into defence contracts while defence conglomerates expand their space capabilities. ‘Dual use’ space technologies are now the norm.8

Like defence, capital flows when government demand de-risks private investment, enabling firms to deepen technological capability and scale industrial capacity for long-term contracts that would not exist under purely commercial market arrangements. The financing model in Canada is challenged. In space, the fastest path to scale is not government-owned hardware—its government acting as an anchor customer for commercially owned, commercially operated (COCO) services—data, communications, surveillance, analytics, launches—under multi-year, performance-based contracts. When done properly, these contracts function as financeable, near-sovereign revenue streams that lower the cost of capital and unlock large pools of private investment, allowing Canadian firms to scale at home and export globally.

Despite past achievements and present strengths,the industry remains challenged structurally and policy wise.

Space budget among 10 OECD space forum countries
  • Annual sales decline 1% per year.

  • The industry shrinks to $4.5 billion by 2035.

Bottom line: Canada fails to arrest the decline of space. This is primarily a policy-driven choice, not a failure on the part of space companies to innovate and grow. As a result, Canada’s defence capabilities in space remain stunted and core civilian applications atrophy.Bottom line: Canada fails to arrest the decline of space. This is primarily a policy-driven choice, not a failure on the part of space companies to innovate and grow. As a result, Canada’s defence capabilities in space remain stunted and core civilian applications atrophy.

Space is imagined as an essential component of national security and economic competitiveness.

  • Doubling its global market share from 1% to 2%.

  • Building sovereign launch capacity, underpinned by an increase in satellite launch cadence, in keeping with funding commitments in Budget 2025.

  • Deepening dual-use integration with defence.

  • Modernizing procurement around speed, commercial partnering, and risk-sharing.

  • On the space-defence axis, government earmarks a modest share of incremental defence spending growth for dual-use space, procured primarily via COCO service contracts—creating predictable revenues that crowd-in private capital at scale.

McKinsey forecasts that the global space market will reach US$755 billion by 2035.9 Canada captures twice its current share of the market, leading to a 4x boost to sales revenue. And Canada builds both sides of the defence-space axis. Defence spending revitalizes Canada’s industrial base. Space catalyzes dual-use technology, enabling Canada to become a meaningful contributor to allied space and defence capability.

ScenarioTrend GrowthStep Change
Capital Required$155 Billion$205 Billion
Historical growth trends persist in the futureExport-led growth drives Canada to regain its international agri-food export ranking
R&D and IP investments increase, strengthening innovation and productivity

Half a century ago, Canada’s agriculture sector underwent an R&D-fueled innovation and growth boom. The prairie provinces emerged as a global breadbasket, leading in grains and oilseeds, but also in pulses and beef feedlot production. An investment surge in the 1970s and 1980s reshaped farming and coincided with the introduction of new machinery, improved crop varieties, farm chemicals, advanced genetics, and on-farm management systems.

The momentum around R&D, innovation, and growth faded in recent decades. Agricultural productivity growth slowed from roughly 2% in the 1990-2000s to 1.4% more recently.10 Canada’s position as an agri-food exporter has weakened, too. Investment in food and beverage manufacturing, the largest industry in the wider manufacturing sector, was flat from the mid-1990s through the mid-2010s, though it has shown signs of rebounding in the past decade.

Agriculture and Food Processing (2024)

VariableValue
Employment695,000
Revenue$337B
Exports$60B
GDP$78B
Source: Statistics Canada

We have seen a brief wave of expansion in food processing since 2018—a $770 million Maple Leaf poultry plant, for example, and a $250 million flour milling facility by Parrish & Heimbecker. RBC estimates that the industry has invested $7.5 billion in expanding its manufacturing capacity in recent years, leading to a 20% boost.

Farming operations depend on a mix of cash flow, retained earnings, and bank debt to finance growth, using land, equipment and inventory as collateral. Food processors, some of which are global in scope, can leverage their corporate balance sheets to finance growth, in addition to cash flows, and have access to capital markets. Capital is deployed into productive investment through machinery and equipment, precision agriculture technologies, storage facilities, processing plants, and increasingly, R&D into seeds and biologics.

An interlocking set of stumbling blocks hold the sector back:

  • An innovation engine under strain. Canada’s agriculture R&D has declined in real terms and as a share of GDP. Public support for agricultural knowledge and innovation—once leading the charts at 3% to 4% of industry revenue—has fallen below the OECD average, eroding the pipeline for the next canola and limiting the commercialization of precision tools, seeds, and data systems.

  • Capital intensity. Capital constraints can deter the adoption of costly high-tech equipment such as drones, crop sensors, and the GPS monitoring systems used in precision agriculture.

  • A wave of succession and widening skills gap. The average farm operator is 56. Transition to the next generation is looming. And the number of operators below that age has declined by more than 50% since 2001.11 At the same time, farms are becoming more tech-driven and data-intensive, demanding operators with technical, analytical, and system-management skills. Labour and skills shortage require varying levels of solutions from targeted immigration (in the short-term) to more integrated educational discipline and smarter ag tech (over the long-term).

  • Export market concentration. Some 60% of Canada’s agriculture and processed food exports are shipped to the U.S., creating an unhealthy concentration risk. America’s status as a mature market (i.e., ageing population, slow growth) also tempers the possibility of future export growth, especially when compared to emerging markets.

Canada still has enormous capacity—fertile land, abundant water, advanced genetics, and a globally competitive supply chain. Unlocking the next era of growth depends on whether Canada can generate a new investment wave and rebuild its innovation eco-system. Canada will need to win on two fronts: use production inputs more efficiently and move up the value chain, capturing more of global food processing capacity. This would mean adoption of innovative ag tech to advance crop yield research, livestock management, greenhouse operations, and expansion of domestic manufacturing capacity—realizing efficiency gains on farm and in factory.  

Capital formation in agriculture is slowly trending up
    • Public and private investment flows into R&D and IP at historic levels.

    • On-farm investments in structures, machinery and equipment maintain capital intensity.

    • Food processing facilities replace or refresh machinery and equipment.

The consequences of this scenario:

  • Productivity continues to grow slowly, remaining well below historic highs. Farm Credit Canada estimates up to $30 billion in foregone industry income over the next decade due to unrealized efficiency gains.12

  • Canada’s position in the global agri-food trade continues its slow erosion. Canada was the fifth largest exporter in the early 2000s, but has slipped to seventh today (and could fall to ninth within 10 years).13

This scenario does not entail collapse, but it is managed stagnation. Canada maintains its current footprint but misses the next global wave in ag-tech, automation, and value-added processing.

Canada unleashes another multi-decade growth cycle. We imagine a 1970s-style investment boom, built on the back of strengthened support for R&D and IP. More public and private capital flows into research and IP generation, which brings technological advancement and capital deepening, incrementally improving farm efficiency and facilitating the adoption of new technologies. In this scenario, the growth rate in food processing is driven by foreign demand for Canadian food exports.

  • Canada regains its international agri-food market share, rising from seventh to fifth, reinforcing its status as an agri-food superpower.

  • Public and private R&D-related spending would need to increase by 50% just to match GDP-adjusted levels from the 1980s. However, returns on the R&D investment could be 10x to 20x.14

  • Canada undertakes a deliberate, coordinated effort to trigger a new investment and innovation cycle across the industry. Capital spending surges, underpinned by large-scale adoption of emergent ag technologies, including crop genetics, more efficient machinery, and enhanced production systems.

Whether it is for allocating more funding towards research, upgrading equipment for increased efficiency, or adopting new practices, meaningfully augmenting productivity will require another phase of capital deepening. Our growth scenario also imagines Canada expanding and deepening export markets, especially for processed foods. As noted in recent RBC research, Canada could capture a large piece of the global agri-food trade, reclaiming its global ranking.15 For food manufacturing, this means exports climb above current levels. The result is not only food sovereignty, but the provision of food security to allied and friendly countries, reinforcing Canada’s standing as an industrial leader and trusted partner.

For decades, Canada’s capital framework was built along familiar lines of private enterprise operating in relatively free markets with increasingly open borders, all governed through multilateral institutions. Comparative advantage and cost efficiency dictated capital flow. The new age we are entering is defined by fragmentation and a larger role for the state, with industrial capability, sovereignty, and geopolitical alignment adding to the traditional calculus of profit and loss.

Canada does not lack capital, but the systems to deploy it are maladapted to the new age. Capital is not flowing to where it is needed at the speed or scale required–it’s a capital mismatch. A modern capital formation framework for Canada must focus on better integrating capital pools with investable assets.

The proximal source of capital to finance growth is the companies themselves. Canada’s non-financial corporate sector, which holds more than $1.1 trillion in currency, deposits, and debt securities on its balance sheet, is the first layer in the capital stack. While insufficient to fuel our step change scenario, the deployment of corporate Canada’s spare cash could create a cascading effect, crowding in additional pools of capital.

The framework we propose focuses on four additional pools of capital: institutional, risk, foreign, and state.

Capital Framework for Canada
Capital SourceRole in the
Capital Stream
Stage of RiskCore ConstraintWhat’s LackingUnlock Mechanism
Institutional
Pensions, asset managers
Long-horizon, liability-matching assetsInfrastructure, mature assetsInvest in assets—not projects Unable to absorb development or early-stage riskPipeline of bankable, de-risked projectsAsset recycling framework
Risk
VC/PE
Innovation, scaling, commercialization,Start-up,
scale-up
Weak transition from scale to maturityLate-stage growth capital, anchor customersCommercial-enabling procurement
Foreign
Sovereign wealth
Supplement domestic capital, scale enablement, global integrationAll stagesPolicy clarity, speed, returnsPredictable investment regime, fast approvals, competitive ROICorporate income tax + Investment Canada Act reforms
State
FPT, Public FI’s
Demand creation, risk absorption, strategic projectsEarly-stage, development, strategicFragmented deployment vehicles, executionScalable deployment vehicles, speed, FPT coordinationLeverage public demand and state balance sheet
  • Large pools of institutional capital—pension funds, global asset managers, insurers—are positioned to invest in long-duration, de-risked, assets with predictable cash flows. Canada produces too few of these assets. Instead, many opportunities exist at earlier stages of development—projects burdened by regulatory uncertainty, permitting delays, or commercialization risk. Institutional capital is not designed for these opportunities.

  • Canada’s risk capital ecosystem performs relatively well at the early stages. Venture capital and private equity support a steady pipeline of innovation, but not enough companies make the transition from startup to scale. The country lacks late-stage growth capital, as well as the demand signals—procurement, anchor customers, deep domestic markets—needed to support commercialization. As a result, successful companies remain stranded at mid-size, unable to grow domestically.

  • Foreign capital remains an underleveraged source of growth. Global investors prioritize jurisdictions that offer policy clarity, speed, and competitive returns. Canada possesses the core endowments required to compete for global investment but consistently underperforms on execution. Lengthy approval timelines and policy volatility increase uncertainty and the cost of capital.

  • State capital could be deployed at scale, not to replace private capital but to catalyze it. In a more fragmented global political economy, governments are playing a bigger role in directing capital flows through procurement, equity stakes, and other de-risking mechanisms. Canada has deployment vehicles—there is a spate of Crown corporations and public financial institutions; but co-ordination and execution hinder the deployment of state capital and the crowding in of private investment.

To address the misalignment problem, we explore an interlocking set of mechanisms that would attract and unlock investment. These options are designed to improve investor certainty, reduce execution risk, and raise after-tax returns without materially adding pressure to Canada’s already-strained public finances. Critically, each option is politically implementable in the near-term.

Canada has significant public capital tied up in mature, low-risk public assets—ports, utilities, pipelines, roads and other core infrastructure. These assets could (and often do) generate stable, predictable cash flows, making them well suited for long-term institutional investors. Yet, they remain on public balance sheets, limiting fiscal flexibility at a time when many governments across Canada are already running deficits. At the same time, policy uncertainty dissuades investment in critical infrastructure projects. As a result, institutional capital remains sidelined while projects in the national interest remain under-capitalized.

An asset recycling frameworkcould address these challenges, not by reducing the public balance sheet but by mobilizing it. Governments at all levels own assets—from pipelines to airports, power utilities to bridges—that can be monetized. Under a brownfield-to-greenfield model, governments could lease or divest mature assets, converting dormant public wealth into productive economic flows, and reinvest the proceeds in new infrastructure. When required, federal incentive payments could be used to encourage provincial and municipal participation. The benefits are clear:

  • For government, fiscal capacity is created without raising taxes or issuing public debt. Instead, governments rotate capital from mature assets to high impact infrastructure.

  • For citizens, new infrastructure is created without taxes being raised.

This model does not introduce new costs, but it does reallocate who pays, which is where the (unavoidable) trade-offs enter. Shifting the burden from general taxpayer to direct user fee can create political friction. This is despite its economic logic, which can improve fairness (since costs align with usage) and enhance efficiency (since pricing disciplines demand while supporting maintenance). Governance is key to both program success and public support. 

Public capital is most valuable at the high-risk, early-stage of development, while private capital is well suited to long-lived, de-risked assets. An asset recycling frameworkcould help governments achieve fiscal balance while generating the velocity that is part of the dynamism of a market economy. Australia’s asset-recycling program illustrates the potential: $2.3 billion in federal incentives catalyzed $15 billion in incremental infrastructure investment over five years, accelerating infrastructure development without increasing public debt.

To ensure the asset recycling framework is effective, it could include:

  • Clear eligibility criteria focused on mature, revenue-generating assets.

  • Ring-fencing the proceeds of divestitures for new infrastructure investment (not general revenue).

  • Transparent valuation and governance standards.

This build-prove-privatize model would attract private capital and enable productivity-enhancing investment in core infrastructure without straining public finances.

The scale mismatch in Canada is most pronounced among mid-size firms. Large pools of institutional capital like pension funds require projects to meet minimum size, maturity, and cash-flow thresholds. Yet, many Canadian projects and enterprises are either too small or too early-stage to qualify.

Commercial-enabling procurement can help bridge this gap, but the model must evolve from an administrative function to an industrial policy tool. Rather than buying platforms, government should purchase capabilities through outcome-based contracts. Government would act as anchor customer, channeling public demand to create revenue certainty for projects and companies that struggle to access capital because of commercialization risk.16 Smart procurement would crowd-in private capital, harness competition, transfer risk, and encourage innovation, creating a capital formation cascade.

Multi-year production runs, fleet standardization, and lifecycle sustainment contracts could convert one-off purchases into durable industrial capability. Sustainment and upgrades generate recurring revenue streams, skilled employment stability, and domestic IP control. Canada could continue to experience persistent capital leakage long after the initial procurement decision. Here the financial architecture matters: anchor contracts enable project finance and asset-backed lending, while long-term off-take agreements materially lower weighted average cost of capital by making debt viable earlier in the development lifecycle. This ‘butterfly effect’ could transform procurement into broad-based capital formation, graduating Canadian firms from perpetual Tier-2 suppliers to globally competitive prime contractors.

NASA’s Commercial Crew and Cargo Program (C3PO) provides an illustrative example. Historically, NASA designed, owned, and operated its assets using cost-plus contacts with heavy bureaucratic oversight and limited commercial reuse. After 2005, NASA flipped the model—transforming the playbook from ‘build and own’ to ‘buy and use.’ NASA became an anchor customer, purchasing services from private companies that design and own multi-customer assets. Launch costs fell 10-fold, with reusable rockets, autonomous docking, and space tourism some of the notable innovations.

Applied in Canada, the model could:

  • Act as a strategic demand signal. Build on the anchor customer model to provide sustained demand through long-term contracts, reducing commercial uncertainty, and incentivizing the significant capex required for frontier technology development. Advance purchase commitments with guaranteed minimum volumes could help crowd-in risk capital.

  • Performance-based contracting. Transition from cost-plus to fixed-price service delivery for mature assets, using competitive tendering that rewards enhanced capability while managing cost overrun risks. Deploy performance metrics tied to capability and delivery timing, with corresponding rewards (favourable pricing, bonuses) and penalties (fines for delays).

  • Administrative streamlining. Reduce bureaucratic burden on contractors, allowing them to focus scarce resources on capability development, productivity improvements, and serviceability. To accelerate programs, consider developing a transaction authority that sits outside the traditional procurement system that can award follow-on production contracts without having to compete for it (assuming success at delivering needed capabilities on budget).

The result would be aligned incentives, a clearer commercialization pathway for small and medium-sized firms, and a more dynamic eco-system of companies with the enhanced ability to service domestic needs while competing internationally.

Global investors assess jurisdictions based on openness to investment and their structural competitiveness. Hospitality to foreign investment and tax policy are critical inputs in the decision matrix.

Canada’s framework for reviewing foreign investment—the Investment Canada Act (ICA)—is a source of friction in attracting global capital. Ensuring national security and a net benefit to Canada are sound goals, but the application of the framework can create uncertainty, opacity, and extended timelines. The reactive and discretionary nature of the system creates unpredictability, which acts as a deterrent to foreign investment. Reform would improve investor certainty while boosting after-tax returns.

  • The system for screening and approving foreign investment can be made more rules-based and strategically aligned by distinguishing between sectors that are commercially or strategically sensitive and sectors where capital is actively welcomed. Reforms could preserve national security while enhancing the attractiveness of Canada as an investment destination by:

    • Introducing fast-track pathways for low-risk investments such as minority stakes, investments from trusted allies or projects in cleared sectors.

    • Creating strategic investment corridors with preferred allies, aligning policy, capital and industrial strategy in areas like mining, energy, and advanced manufacturing.

These changes would shift the ICA from a perceived barrier to a predictable facilitator for foreign investment that simultaneously safeguards national interests while welcoming global capital.

Canada also requires a more competitive corporate income tax regime. Since 2018, when the U.S. and others reformed their systems, Canada lost its corporate tax advantage. That’s why leading tax experts are calling for ‘big bang’ tax reform that incentivizes investment rather than creating ever-more layers of distortionary tax credits. We see two options to boost after-tax returns on capital that are worth further study:

  • Canada could tax distributed profits while exempting retained earnings. Estonia and Latvia offer full exemption for retained business profits, for example, and have been successful at attracting foreign direct investment. Assuming this option could be made compliant with international tax treaties and OECD minimum tax rules, Canada could:

    • Tax profits that are distributed—dividends, buy-backs, and deemed distributions.

    • Exempt profits that are retained within the business, incentivizing reinvestment in R&D, IP formation, machinery and equipment, and business expansion.

    • Importantly, this approach could be made revenue-neutral for governments by eliminating the impact of other inefficient and distortionary tax incentives, which would become redundant.17

Despite being revenue-neutral for government, this reform would make Canada a more attractive destination for investment by meaningfully lowering the marginal effective tax rate. It would also directly and materially reward firms that channel capital into productive activities in Canada.

  • A suite of reforms which would improve Canada’s tax competitiveness by:

    • Lowering the federal CIT rate. Reduce statutory corporate income tax rates to enhance Canada’s competitiveness relative to other jurisdictions, particularly following recent U.S. tax reforms.

    • Full expensing of capital investments. Allow businesses to immediately deduct the full cost of machinery, equipment, and intellectual property investments rather than depreciating them over time. This would provide immediate cash flow benefits and reduce the cost of capital for growth-oriented investments.

    • Enhanced capital gains treatment. Increase capital gains exemption limits for business investments and expand business rollover allowances to facilitate reinvestment and business succession planning, while maintaining fairness.

This comprehensive approach would make a strong statement about Canada’s commitment to being a preferred destination for global capital while maintaining revenue sustainability and international tax compliance.

Canada faces a persistent challenge in financing projects and technologies that are commercially viable over the long term but fail to clear private investment hurdles in the near term. These are typically first-of-a-kind (FOAK) technologies or strategic assets—small modular nuclear reactors, critical minerals, rare earth processing, carbon capture—where long lead times, uncertain demand, or price volatility crate a gap between risk tolerance and Canada’s strategic interests.

The issue is not the absence of capital but of risk-bearing capacity. Private investors unwilling to absorb early-stage uncertainty when timelines stretch over decades and revenue streams remain unclear. The result is underinvestment precisely in the industries that are most critical to Canada’s industrial and geopolitical positioning.

A more active deployment of state capital can help close this gap—not by displacing private investment, but by reshaping the risk-return profile to crowd it in. A range of instruments can be utilized:

  • Public-equity stakes in early-stage or systemically important projects or firms, allowing the state to absorb initial risk while preserving upside participation.

  • Price floors to reduce commodity volatility and support project viability, particularly in shallow or immature markets such as rare earth mining and processing.

  • Long-term offtake agreements that provide revenue certainty, enabling project developers to secure debt or equity financing against contract demand for long horizon projects.

  • Strategic stockpiling to stabilize markets and signal sustained public demand in priority sectors.18

These tools are already deployed in peer jurisdictions, particularly in critical minerals and energy, where governments act as market makers rather than market observers. An outstanding question is not whether to use these tools— but how to deploy them at sufficient speed and scale.

This capital formation framework is about restoring Canada’s investability by reducing uncertainty, creating scale where capital mandates require it, transferring early-stage risk away from private investors and improving after-tax returns on productive investment.

By lowering the risk-adjusted cost of capital across strategic industries—oil and gas, electricity, mining, defence, space, and agriculture and food processing—Canada can convert its latent advantages into bankable projects.

But this great opportunity won’t last. In an era of intensified competition, capital will flow to countries that make investments viable. Canada needs to move quickly–turning ambition into action.

Capital Gains: How Canada can unlock the $1.8 trillion it needs for growth - download the report

Download the Report


A.  Methodology and Data Sources

Oil and Gas

For the oil and gas industry, the capital required includes:

  • Brownfield investment to incrementally increase conventional oil and the oil sands output;

  • Greenfield investment to develop new oil sands production capabilities;

  • New oil pipeline infrastructure to strengthen export capacity;

  • New investment in natural gas extraction;

  • New LNG export facilities;

  • Investments for carbon capture projects.

Our Trend Growth Scenario for oil borrows production forecasts from RBC Capital Markets.

  • Production grows from 5.1 million barrels per day (Mb/d) in 2024 to 5.9 Mb/d by 2030, then plateaus. The incremental output is proportionately split between conventional oil and the oil sands.

  • Pipeline optimization and improved efficiency enables more oil to flow through existing infrastructure. We assume either the Enbridge Mainline adds 300,000 barrels per day or the Trans Mountain—via pump stations—adds 245,000 barrels per day beyond 2027. We assume no major greenfield production sites are built; increased output is sourced from current sites.

  • Capital spending figures come from the Canadian Association of Petroleum Producers and the Canadian Energy Regulator. To calculate an annual capex estimate for the coming decade, we took the average capex spent per barrel of oil production from 2017 to 2023 for conventional oil ($38.80) and for the oil sands ($9.90).

  • Our Trend Growth Scenario for natural gas includes completion of the Woodfibre and Cedar LNG facilities. Drawn from Natural Resources Canada, the combined cost is estimated to be $11.5 billion. This enables an additional 0.7 bcf/d of new export capacity.

In our Step Change Scenario, we assume two new oil pipelines are approved:

  • Keystone XL adds 0.83 Mb/d and a pipeline from Alberta to British Columbia (loosely inspired by Northen Gateway) adds 1 Mb/d in capacity. To generate an estimated cost for each pipeline, we took the cost-per-kilometre for the original Northern Gate pipeline (provided by the National Energy Board) and adjusted it for inflation and cost overruns. We estimate that each pipeline costs approximately $30 billion. We assume that pipeline construction begins in 2028 and will take four years to complete. This adds ~1.2 Mb/d in oil sand production capacity. This estimate includes a 70:30 split between bitumen and condensate in the pipelines themselves.

  • The added pipeline capacity enables greenfield investment in oil sands at a cost of ~$56,000 per barrel per day. This enables total Canadian oil production to grow to 7.1 Mb/d by 2035.

  • Our Step Change Scenario includes three additional LNG export terminal projects: LNG Canada Phase 2, Tilbury, and Ksi Lisims. The estimated costs are drawn from publicly available sources. Collectively, these export terminals require ~$55 billion in capital spending. These terminals add 3.75 Bcf/d of export capacity. We assumed $10 per barrel of oil equivalent (BOE) in capex cost for the added natural gas extraction.

  • Our step change scenario imagines heavy investment into carbon capture and sequestration (CCS) infrastructure. We assume major projects go forward, including the Pathways Alliance’s Phase 1, at a cost of $24 billion. We assume two additional projects of a similar scale go forward. We loosely estimate the total investment for CCS projects amounts to $80 billion over 10 years, based on publicly available estimates. We source project-level CCS data from the BloombergNEF Carbon Capture Capacity Database and include approximate costs from various sources, including news articles.

Electricity

For the electricity sector, the capital required includes:

  • Initial project costs to build power plants that are already in various stages of development or have been announced;

  • The costs to replace or upgrade the power grid, including transmissions and distribution lines, enabling new connections and reinforcing systems.

Our Trend Growth Scenario sees projects in various stages of development proceed to the construction phase.

  • Electric capacity grows by ~69 GW across all energy sources. We account for projects where permitting processes have started, where projects have secured financing, and where projects are already in construction phase, and power projects that have been announced. We rely on the S&P CapIQ power projects database. The data provides capacity and construction cost measures for projects by technology type.

  • We also include the Bruce C and Darlington SMR nuclear projects in our trend growth scenario. Combined, they provide 6 GW of new capacity. OPG estimates the cost of the Darlington SMR at ~$21 billion. For Bruce C, we rely on MIT’s Center For Advanced Nuclear Systems to cost AP1000 reactors, which come in at US$8,300-$10,375 per kW.

  • We use an illustrative deployment schedule of large-scale nuclear from Ontario’s integrated energy plan, evenly allocating construction costs over time. For projects where deployment is expected to take place beyond 2035, we assume a portion of the cost by 2035.

We compare this capacity buildout to the Canada Energy Regulator’s (CER) Energy Futures 2026 projections. Our trend growth scenario is largely in line with new capacity requirements under CER’s ‘Current Measures’ scenario, which assumes a limited additional policy-driven push towards electrification and greening of the grid.

Investments for grid maintenance and enhancement are from BloombergNEF’s projections. These include investments in both transmissions and distribution power lines, and grid substations, as related to replacing aging assets, building new connections, and conducting system reinforcement.

While BloombergNEF’s scenarios do not directly correlate to scenarios developed by CER (‘Economic Transition Scenario’ (ETS) used for our trend growth), they also assume no further policy support for the energy transition beyond existing measures, similar to CER’s ‘Current Measures’.

In our Step Change Scenario, we incorporate the additional capacity needed for Canada to remain on the net-zero track as projected in CER’s ‘Net-Zero’ scenario. We also include four additional nuclear projects—Wesleyville, Saskatchewan SMR, Point Lepreau and Peace River—which add an additional ~13 GW at an estimated cost of $149 billion, of which $43 billion is allocated by 2035. Under the step change scenario, total capacity grows by 98 GW.

TechnologyCER ‘Current Measures growth 2025-35 (MW)CER ‘Net-Zero’ growth 2025-35 (MW)Projects in development (MW)Announced projects (MW)Additional capacity in Step-Change scenario
Solar10,82610,1759,4614,003
Wind36,12858,52617,7453,49337,288
Hydro6,3186,3381,0166,111
Natural Gas9825,0397,0754,438
Battery4,8425,4135,7133,455
Nuclear2,1122,1126,00013,175

Similar to the Trend Growth Scenario, we use BloombergNEF’s projections for investments related to grid infrastructure. The Net Zero Scenario describes a challenging yet achievable stretch to get on track for net zero by 2050. While it doesn’t directly map onto CER’s ‘Net-Zero’ scenario, it offers a directional pathway.

ProjectCaseCapacity
(MW)
Cost ($B)EstimationTimeline
Darlington SMRBase1,20020.9OPG192029-3520
Bruce CBase4,80058.3MIT CANES212031-4122
Peace RiverGrowth4,40039.3Derived estimate232029-4224
Point LepreauGrowth3005.2Derived estimate252030-3426
Sask. SMRGrowth3155.5Derived estimate272030-3428
WesleyvilleGrowth8,16099.1MIT CANES2033-4729

Mining

Capital requirements for mining sector includes a combination of:

  • Capex needed for general operations;

  • Costs of construction of new greenfield projects.

We use a combined approach: general economic modelling to estimate capital spending for the Trend Growth Scenario; and a bottom-up, project-based approach that draws on data from S&P Capital IQ for the Step Change Scenario.

In our Trend Growth Scenario, we utilize the Cobb-Douglass production function using trends over past 10 years, assuming the relationship between investment and output matches historical patterns. The Cobb-Douglas production function quantifies the interaction between labour, capital and productivity in relationship to GDP. We use Statistics Canada Table 36-10-0217-01 to establish the relationship between multifactor productivity (MFP), capital (K) and labour (L) inputs, and real GDP, expressed as follows:

RealGDP=MFPKαL((1α))Real GDP=MFP*K^α*L^((1-α))

First, we derive a general value for elasticity the factor α, which is ~0.7 on average during 2012-2021. We use the following tables for data on mining and quarrying (except oil and gas) – NAICS 212:

Once the model is set, we apply a 10-year CAGR rate for real GDP, labour, and productivity to extend projections under the Trend Growth Scenario. Real GDP grows at page of 0.6% annually into 2035, which implies ~$139 billion total investment flows into the industry over the next decade, based on historical depreciation rate of ~16%.

Investments here are in reference to fixed non-residential capital flows. This includes construction of industrial buildings such as plants, machinery and equipment, and intellectual property products that are the result of R&D and similar activities.

In our Step Change Scenario, we stack the cost of constructing more mines in Canada across a range of metals and minerals: gold, zinc, iron ore, potash, U3O8, copper, lithium, graphite, nickel, rare earth elements (primarily lanthanides), and cobalt. We obtained a dataset of 1,000+ projects currently operating or in various stages of development. To model the Step Change Scenario, we took a bottom-up approach by examining:

  • More than 1,000 active and inactive mining sites across Canada;

  • 50+ late-stage projects across base metals (zine and copper, for example), precious metals (gold, silver), and critical minerals (lithium, graphite);

  • 100+ early-stage opportunities with known costs or reserves.

We refer to projects in their pre-feasibility stage (reserves development, advanced exploration, prefeasibility and scoping) as ‘early stage’ projects, and those already in feasibility stage or where construction has started as ‘late stage’ projects.

As mining projects move further along the development pathway, more information becomes available. As such, we narrow the focus to 228 active projects with information on initial capital costs or production capacity estimates. Some 95% of late-stage projects have information available.

For projects where only production capacity information is available, we apply an estimated average cost per production capacity for the respective metals or minerals. The Step Change Scenario sees development of all late-stage projects, as well as 10% of early-stage projects proceed to completion over 10 years.

MetalTotal countActive projectsEarly Stage: Projects with cost or capacity infoLate Stage: Projects with cost or capacity info
Gold4462966924
Silver32172
Zinc915187
Copper16396243
Lithium3232127
U3O8472173
Graphite221452
Nickel6939115
Potash13742
Lanthanides141362
Iron Ore5334119
Diamonds1152
Platinum521
Cobal3311
Total1,00163016365

Defence

Capital requirements for the defence industry are comprised of a mix of R&D and machinery & equipment, all tethered to different assumptions of government defence spending. According to data from Innovation, Science and Economic Development Canada’s (ISED) State of Canada’s Defence Industry report, the industry generates revenues from domestic sales and exports, with an equal split between the two. And sales to the federal government make up ~two-thirds of domestic revenues.

We assume spending on capital equipment by the federal government is the primary source of the revenue for the domestic industry, and one that varies between the scenarios. We assume other revenues expand at a nominal GDP growth rate of 3.5%.

Historically, M&E and R&D spending have made up ~5.5% of revenue. We harness this ratio to derive the capital expenditure needed by the industry to meet new revenue trajectory.

In our Trend Growth Scenario, we assume Canada reaches only 2% of NATO spending. Spending is allocated across personnel (50%), operations and readiness (25%), capital equipment (20%), and infrastructure (5%), which is the historical mix, with the ‘Buy Canadian’ provision boosting the Canadian content share from 30% to 50% by 2035 (in a linear rise). The federal government has signaled that, historically, some 70% of defence spending was allocated to foreign producers, leaving 30% for the domestic market. Ottawa wants to invert that ratio over the coming decade, tilting the balance 70/30 towards Canadian firms.

In our Step Change Scenario, the primary difference is that Canada is on trajectory to meet 5% NATO spending requirement, of which 3.5% is spend on core defence goods. We assume the spending mix remains the same. Personnel spending remains similar to the Trend Growth Scenario, and readiness and infrastructure spending grow proportionally at the historical allocation mix of 25% and 5%, respectively. The remainder of defence spending focuses on acquiring new (or replacing ageing) capital equipment, which offers increased revenue for the industry, requiring further investment to meet the higher demand.

Space

Data on the Canadian space economy is limited. The Canadian Space Agency (CSA) publishes an annual State of the Canadian Space Sector Report, including revenue, gross domestic product, employment and exports. Company-level data is available for publicly traded firms. Our method blended data from both sources to model sales revenue, GDP and capital expenditure across the Trend Growth and Step Change scenarios.

The calculations were made through a series of steps.

  • To forecast sales revenue and GDP to 2035 in the Trend Growth Scenario, we derived the longest possible compound annual historical growth rate using CSA data (2014-2022), which we assume will govern the future growth of sales revenue (-0.8%) and GDP (1%) going forward.

  • To forecast sales revenue under the Step Change Scenario, we assume Canada doubles its global market share by 2035, rising from ~1.1% of the global market in 2022 to 2% by 2035. In partnership with McKinsey & Company, the World Economic Forum projects the global space market will grow to $755B USD by 2035, putting Canada’s share at CA$21B. This scenario thus sees the space market grow 4x in 10 years.

  • To infer the capital required under the two scenarios, we used data for publicly traded space firms. From 2020-2024, Canada’s publicly traded space firms had a capex-to-revenue ratio of 36% (on a weighted average basis). That figure was skewed by heavy investments from a few key firms that are unlikely to be repeated in the future, even under the Step Change Scenario. To better anchor the capex-to-revenue ratio, we included a few mature aerospace companies, which have lower capital requirements. On a weighted-average basis, this brought the capex-to-revenue ratio down to ~10%.

  • Across the Trend Growth and Step Change scenarios, we multiplied annual sales revenue by 10% to determine the annual capex, aggregating the figures over 2025-2035 to determine the total capital required

Agriculture and Food Processing

For the agriculture industry, the capital required includes:

  • Public and private sector support for agricultural knowledge and innovation through expenditure on R&D and IP;

  • Among food processing and manufacturing, capital expenditures on non-residential construction, machinery and equipment to optimize processes at the plant-level;

  • Among large commercial farmers, capital deepening through the adoption of ag-tech solutions.

With data from USDA, we explore Canada’s agricultural productivity across multi-decade periods. The trend suggests productivity growth peaked in 1990s-2000s and declined thereafter. From Statistics Canada’s Table 36-10-0096-01 we chart investment trends over the same period. We compare real investment flows over time as well as investment flows relative to the industry’s GDP. We observe high investment rates (both in real terms and as share of GDP) in the mid-1970s and mid-1980s, which are associated with leading productivity gains in the decades that followed. From the OECD’s Agricultural policy monitoring database we track public support for research and development activities dating back to 1986. The trends show declining spending in real terms, as share of industry revenue, and relative to agricultural GDP.

In our Trend Growth Scenario, we extend the average investment trends of the past 10 years. This suggests ~$10 billion annual investment in non-residential construction, machinery and equipment purchases and ~$1.3 billion combined industry IP investments and public support for R&D.

Our Step Change Scenario assumes Canada repeats the investment surge witnessed in the 1970s-1980s, which could raise productivity through more innovation, stronger advanced tech and practice adoption, and investments into efficiency gains. Industry capex increases to ~$13.8 billion annually to match peak levels in 1970s, and combined public and private R&D-related investments rise to $1.6 billion, matching peak levels in 1980s.

Combined total rises to ~$18.9 billion if instead investment levels are calibrated on proportional size to industry GDP – where industry capex investment stood at ~34% (vs 21% currently) as the share of industry GDP on average during 1973-1982, and combined public and private R&D spending was 4.2% (vs 2.7%) during 1986-1995.

For the food manufacturing industry, we tailor the Trend Growth and Step Change scenarios to Canada’s share of global exports aligned with pathways developed in Food first: How agriculture can lead a new era for Canadian exports. Canada’s current market share of global agriculture and agri-food exports stands at 3.7%, and by 2035, global agriculture and agri-food export market (HS codes 1-24) is projected to grow by 0.6% annually. In our Trend Growth scenario for the food manufacturing industry, we assume Canada only maintains it current global standing. This implies 0.8% annual growth in exports of food manufacturing products. Our Step Change scenario for food manufacturing industry assumes Canada increases its export market share by 50%, capturing about US$66 billion by 2035.

In both scenarios, to estimate overall production levels (Statistics Canada table 36-10-0488-01) we combine projected exports with domestic consumption. Domestic consumption is based on historic per capita levels – ~$2500 of real output (adjusted to 2025 price levels) per person, and by 2035, Canada’s population is expected to reach 44.3 million. Overall, food manufacturing production is projected to grow from an estimated $144 billion in 2025 to $155 and $173 billion by 2035 for Trend Growth and Step Change scenarios, respectively. We use a recent spike in investments since 2018, which led to 20% increase in estimated real output, compared to the historic average of 1.9 investment per output ratio during 2007-2017 to derive capital requirements for production capacity increase aligned with our Trend Growth and Step Change scenarios.

B.  References

Ampofo, K. et. al. 2024. Transition Metals Outlook 2025. New York: Bloomberg New Energy Finance.

Ashton, Lisa. 2024. Food first: How agriculture can lead a new era for Canadian exports. Toronto: RBC Thought Leadership.

Baskaran, G., D. Wood. 2025. Critical Minerals and the Future of the U.S. Economy. Washington: Center for Strategic and International Studies.

Bataille, M., J. Francis and J. Potin. 2025. The (Re)Convergence of Europe’s Space and Defence Industries. ESPC Report 94. European Space Policy Institute: Vienna.

Bloomberg NEF. 2024. Transition Metals Outlook. New York: Bloomberg Finance LP.

Bryce Tech. 2025. Start-Up Space: Private Sector Space Investment Activity in 2024. Alexandria, VA: Bryce Tech.

Canadian Space Agency. 2023. What we heard report: Consulting Canadians on a modern regulatory framework for space. Ottawa: Government of Canada.

Cembalest, M. 2025. Heliocentrism: 15th Annual Energy Paper. New York: J.P. Morgan Asset Management.

Chollet, D. and S. Kapnick. 2025. Power Rewired: The New Map of Energy and Geopolitics. New York: JPMorganChase Center for Geopolitics.

Competition Bureau Canada. 2023. Competition in Canada, 2000–2020: An economy at a crossroads. Ottawa: Government of Canada.

Conference Board of Canada. (2024). Innovation report card 2024: How Canada performs. Ottawa: Conference Board of Canada.

D’Souza, C., T. Grieder, D. Hyun, J. Witmer. 2020. The Canadian corporate investment gap. Staff Analytical Note No. 2020-15. Ottawa: Bank of Canada.

Globerman, S. 2024. The weakness of corporate investment in Canada, 2001–2021. Vancouver: Fraser Institute.

Gulab, S., and G. Lhermie. 2025. ‘A Case for Reinforcing Agri-food Research and Development Spending: Where Does Canada Stand Internationally?’, The Simpson Centre, 18 (3). Calgary: University of Calgary School of Public Policy. 

International Energy Agency. 2023. Emissions from Oil and Gas Operations in Net Zero Transitions. Paris: IEA.

International Energy Agency. 2025. Oil 2025: Analysis and Forecast to 2030. Paris: IEA.

Jurgens, J. and R. Brukardt. 2024. Space: The $1.8 Trillion Opportunity for Global Economic Growth. Geneva: World Economic Forum.

Kanji, S. and A. Parsons. 2024. State of the Canadian Space Sector Report. Longeuil, QC: Canadian Space Agency.

Khosla, J., Y. Kokkinos, C. Turner. 2025. Build big things: Accelerating major project delivery in Canada. Ottawa: Public Policy Forum.

Lindenmoyer, A. 2014. Commercial Orbital Transportation Services: A New Era in Spaceflight. Houston: NASA.

Manalo, P. 2023. ‘Discovery to production averages 15.7 years for 127 mines’, S&P Global, June 6.

Minister of Industry. 2014. Canada’s Space Policy Framework. Ottawa: Canadian Space Agency.

Minister of Innovation, Science and Economic Development. 2019. Exploration, Imagination, Innovation: A New Space Strategy for Canada. Ottawa: Canadian Space Agency.

Mintz, J. 2025. ‘Why Canada Needs ‘Big Bang’ Corporate Tax Reform’, Perspectives on Tax Law & Policy, 6 (4): 1-4.

Mollins, J., P. St.-Amant. 2019. The productivity slowdown in Canada: An ICT phenomenon? Staff Working Paper No. 2019-35. Ottawa: Bank of Canada.

Natural Resources Canada. 2024. 10 Key Facts on Canada’s Critical Minerals Sector. Ottawa: Government of Canada.

OECD. 2023. The Space Economy in Figures: Responding to Global Challenges. Paris: OECD.

OECD & FAO. 2025. Agricultural Outlook 2025–2034. Rome: OECD Publishing.

Pardy, G., R. Mann, C. Neibert, M. Harvey, R. Kwan, M. Choy, N. Ng. 2025. Energy Insights: Awakening the Northern Giant. Toronto: RBC Capital Markets.

Robson, W., M. Bafale. 2024. Underequipped: How weak capital investment hurts Canadian prosperity. Toronto: C.D. Howe Institute.

Sharp, A., T. Sargent. 2023. ‘The Canadian productivity landscape: An overview’, Canadian Tax Journal, 71:4, pp. 1125-47.

Smith, T., K. et. al. 2025. Missions for prosperity: Building Canada’s next era of economic growth. Toronto: Boston Consulting Group & Centre for Canada’s Future.

Space Capital. 2025. Space Investment Quarterly, Q3-2025. New York: Space IQ.

Theron, G. 2025. Raising business sector productivity: Economic Survey of Canada. Paris: OECD.

Mohamad Yaghi, 2023. Farmers Wanted: The Labour Renewal Canada Needs to Build the Next Green Revolution. Toronto: RBC Climate Action Institute.

C.  Acknowledgements

The authors would like to thank the following people, whose insights informed our thinking and writing, as well as the numerous experts who wished to remain anonymous:

Agnico Eagle Mines: Alden Greenhouse

Arrell Food Institute at the University of Guelph: Evan Fraser

Bennett Jones: John Baird

Bombardier: Francis Richer De la Flèche

Brookfield Asset Management: Cyrus Madon

Bruce Power: James Scongack

Canada Pension Plan Investment Board: Andrew Alley, Bruce Hogg, Tara Perkins

Canadian Climate Institute: Kate Harland

Canadian Food Innovation Network: Richa Gupta

Export Development Canada: Sven List

MDA Space: Guillaume Lavoie, Patrick Nihill

NASA: Alex MacDonald (Alumni)

NordSpace: Rahul Goel

Ontario Ministry of Agriculture: Steve Duff

Ontario Teachers’ Pension Plan: Jonathan Hausman

Prospectors & Developers Association of Canada: Jeff Killeen

RBC: Tracy Antoine, Daniel Chornous, Louis Derlis, Chinyere Eni, Andrew Hay, Ken Herbert, Sara Gelgor, Stuart Kedwell, Robert Kwan, Eric Lascalles, James McGarragle, Lorna McKercher, Rob Nicholson, Greg Pardy, Chris Redgate, Hugh Samson, Michael Scott, Michael Siperco

Space Canada: Brian Gallant

Teck Resources: Jeff Hanman, Dale Steeves

The Simpson Centre for Food and Agricultural Policy: Sabrina Gulab

University of Calgary: Robert Johnston, Jack Mintz, Trevor Tombe

Volatus Aerospace: Greg Colacitti, Glen Lynch, Abhi Singhvi

Canada’s agri-food startups present a $13-billion investment opportunity. Capital flows in growing agri-food companies could help Ottawa achieve its target of unlocking $1 trillion in investment by 2030 to power economic growth.

The country’s agri-food sector is currently undercapitalized by domestic growth funds. The sector accounts for only 2% of government-backed growth, venture and infrastructure funds at the federal level, and brought in an estimated 4% of total growth funds invested in Canada over the past 5 years.

It’s not that there isn’t interest. Venture and institutional funds have attempted to flow but fragmented governance across provinces and sector fit for funds have pushed agri-food to the sidelines of mainstream approaches to deploying growth capital.

Domestic agri-food companies got a piece of the growth capital boom–$10.5 billion–between 2015 and 2021. However, investments across sectors have dwindled. Today, growth investment in Canadian agri-food is lower than it was a decade ago, with values down 32% and deals by 29%.

The basic mechanics of growth for an agri-food company can cut the sector out of fund priorities. To align investment with Canada’s growth and sovereignty ambitions, funds like the $1B Venture and Growth Capital Initiative announced in the 2025 federal budget could establish agri-food lanes with tailored tools.

Other nations–including Finland, Japan, and the United Arab Emirates–are explicitly linking food security, productivity, and industrial policy through coordinated growth capital strategies. To achieve food security goals, the UAE launched the Agri-Food Growth and Water Abundance (AGWA) cluster with the ambition to attract $48 billion by 2045 specifically for their agriculture, food and water sectors.

The opportunity for Canadian investors and innovators–public and private–is to better calibrate and scale capital and businesses to anchor economic value domestically. This starts at the idea stage, improving universities’ weakening role in innovation and reverse trends in business outsourced investments to universities for agri-food R&D, which have fallen 64% in the past five years.

Canada has one of the world’s most productive agricultural systems, globally competitive farmers, and is a net exporter of value-added agriculture and food products. Yet, the country is steadily losing its position as a preferred place to start, scale, and retain agri-fooda startups. That’s because the pipeline for investment and innovation has structural gaps and barriers, from seed to maturity.

Canada is in building mode. Its ambition to attract $1 trillionb in investment over the next five years to drive growth for the country is a signal.1 A key piece of mobilizing this investment is to put Canada’s existing infrastructure, growth, and venture funds to work for potential high-growth sectors, such as agri-food industries. Most notably, the 2025 federal budget identified agri-food as one of three sectors that Canada enjoys a strategic global advantage. But Canadian agri-food accounts for less than 2% of growth-oriented government-backed funds. And over the past five years, agri-food companies have only captured 4% of total growth capitalc investment in Canada, which agri-food investors characterize as a stark under-investment in the sector.

If Canada were to align its growth capital investment in agri-food with the industry’s contribution to GDP as a benchmark to build from, it would require an estimated $13 billion from now until 2030–a 36% boost in investment relative to the past five years. An investment ambition to focus action and position Canada as a thriving, global hub of agri-food innovation and products.

Global disruptions over the past five years highlight the need to advance Canada’s sovereign capacity in agriculture and food innovation, production and processing. And the rest of the world is not waiting for Canada to perfect its approach. Without immediate action, Canada risks capping agri-food sector’s growth potential by not hosting more value-add processing domestically. It risks hollowing out the agri-food innovation ecosystem as companies and talent look to other countries, including Australia, Japan and Germany, which are growing their investment in R&D and commercialization.2 And it risks irrelevance in the era of disruptive technologies—including AI-driven decision tools, gene editing, biological inputs, automation, robotics, and novel food processing—that will shape productivity gains in the decades ahead.

There is a mismatch between the framing of Canada’s agri-food sector as a superpower and its strategic advantages with the actual scale and focus of investments domestically. Transforming Canada into an agri-food superpower requires a targeted, nimble approach to capital and growth that navigates the sector’s restraints and fulfills its true potential.

Canada-based companies attarct 3% of growth capital in agri-food sector
  • Purpose of capital: Idea development, early prototyping, market research

  • Investors: Angel investors, incubators/accelerators, university and government grants, venture seed funds, family offices

  • Strengths: Government and regionalized support via early-stage innovation programs

  • Challenge: Breakdown between public and private collaboration on commercialization of intellectual property (IP)

  • Purpose of capital: Pilots, prototyping, market testing, and small-scale production

  • Investors: Accelerators, venture firms, corporate venture, government grants, family offices, Crown corporations

  • Strengths: Growing network of venture funds

  • Challenges: Navigating investment pathways and undercapitalization risks that could force bridging rounds, slow development, and dilute equity

  • Purpose of capital: Continued innovation, market leadership emerging, scaling operations

  • Investors:  Venture firms, private equity, corporate strategic investment, Crown corporations

  • Strengths: Access to international market for capital, especially U.S. and EU

  • Challenges: Gap in follow-on fund, especially Series B to growth and fragmented domestic capital-raising options

  • Purpose of capital: Stable cash flows, slower growth, operational efficiency and expansion, exit

  • Investors: Commercial banks, private equity, merger and acquisition, trade sale, initial public offering

  • Strengths: Strong commercial bank support, however, project financing can be difficult to secure

  • Challenges: Few large domestic corporate acquirers; often requires sale to foreign buyers; Companies with infrastructure projects face structural challenges in assembling capital mixes

Not enough companies make it to growth; and not enough capital is available for the select few that do.

The scale, staging, and value of growth capital invested in growing companies are indicators of a sector’s momentum and growth prospects. In Canada, upstream and midstream marketsd  that cover agriculture inputs to food processing is generally well covered for early-stage capital by government grants, family offices, and venture firms. While end-stream markets like food brands have less access to early stage-funds, with fewer active venture firms in the market. Agri-food companies across market segments start to face Canada’s growth capital challenge of fragmented and shallow domestic funds when seeking to raise $15 million in capital or more. And across economic sectors, there is a significant gap in capital for growth, with domestic venture firms not positioned to inject more than $30 million. This constrains scaling and reduces Canada’s ability to attract and retain high-potential agri-food companies. The situation is exacerbated as agri-food in Canada is too complex for general investors to navigate without industry expertise. The capital pools, for example, engaging with an agriculture-tech company are often completely different from those engaged with a food brand company as their growth metrics, markets, and use of capital differ substantially (e.g., IP vs. a distribution warehouse).

The growth capital market has had a volatile decade. The world experienced a surge in growth capital across sectors, including agri-food, in the lead up to the peak in 2021. Between 2015 and 2021, growth capital in Canadian agri-food in the early and venture stages grew by 1,405% and 480%, respectively.3 This growth was driven by a few factors, and actors:

  • Global interest in agri-food technology and sustainable agriculture surged with the growing urgency to feed more people with fewer environmental impacts. As a result, global investment in agri-food technology rose to $71 billion in 2021.4

  • In response, Canada launched incubators (YSpace Food Incubator), accelerators (SVG Thrive) and applied food science centres (Saskatchewan Food Industry Development Centre) to enable commercialization of agri-food innovation.

  • Agriculture and food focused venture funds also grew in Canada, including District Ventures Capital, Ag Capital Canada, Emmertech, Tall Grass Ventures, and Nya Ventures.

  • And some crown corporations helped drive momentum in the sector through initiatives like Farm Credit Canada’s (FCC) $2 billion commitment by 2030 to advance innovation in the domestic agriculture and food industry.

Growth stage capital acocunts for 12% of investments over the past decade

Since 2021, most segments of growth capital availability and investments have dwindled. Investment in Canadian agri-food companies is now lower than it was a decade ago, with values down 32% and deal count by 29%.5 This contraction mirrors trends in other major agri-food economies—including the U.S., Brazil, and Australia—where funding focused on agri-food technologies dropped to a 10-year low.6

While there have been some positive signs in the past five years, such as rising private equity and a shift to focusing on impactful and mature companies, fundamental challenges in retaining and attracting capital remain. The most obvious challenge is the growth-stage. The value of available capital in Canada in growth stages falls roughly 37% compared to the venture stage where the startups are more supported by venture firms and incubators.7

Canada's agri-food companies face a deep valley at growth stage

However, focusing on fixing this problem in isolation, can result in new problems arising along the pipeline. For example, the agri-food venture funds that emerged over the past decade in Canada now seek to raise new, larger funds to address gaps at the growth capital stage, and this shift could risk creating a new gap in early venture—rounds of between $1 million and $5 million. Enabling capital availability at each stage of growth and across market segments therefore requires coordination among investors to build coverage along the pipeline.

The absence of a Canadian agri-food unicorn—defined as a privately held startup valued at more than $1 billion—is a macro signal that Canada does not have an ecosystem that can propel promising companies.8 Peers like the Netherlands, Germany, and Australia all have unicorns—and heavy hitters like the U.S., India, and China have a stable-full.

Top agri-food unicorn producing countries

Capital structures push companies down and out of Canada.

Canada’s agri-food startups often advance slower through their commercialization and market expansion stages relative to those in competing markets because capital pools are shallower. Less capital leads to incremental growth and longer time horizons to demonstrate returns. While early-stage companies can attract public and venture funding, those seeking larger rounds are often forced to seek capital abroad.

Canada's peers pull ahead in growth stage investments

Vive, a crop protection company based in Mississauga, Ontario, is looking to raise Series D capital, seeking more than $40 million, starting in Q1 of 2026. Vive expects that more than 75% of the capital raised in this round will come from outside Canada. This builds on Vive’s initial market expansion, which occurred in the U.S. because the active ingredient approval for their products took four years compared to the eight years it took in Canada.

Fueling early agri-food innovations but avoiding support for those same innovations at growth stages.

Support from government at the early stages of growth comes largely from incubators, accelerators, cost-share and R&D programs, which are important pieces of Canada’s agri-food innovation pipeline. Yet, this concentration and program delivery often results in Canada’s emerging leaders in agri-food being described as “grant-entrepreneurs” who are forced to spend excessive time on finding and writing applications and meeting reporting requirements instead of building investor-ready businesses. Of course, government checks and balances are vital in public funding, but accessing and reporting on these funds can be made more efficient.

Another challenge with government capital is that economy-wide pools of funds like the Canada Growth Fund do not intentionally restrict agri-food, but the sector often does not fit neatly within investment criteria for several reasons, including project scales, geographical dispersion of production and projects, and the definitions of innovation or clean technology. As a result:

  • Canada Growth Fund’s 17+ investments do not feature a single agri-food company.

  • Of Canada Infrastructure Bank’s 106 investments, only one is focused on agriculture production.

  • The agri-food sector makes up an estimated 3% of the 575 companies invested in through the Venture Capital Catalyst Initiative (VCCI) and Venture Capital Action Plan.

Capital from asset-tied farmers to blocked out institutional investors is an untapped resource for Canada’s agri-food sector.

Institutional investors in Canada, like pensionfunds and private equity firms, want to be engaged in Canadian agri-food but face a trifecta of investment barriers:

  • Limited number of sizeable projects

  • Co-investors, both private and public, to share risk

  • Investment-limiting regulations

Canada’s model for capital attraction in primary agriculture illustrates some of these barriers. Canada is optimized for family ownership with differing provincial regulations on ownership restrictions including foreign investment and supply management for some sub-sectors. This is in sharp contrast to Australia, for example, which treats agriculture as an investable export industry via large, aggregated farms with professional farm management companies. Investors can inject hundreds of millions into single companies, who then have more liquidity to make investments in new companies and innovations that can boost their productivity.

Institutional investors looking to make significant investments with proven returns might see Canada’s fragmented model difficult to navigate. As a result, some of Canada’s largest pension funds invest in agriculture outside of Canada. Public Service Pension Investment’s natural resource portfolio is made up of roughly 77% agri-food investments, with Canada accounting for 9.3%. The largest share, 43.3%, goes to Oceania countries, predominately Australia.

Farmers also have an important role in the agri-food innovation and capital pipeline as new products and services in the upstream market segment can directly impact their growth and productivity. But Canadian farmers are limited since capital is often tied up in operational costs and assets, like land, buildings and equipment. This reduces both demand signals for novel technologies and co-investment opportunities in impactful projects relative to countries that can attract large-scale investments at the farm-level and have available capital for expenditures beyond operations and assets.

Risk aversion dampens investor appetite, entrepreneurship, and innovation.

Unlike the U.S., where a “fail fast, iterate, scale” culture fuels deal activity and risk appetite, Canadian investors are generally more risk-averse, particularly beyond seed stage, which discourages bold bets. This shows up in the number of new Canadian companies seeking funding rounds.

Agri-food companies established in select top countries

Traditional investor preferences toward, for example, information technology over agri-food innovation —often perceived as lower-growth and lower-return—limit participation by generalist venture firms and institutional investors. This reinforces narrow capital pools for late-stage agri-food deals.

The onus to build clear and consistent approaches to access support and capital should not lie solely with investors. If startups can get customers, capital often follows. This stresses the need for improving the applicability of new innovations to real-world problems and the adoption of these innovations alongside investment, starting with Canadian farmers, corporates and retailers but also foreign customers for Canadian companies to truly scale.

Proven demand would enable startups to forge capital paths through their growth stages and work with investors to build the right capital stacks. Three Farmers, a Saskatchewan-based snack food company, scaled production in the Prairies and sells its seasoned pulses in more than 4,000 retailers across Canada and the U.S. Attracting growth capital has been a key component of the company’s success. That includes a 2022 raise of $6.2 million led by three pivotal investors: Venture capital firm District Ventures Capital who has deep consumer packaged goods expertise, Export Development Canada how helps companies effectively grow in foreign markets like the U.S., and Protein Industries Canada who can offer access to innovation and supply chain networks.9 In 2025, a new strategic partnership with Farm Credit Canada (FCC) added equity but also the smart capital that growing companies need in the form of mentorship to help navigate regulations and optimal approaches to capital mixes. Such examples offer a gameplan on engaging and connecting with the right type of investors—at the right time.

Building supply chains requires capitalemerging agri-food companies struggle to source it domestically.

Building out agri-food supply chains and commercializing products often requires infrastructure development for production and processing facilities, which demands the right capital structures across equity and debt to make the developments attractive for companies and investors. Often new facilities for production, especially for food products and processing, require off-take contracts or adoption commitments to secure investor confidence. In Canada, where there is a small pool of investors willing to engage in large capital projects, food supply chains are decentralized, and price benchmarks can be uncertain, particularly for novel food ingredients, obtaining these commitments can be difficult, raising percieved risk.

Despite the upfront cost to commercialize and expand, growth in the industry runs counter to the assumption that momentum is not building for value-add processing in Canada. Over the past decade, year-over-year revenue growth in agri-food manufacturing has averaged 5.9%, compared to the manufacturing average of 3.6%.10

Investment in agri-food manufacturing assets has grown by about 32% in constant prices over the past decade.11 This moderate growth is primarily driven by expansion of established, large scale agri-food companies building out meaningful processing capacity.

Yet, many new companies innovating in food ingredients face barriers in bringing together the right capital stacks due to supply-chain barriers–a lack of price certainty and contractual commitments from buyers before processing infrastructure is built. As a result, Canada risks losing value-add processing to other growing jurisdictions where the capital is flowing it. For example, Phytokana Ingredients Inc., an Alberta startup turning Canadian-grown fava beans into food ingredients, is working to build out Canada’s value-add processing of pulses and is in the process of securing funding to construct and commission a fully automated 30,000-metric-tonne-a-year dry fractionation processing facility near Strathmore, Alberta.12 However, building the right capital base is proving challenging with domestic investors, pushing Phytokana to explore foreign investors, which may have implications for where future value-add processing is developed.

Canada’s agri-food landscape is difficult to navigate for startups and investors not ingrained in the network of agri-food regional and national organizations. Once in these networks, startups in the early stages are often well supported, but two challenges to building consistent pathways for companies to attract staged capital remain:

  • Navigating the funding and support opportunities and application processes

  • Identifying where to go for follow-on funding

Mapping investor profiles to specific market segments and their mandates provides a structured roadmap for scaling capital from seed through to growth stages. Countries like the U.K., Israel, and Singapore offer examples of how to build such structure. The U.K., for example, is known for structured paths from seed accelerators and hubs into mid-and late-stage capital with organizations such as Founder Factory.

A key reason why agri-food deal counts in Canada over the past three years shrink by 450% between early to growth stage is the state of startup companies’ readiness. Investors consistently cite company readiness as a primary constraint. Founders of startups often excel at proof-of-concept and R&D but face challenges when transitioning to validated customer demand, repeatable revenue models, regulatory and supply-chain readiness and management and governance maturity.

Many organizations, including university research innovation offices and accelerators, are positioned to work on these issues. For example, the Canadian Food Innovation Network (CFIN) connects startups with corporate partners around defined food technology market segments such as food ingredients. These programs enable startups to build relationships with retailers and strategic buyers earlier, while giving corporates and supply-chain actors clearer visibility into emerging innovations. Making this connection is critical to improving startup success rates and building connectivity among industry leaders and startups, as only 6% of public corporate companies engage in venture investment in Canada, compared to 40% in the U.S.13

Canada is increasingly perceived as a regulatory burdensome place to scale an agri-food business and commercialize its IP in agri-food.

Canada lags key competitors like Australia, Japan, Germany, France, Italy, UK and South Korea as a priority jurisdiction for agri-food patent filing.14 An outcome of multinational companies, especially those in life sciences that reported that they have seen Canada significantly fall in their internal ranking of jurisdictions to invest in R&D over the last decade. This is in part due to approval processes for agri-inputs like active ingredients in pesticides struggling to maintain a timely and transparent process for reviewing applications.15 These trends are chipping away at Canada’s brand as a supporter of early agri-food innovation.

United States: Scale and depth

Market share: The U.S. captured 33% of global agri-food investments over the past three years.

Strength: The sheer scale and maturity of its capital markets.

Lesson: Build growth funds that can actively participate across the full company lifecycle. For example, Chicago-based S2G Investments has multiple funds, and can work with companies at different stages of growth, creating deeper capital pools, where agri-food companies have historically struggled to access capital from PE or commercial banks (e.g., pre-revenue).

India: Demand-driven growth

Market share: India now attracts 8% of global agri-food growth investment and is projected to be even more dominate over the next decade as its agriculture productivity rapidly improves.

Strength: Growth is anchored in massive domestic demand, a rapidly modernizing food system, and strong government support for agricultural innovation.

Lesson: Focus on the basics of where production and consumption is growing to steer investment. To meet consumption and production projections, India is experiencing strong growth in agri-marketplace platforms, supply-chain logistics, and precision agriculture through increased participation from domestic venture funds and strategic.

The country now captures nearly 8% of Europe’s agri-food tech investments.16 The recent surge was driven largely by a $260-million growth-stage investment in Finnforel, an aquaculture company, highlighting Finland’s strength in sustainable protein and advanced food production systems.

Despite just 2.3 million hectares of farmland—3.7% of Canada’s farmland mass—Finland is emerging as an innovation hub following a similar government-backed approach that the Netherlands and Denmark have taken to crowd-in private investment for the sector. Finland’s ecosystem is characterized by strong public-private collaboration, deep expertise in cold-climate agriculture and aquaculture, and a focus on export-oriented, high-technology solutions.

Japan is now the third largest agri-food technology investor in Asia capturing an estimated 13% of the market–behind India and China.17 Japan rose in the global rankings on the back of several large growth-stage deals, including a $89-million investment in biomaterials startup Spiber.

Japan’s competitive advantages include active participation by large corporate venture investors, including Global Brain Corporation and Beyond Next Ventures. Japan is a mature domestic market that supports commercialization of premium and functional foods and has notable advantages in key growth areas including biomaterials and fermentation technologies. The country’s domestic ecosystem also excels at scaling capital-intensive technologies that require long development timelines and strong industrial partners.

The UAE imports approximately 80% of its food. In response, food security has become a national priority. The UAE aims to produce 50% of its food domestically and rank first in the Global Food Security Index by 2051.18 To achieve this, the UAE launched the Agri-Food Growth and Water Abundance (AGWA) economic cluster, which aims to attract nearly $48 billion by 2045.

Food security as a strategic imperative has fueled rapid growth in the country’s agri-food sector, and is supported by broader benefits of the UAE’s economy, including:

  • Tax-free zones and investor-friendly regulation

  • Leading logistics infrastructure and a strategic geographic location as a connector between Europe, Africa, and Asia

  • Strong government backing aligned with long-term national goals.

Potential impact: Improve universities’ weakening role in innovation and reverse trends in business outsourced investments to universities for agri-food R&D, which have fallen 64% in the past five years.19

Incentivizing commercialization requires exploring approaches beyond rewarding researchers via grants that measure success based on peer-reviewed publications and promotions dependent on traditional academic-research-services model. Agri-food faculties across Canada could consider strengthening their promotion of academic-entrepreneur pathways for researchers—like Dalhousie University’s Agriculture Faculty offers—and create structured opportunities for universities and the private sector to negotiate IP ownership to support commercialization. This could include enabling co-design partnerships among institutions and companies, providing clearer conflict-of-interest guidance, and embedding commercialization activity into promotion and tenure criteria, particularly in applied sciences and engineering disciplines.

It is common practice for Canadian universities and colleges engaged in private-sector projects to automatically own the IP that’s developed. While this approach is often designed to protect public interest and institutional value, these conditions—combined with the lack of formal recognition, tenure credit, and financial reward structures for researchers acting as entrepreneurs—can create material barriers to commercialization. As a result, institutions like universities, which are foundational breeding grounds for experimentation and novel idea generation, risk being increasingly excluded from the agri-food commercialization pipeline, particularly in capital-intensive and applied innovation areas such as food processing, biomanufacturing, and agriculture tech. The U.S, Israel, and parts of Europe have demonstrated that flexible IP ownership models—such as creator-owned or shared-IP frameworks paired with clear revenue-sharing mechanisms—can materially increase startup formation, industry collaboration, and downstream investment without compromising academic integrity.

Potential impact: Mitigate the stark deal count shrink of 450% from early stage to growth stage; and retain entrepreneurial STEM and business talent in agriculture beyond the current 1% of postgraduates.20

To solve early-stage roadblocks, build an AI-powered concierge platform within an existing national organization with sector credibility and institutional knowledge that allows startups to navigate public and private opportunities in one place, building upon existing tools like AgPal.

There have been previous attempts at building similar services to help startups navigate this landscape, and many incubators and accelerators offer connection and navigation services. Yet, agri-food startups consistently report being lost in the early stages of company formation and experience a sharp drop-off in support once they graduate from an incubator or accelerator. This “support cliff” is particularly acute in agri-food due to long R&D cycles, regulatory complexity, and capital intensity. Such a tool could provide tailored, real-time guidance on funding eligibility, customer discovery, regulatory pathways, clearer hand-offs for each growth capital stage, and ecosystem connections.

Optimizing the platform would require investors and early-stage supporters to align on shared definitions of market segments, innovation categories, and support mandates so the tool can accurately route startups to the right opportunities.

Potential impact: Address agri-food’s underwhelming share of total domestic growth capital by engaging more generalists in the sector, while also attracting a larger share of global venture capital investment, totally more than $500 billion in 2025.21

If the sector wants outsiders to engage, existing agri-food leaders and investors in Canada need to offer more intentional platforms for non-agri-food investors to build familiarity, context, and conviction. A starting point could be targeted national roundtables for each market segment led by select agri-food investment leaders for domestic and international generalist investors to start building connections, share sector-specific investment theses, and compare notes on market segment profiles, timelines, and exit pathways.

On the other side, general investors that have intentions to materially and strategically invest in the sector also have an opportunity to pull agri-food into their coverage area. Opportunities to embed agri-food expertise directly into investment decision-making could include:

  • Investment committees and advisory panels that upgrade their agri-food expertise by including agri-food operators, processors, and sector investors.

  • Fund managers of investment firms participating in federal programs like VCCI must have a team with either:

    • Prior agri-food investing experience, or

    • A formal advisory relationship with sector experts.

Venture funds and programs allow for sector-specialist sub-allocations within broader funds such as agri-food market segment carve-outs within generalist funds.

The potential impact: Position agri-food to have investable projects and companies for government-back funds to invest in beyond the current 2% that the sector captures from these funds.

Although agri-food is cited as one of Canada’s key strategic advantages, government investment programs – at the provincial and federal level – are often not accessible to growing agri-food companies because they are not fit for purpose for the types of innovation, asset intensity, and scaling timelines typical of the sector. This misalignment leaves significant agri-food potential unleveraged.

For example, VCCI does not explicitly exclude agri-food, and some participating fund managers do operate agri-food-focused funds. But only 3% of companies invested in through VCCI-supported funds operate within the agri-food sector. While fund manager expertise and explicit mention of agri-food plays a role, so too do program criteria, technology definitions, and innovation classifications that shape investment decisions and systematically bias capital toward digital-first or asset-light sectors, resulting in agri-food being overlooked.

Rather than creating entirely new programs, existing funds could establish agri-food lanes with tailored tools. One option is to explore a growth-stage agri-food mandate within VCCI or its successor under the $1B Venture and Growth Capital Initiative that was announced in the 2025 federal budget.

There is an opportunity to adjust eligibility rules for federal and provincial government funds to reflect how agri-food companies scale as they raise growth capital, making way for high-quality agri-food companies:

  • Accepting asset-heavy business models that have robust business and risk management plans (e.g., processing facilities, fermentation tanks, cold storage, pilot plants)

  • Recognizing process innovation, novel ingredients, yield improvement, and cost reduction as legitimate innovation—not just software or IP-only advances

  • Allowing longer commercialization timelines (7–10 years vs. 3–5) consistent with regulatory, construction, and market adoption realities.

Potential impact: Canada is a net exporter of processed and value added agri-food products with immense potential to host more processing of products that are largely still exported as raw ingredients. One example is plant protein: while Canada is the number one exporter of dried peas, roughly 88% of production over the past five years has been exported as a raw commodity.22 23 This one example significant missed opportunity for domestic value creation, job growth, and export diversification to benefit from the burgeoning pea protein industry.

Expanding the Canadian agri-food value chain, requires public and private investors to be deploying blended capital structures that reflect agri-food economics. This includes considering tools to mitigate risks in capital deployment for high-impact projects that address a clear growth opportunity for Canada’s agri-food sector such as:

  • Subordinated or patient capital alongside private equity

  • Government first-loss guarantees to de-risk infrastructure projects

  • Revenue-linked instruments or convertible structures suited to variable margins

  • Support for offtake-linked financing when buyer commitments are conditional but there is clear demand

In agri-food markets, upstream buyers often hesitate to confirm long-term offtake agreements before facilities are built or scaled, while investors require revenue certainty to deploy capital—creating a structural deadlock. Targeted risk-sharing tools can bridge this gap and unlock private investment into processing, ingredients, and food manufacturing capacity. Of course, Canada will need to find buyers for processed verse raw ingredients, but not exploring the opportunities to scale processing domestically is a lost value creation opportunity for Canada.

Investing in abundance: Addressing Canada’s growth capital gap in agri-food - social

Download the Report

Alison Suntrum, Nya Ventures and CDL Agri-Food

Amy Standish, Saskatchewan Ministry of Agriculture

Andrew Heintzman, InvestEco Capital

Arlene Dickinson, District Ventures Capital

Ben Gibbons, Water Point Lane

Bianca Parsons, Alberta Food Processors Association

Blair Knippel, Inside Out LLC.

Brennan Gillis, Dalhousie University

Bruce Rathgeber, Dalhousie University

Celine Hildebrandt, Farm Credit Canada

Chris Hartt, Dalhousie University

Chris Paterson, Tall Grass Ventures

Chris Theal, Phytokana

D’Arcy Hilgartner, RDAR

Dana Gibson, Alberta Innovates

Darren Anderson, Vive Crop Protection

Dave Barrett, Dalhousie University

Dawn Trautman, SVG Ventures, THRIVE

Drew Dwernychuk, Innovation Saskatchewan

Evan Fraser, Arrell Food Institute, University of Guelph

Ghader Manafiazar, Dalhousie University

Glen Price, Venturepark

Graeme Millen, Farm Credit Canada

Graham Markham, New Protein International

Greg McElheran, Export Development Canada

Haibo Niu, Dalhousie University

Heather Bruce, Dalhousie University

Jeff Linner, PFM Capital Inc.

Jeff McKinnon, Four Mile

Jeff Zweig, Fiera Comox

Jodie Parmer, Canada Infrastructure Bank

Jolene MacEachern, Dalhousie University

Kassandra Quayle, Protein Industries Canada

Kee Jim, G.K., K Jim Farms and Feedlot Health Management Services Ltd.

Ken McDougall, McDougall Acres Grainex Inc.

Kirby Sawatzky, Parkland Potato Varieties

Krista Heidebrecht, Sofina Foods

Kristjan Hebert, Hebert Grain Ventures

Kyle Scott, Emmertech

Laurie Dmytryshyn, PIC Investment Group Inc.

Lawerence Hanson, Agriculture and Agri-Food Canada

Leah Perry, Wittington Ventures

Lenore Newman, University of Fraser Valley

Marie Barnes, Invest Alberta

Martin Vanderloo, New Protein International

Marvin Slingerland, MNP

Matt Coutts, Coutts Agro Ltd.

Matt Petrow, Rayhawk Technologies

Miranda Stahn, New Harvest Canada

Oleta LeRush, BASF Canada

Richa Gupta, Canadian Food Innovation Network

Rob Russell, Emmertech

Robert Saik, T1 Technology Corporation

Shaun Vey, Syngenta Canada

Stefanie Colombo, Dalhousie University

Steven Webb, Global Institute of Food Security

Suresh Neethirajan, Dalhousie University

Travis Esau, Dalhousie University

Tyler Groeneveld, Protein Industries Canada

Wayne Arsenault, Avena Foods

Wilson Acton, Tall Grass Ventures

The world is undergoing a series of once-in-a-generation shocks and adjustments. Canada needs to adjust, too. Rapidly. 

Some of the economic structures and patterns that brought Canada into this century may not live out this decade. Political and security alliances, so necessary to peace and order, are in the midst of a realignment. And advanced technologies are disrupting the very nature of work, commerce and human interaction — so much so, and so quickly, that even last year’s assessments seem distant. 

The compression of time and risks means no company or government, public enterprise or community organization, can afford to wait and watch.

Eurasia Group and RBC Thought Leadership created this report, the first of its kind, to help Canadians navigate those profound risks and sea changes in 2026. The following is a combination of five assessments from Eurasia Group’s Top Risks 2026 outlook — the global ones most likely to impact Canada — and five assessments from RBC Thought Leadership, exploring the most significant domestic forces that may shape the year ahead. These are not predictions or forecasts: rather, they are carefully considered and researched analyses of the trends, forces and interests shaping our economy and policy environment, informed by economic data, market insights and interactions with leading businesses, investors and policymakers. They’re designed as lighthouses, rather than navigation systems. 

This report is also a foundation for a new global relationship between Eurasia Group and RBC, to help firms and governments assess and manage their own risks in these unprecedented and volatile times. In the year ahead, we will publish more on these issues and convene leading thinkers in the economy and government to advance our collective understanding of the risks around us. In June, we will host the annual Canada-U.S. Eurasia Group summit in Toronto, to help shed more light on the risks, and opportunities, as these two countries and neighbours — both extraordinary in their own right — advance, and as needed redirect, their economic relationship in this rapidly changing world. 

The challenges ahead can seem daunting, even overwhelming. But as we’ve seen through history, including recent history, moments of uncertainty — that amorphous cousin of risk — are when those with clear heads and confident minds excel. 

RBC Thought Leadership

Canada is looking to build its military, develop an industrial base and forge new commercial partnerships at a wartime pace. A failure to execute could lead to others, notably the U.S., stepping in.

Canada’s enthusiasm for rapid militarization began the moment Donald Trump demanded more from America’s NATO allies and deepened as he mused about taking over parts of the Western Hemisphere, from Panama to Greenland, even putting the idea of Canada as the 51st state on the table. For Canadians, the exercise was initially a budgetary one, finding ways to allocate tens of billions to its small and often overlooked military. But when Trump sent the U.S. military into Venezuela, the warning for Canada and its armed forces took on a sharper focus. Borders are no longer gates. They’re hard lines that need to be defended.

For Canada, the task of building a big military—the biggest since the Second World War—is daunting. In war, extraordinary measures like state-run supply chains can be implemented quickly. In peacetime, each step needs more negotiation—that’s made even harder with a public that barely remembers the losses of the Afghan mission and a military bureaucracy that has struggled with much smaller magnitudes of procurement and deployment. The industrial base is a further challenge. Mention the words “military-industrial complex” and most Canadians will say “no, thanks.” Before Trump returned to power, Canada ranked 27th out of 31 NATO nations when it came to military spending as a share of GDP. In fact, defence spending had languished for the past 25 years at levels well below the late 20th century averages. Military enrolment has also been in terminal decline, with less than two service members for every 1,000 people. Even peacekeeping has declined to a few dozen blue helmets.

Read the full risk here.

Eurasia Group

U.S. Political Revolution

The United States is experiencing a political revolution: President Donald Trump’s attempt to systematically dismantle the checks on his power, capture the machinery of government, and weaponize it against his enemies. Last year, we warned about the “Rule of Don”; what began as tactical norm-breaking has become a system-level transformation beyond partisan hardball or executive overreach—qualitatively different from what even the most ambitious American presidents have attempted (please see Box 1: Trump vs. FDR). With many of the guardrails that held in Trump’s first term now buckling, we can no longer say with confidence what kind of political system the United States will be when this revolution is over.

In Trump’s view, he overcame a rigged election, two partisan impeachments, dozens of unjust felony convictions, and two assassination attempts—one a whisker’s breadth from killing him—to stage the greatest political comeback in American history. President Trump sees the principal threat to him and his allies as domestic, not external, and he believes he has a mandate for retribution. The administration views this project not as an assault on democracy but as its restoration, a necessary purge of a political system captured by a deeply corrupt establishment that had already weaponized government against them. Over 77 million Americans voted for Trump in 2024, and many of them sympathize with that diagnosis: Among 2024 voters who said democracy mattered to their decision, a majority chose Trump—not because they saw him as a champion of democratic values, but because they believed the system was already broken and wanted someone who would disrupt it. “Trumpism” is structural, and at this most fundamental level, Trump’s supporters are getting what they asked for.

To read the full risk, download the report.

RBC Thought Leadership

Canada is aiming to double non-U.S. exports through two of its biggest trade antagonists, China and India, even as Canadian investment continues to pour into the United States.

Since Mark Carney launched his “elbows up” campaign to get the country to trade more with the rest of the world, and with each other, Canadians have spent and invested more in the United States, even as Americans are doing less in Canada. The strong U.S. economy, and tax breaks under the Big Beautiful Bill, have reinforced the attractiveness of the world’s largest market for Canadian investors. From pension funds to mutual funds, more Canadian dollars than ever have headed south. Business investment has done the same. Carney may need to do even more on taxes and regulations to keep Canadian investments at home.

For all the bark, and bite, of tariffs, Canadian consumers have been slow to change habits, too. Highly visible brands like Tennessee whiskey were perhaps an easy early target. Florida and Arizona vacations have taken a hit, too. But in large measure, Canadians are still watching Netflix, buying Fords and drinking Coke at the same rate as before the trade war.

Read the full risk here.

Eurasia Group

Europe Under Siege

The hollowing out of Europe’s political center has been a decade in the making. France, Germany, and the United Kingdom each enter the year with weak, unpopular governments under siege from the populist right, the populist left, and an American administration and state-aligned social media openly rooting for their collapse. None face scheduled general elections. Yet all three risk paralysis at best and destabilization at worst—and at least one leader could fall. The consequences won’t stay contained: Europe’s ability to address its economic malaise, fill the security vacuum left by America’s retreat, and keep Ukraine in the fight will suffer.

To read the full risk, download the report.

RBC Thought Leadership

A shift in global oil and gas prospects, from Venezuela to Qatar, changes the investment outlook for Albertan exports—and the big infrastructure projects designed to get them to overseas markets.

Canada’s ambitions to be an energy superpower—including oil and gas—is being tested after the U.S. intervention in Venezuela. But the challenges lie well beyond Canada’s immediate neighbourhood. Long-term demand for oil and gas remains an open question, especially as Asia continues to turn to electrons to power growth. A global surplus of supply, including American LNG, clouds the picture further. And then there’s the question of global growth. No growth, no need for more energy, from Canada or anywhere else.

In one strategic swoop in Caracas, U.S. President Donald Trump has attempted to ringfence the Americas with Washington as its most consequential capital. In that respect, Trump may have weakened Canada’s most valuable negotiating card—energy exports. A resurgent Venezuela crude production could displace Canadian oil in the U.S. and leave it scrambling for market share with Saudis and others elsewhere. It’s a potential competitive shock. Over the past 25 years, Canada had solidified its position as the foremost supplier of oil and gas to the world’s biggest oil market, accounting for nearly three out of every five imported barrels entering the U.S. An industry built to serve America now pumps out a record five million barrels per day, compared to just over two million bpd in 2000, with more than 90% of its exports ending up in refineries in the U.S. Midwest, West Coast and the Gulf Coast.

Read the full risk here.

Eurasia Group

China’s Deflation Trap

China’s deflationary spiral will deepen in 2026, and Beijing won’t do anything to stop it. With the 21st Party Congress looming in 2027, Xi Jinping will prioritize political control and technological supremacy over the consumption stimulus and structural reforms that could break the cycle. Beijing has the means to prevent a crisis, but living standards will deteriorate, the fallout will spread abroad, and the world’s second-largest economy will remain stuck in a trap of its own making.

Home prices in China have been falling for four and a half years—a household wealth destruction on par with America’s 2008 crash, except it’s still accelerating. Consumer confidence, investment, and domestic demand have cratered with it. Beijing bet big that high-tech manufacturing would fill the gap left by property. Instead, state-driven investment has created overcapacity, and weak domestic demand means there aren’t enough buyers to absorb it.

The result is “involution”: too many Chinese firms chasing too little demand, slashing prices to survive. Margins collapse, forcing even well-run firms to cut wages and jobs to stay afloat. Workers spend less. Demand weakens further, so firms cut prices again. Meanwhile, debts grow harder to service with each turn of the cycle. Banks and local governments keep zombie firms alive—rolling over loans, protecting local champions—which keeps overcapacity entrenched. The debt-deflation spiral feeds on itself. Donald Trump’s tariffs last year made the situation worse, closing off a critical export market and confronting Chinese firms with a grim choice: slash prices to find buyers outside the United States, or transship goods through third countries to reach America anyway. Either path squeezes margins further. Over a quarter of listed Chinese companies are now unprofitable, the highest share in 25 years. 

To read the full risk, download the report.

RBC Thought Leadership

An over-correction to the recent surge in irregular immigration is squeezing employers, hammering colleges and universities, and threatening to delay a new wave of resource projects and infrastructure builds—at the same time as Canada is nearing a demographic cliff.

Canadian public and political sentiment toward immigration is increasingly negative. But the sentiment is running contrary to the country’s needs: Canada’s aging population is facing declining fertility rates, leaving immigration central to the expansion of the skilled workforce. Cutting back on immigration drastically could lead to a rapid dip in population, hurting efforts to maintain living standards, drive economic and business activity and meet near-term economic ambitions.

The Mark Carney government’s plan to clamp down on immigration comes after years of expansionary policy. Temporary residents increased beyond capacity during Justin Trudeau’s decade-long tenure that began in 2015. Housing infrastructure and community services were overloaded, and productivity declined as temporary low-wage workers removed the incentive from some businesses to invest in technology, training or equipment. Targets for new temporary residents, including students, are down by over 550,000 in 2026 compared to 2024. And permanent resident targets are down by over 100,000 from 2024 admissions. Even with these reductions, Canadians feel immigration levels are too high.   

Read the full risk here.

Eurasia Group

AI Eats Its Users

Under pressure to generate revenue and unconstrained by guardrails, a number of leading AI companies will adopt business models in 2026 that threaten social and political stability—following social media’s destructive playbook, only faster and at greater scale.

We remain bullish on AI’s revolutionary potential. Today’s frontier models reason through complex problems, show their work, and are embedded in coding, research, and knowledge workflows. The hyperscalers are offloading large chunks of software development to AI, accelerating their own R&D cycles. In biotech and materials science, AI is opening new research pathways—though commercial breakthroughs remain mostly ahead of us. Hundreds of millions of people now use chatbots daily for everything from drafting emails to debugging code and learning new skills. This is real, and it’s just the beginning.

But AI can’t live up to investors’ expectations in the short term. Even after hundreds of billions of dollars of investment, the most advanced models still hallucinate. Their capabilities are jagged: dazzling at some tasks, unreliable at others (and often unpredictably so). That inconsistency makes them hard to deploy in high-stakes applications where errors are costly. Business adoption has been uneven, with only about 10% of U.S. firms using AI to produce goods and services, according to the Census Bureau. Many companies report significant productivity gains, but surveys suggest most have yet to see meaningful bottom-line impact. Real productivity increases will arrive through wide diffusion of the technology across the economy, but that takes time. Yet markets have priced in revolution, not evolution.

To read the full risk, download the report.

RBC Thought Leadership

Canada’s economic prospects are threatened not just by external shocks and demanding neighbours; they’re up against a deepening asymmetry of federalism that makes a unified economic strategy harder to design, sell, and implement.

Different views among Ottawa, the provinces, and Indigenous governments over how to use natural resources, fund and deliver education, and stabilize a strained health-care system are pulling Canada further toward a patchwork of policy regimes just as it confronts tough trade talks with a more transactional United States and intensifying global competition. Constitutional tools that were once seen as last resorts—the notwithstanding clause, aggressive jurisdictional challenges, demands for exemptions from national regulations and standards, even provincial votes on autonomy—are becoming more commonplace, raising the odds that provinces and Indigenous groups will weaponize hard and soft vetoes on national priorities. One Canada, maybe, but many nations within.

The consequences for national unity are more serious than at any point since the 1990s because fragmentation now comes with cheerleaders and sponsors abroad. A divided global order gives foreign governments, activist networks, and corporate actors more opportunities to exploit jurisdictional tensions, whether by privileging particular provinces in supply-chain decisions, funding litigation and media campaigns around resource projects, or amplifying separatist narratives. For geopolitical rivals, anything that weakens Canada’s coherence as a U.S. ally and G7 partner could even become a feature, not a bug, as sub-national players and Indigenous rights-holders seek to express their voices more assertively over energy, climate, industrial policy, internal trade and, most critically, bilateral trade with the U.S.

Read the full risk here.

Eurasia Group

Zombie USMCA

North American trade will be stuck in limbo in 2026. The United States-Mexico-Canada Agreement (USMCA) won’t be extended, updated, or killed. It will stagger on as a zombie, keeping businesses and governments guessing while President Donald Trump continues negotiations with America’s two largest trading partners.

The agreement is up for its mandated review this year, when the parties can extend it for an additional 16 years. But Trump wants to avoid the constraints of a new trilateral deal so he can keep using bilateral leverage to squeeze economic and political concessions from both countries. Canada already scrapped its digital services tax. Mexico is imposing tariffs on China. Both are cracking down on fentanyl flows. Washington gave up nothing in return. Why lock into an agreement when the current approach keeps delivering for the U.S. president? Neither Canada nor Mexico can afford to walk away. The United States is the destination for roughly 75% of Canadian exports and 80% of Mexican exports. Trump holds most of the cards and he knows it.  

The result will be a “zombie USMCA” that is neither fully dead nor alive—and a North American trade zone buffeted by chronic uncertainty. 

To read the full risk, download the report.

Download the Report

This is a part of RBC Thought Leadership and Eurasia Group’s joint report

Canada is looking to build its military, develop an industrial base and forge new commercial partnerships at a wartime pace. A failure to execute could lead to others, notably the U.S., stepping in.

Canada’s enthusiasm for rapid militarization began the moment Donald Trump demanded more from America’s NATO allies and deepened as he mused about taking over parts of the Western Hemisphere, from Panama to Greenland, even putting the idea of Canada as the 51st state on the table. For Canadians, the exercise was initially a budgetary one, finding ways to allocate tens of billions to its small and often overlooked military. But when Trump sent the U.S. military into Venezuela, the warning for Canada and its armed forces took on a sharper focus. Borders are no longer gates. They’re hard lines that need to be defended.

For Canada, the task of building a big military—the biggest since the Second World War—is daunting. In war, extraordinary measures like state-run supply chains can be implemented quickly. In peacetime, each step needs more negotiation—that’s made even harder with a public that barely remembers the losses of the Afghan mission and a military bureaucracy that has struggled with much smaller magnitudes of procurement and deployment. The industrial base is a further challenge. Mention the words “military-industrial complex” and most Canadians will say “no, thanks.” Before Trump returned to power, Canada ranked 27th out of 31 NATO nations when it came to military spending as a share of GDP. In fact, defence spending had languished for the past 25 years at levels well below the late 20th century averages. Military enrolment has also been in terminal decline, with less than two service members for every 1,000 people. Even peacekeeping has declined to a few dozen blue helmets.

The Mark Carney government has taken the challenge head on. Its first budget injected $81.1 billion over five years. Now, Ottawa is trying to reduce the heavy concentration it spends in the United States, taking gunboat diplomacy in a very different direction: its ministers have travelled the world in search of equipment like submarines, and much more, from any ally other than the U.S. Relations with Japan and Germany have been transformed by the idea of peacetime rearmament. Same with South Korea and Sweden.

But now comes the hard part: making choices. Ottawa will inevitably irk an ally, and may very well irk its own military brass, by choosing boats, planes and weapons that aren’t as effective, on the battlefield or the balance sheet, as those American options. The challenge of “interoperability” is even greater if the Canadian military is to continue to share responsibility with the U.S. for the defence of North America. Currently, 100% of Canada’s fighter aircraft, 91% of helicopters, and more than 75% of other mission aircraft originate from the U.S. If the U.S. feels Canada’s non-American equipment isn’t up to the task of defending the Arctic or, for that matter, the North Atlantic, they may just do it themselves, even if it means torpedoing Canada’s sovereignty.

The vast web of red tape in Canada’s defence procurement system—and a bureaucracy trained to say “maybe”—has contributed to draining the private sector of much of its entrepreneurial flex. In recent budgets, fully a quarter of the Industrial and Technology Benefits Policy, or $15.3 billion, was listed as unallocated, due to deployment frictions, certification gates and poor definitions. Even the government admits it takes 15-plus years for a major fleet acquisition. And a recent study found that $18.5 billion in planned capital went unspent over a five-year period. A new ‘Buy Canadian’ military mandate may lead to, at least in the short term, more dollars chasing fewer producers. But greater cyber-security requirements—and a lot of the new spend will go to cyber defence—stands to cause further delays.

To break through that bureaucratic blockade and boost military spending at home, the Carney team opened a new Defence Investment Agency to do something soldiers are trained to do on the battlefield but is less common in government: move fast. The new money hasn’t even started to flow at speed or scale, and regions are insisting on their share, whether in the national interest or not. This will inevitably lead to lower efficiencies and higher costs, even if it does create more jobs for Canadians. It will also challenge Canada to be competitive in the growing global arms market, as it seeks to trade with allies in Europe and Asia—but will need scale and excellence to meet their standards.

Of course, missing in these equations is the sort of private capital that has helped the U.S. military-industrial complex grow. That new kind of military capitalism will be novel for many Canadian operators, and the military. Canada is seeking to play a leading role in the nascent Defence, Security and Resilience Bank—a kind of World Bank for NATO and its allies—which will draw on the strengths of members’ balance sheets to help them borrow on capital markets to finance their own budgets and supply chains. The government’s financial institutions, such as the Business Development Bank and Export Development Canada, will need to play an even greater role in helping small- and medium-sized Canadian businesses raise the capital needed to serve the so-called “primes”—or prime contractors—that sit at the top of every supply chain.

Canada’s defence industrial base includes about 600 firms—compared to 60,000 in the U.S.—and most employ fewer than 250. Those small but mighty Canadian firms have an equally small capital base. Many have been lucky to survive through the demand shocks of various governments and militaries announcing programs and then delaying them, or even shutting them down. Adding to the challenge is the fact that half of Canada’s military exports go to the U.S., which may decide to close the door if Canada snubs the big American primes. A more hidden risk for Canadian SMEs is entanglement. The IP in a complex defence product is often controlled by large operators, usually multinationals, that can shut down a small supplier.

Generals, and their political masters, love their toys, which is why so many photo ops are with big hulks of steel and not small groups of men and women doing the work behind the machines. Still, more of those people will be needed—but are harder to find. Canada’s military employs only 0.38% of the national labour force—down from 0.56% a decade ago, and well below Britain (0.58%), Australia (0.60%) and the U.S. (1.69%). The Canadian military, which has struggled to get close to 100,000 personnel, may need to double or triple in size in the next decade. And it’s not just fighter pilots and combat soldiers. It’s base operators in the Far North and cyber coders across the south. Currently, the Canadian Armed Forces (CAF) is roughly 15,000 members short of its intended size, creating persistent readiness and sustainment gaps. A lack of speed is to blame. Median recruiting timelines are upwards of 271 days, more than double the official target. The delays are sometimes greater for Canada’s large immigrant population, which needs to undergo an even longer security clearance. It’s no wonder more than half the young Canadians who apply ultimately pull out. And then there’s the hurdle of training. The CAF’s training centres are running at 80% capacity due to a shortage of instructors. That pressure may only grow as the military becomes more STEM-driven. The defence sector is 2.5 times as STEM intensive as general manufacturing.

Remilitarization is central to Canada’s effort to carve out a new relevance in the world, especially to allies, old and new. Even before Trump’s second term began, Canada was significantly growing its military participation in eastern Europe in response to the Russian invasion of Ukraine. The Canadian deployment in Latvia is one of Canada’s biggest peacetime missions anywhere and seen in Europe as a meaningful commitment to the continent’s defence. A growing Canadian military may also play a role in defending the Caribbean from drug cartels, as well as unrest in places like Haiti. And, of course, it will define itself once again in the Arctic, on land, in the air, under the ice—and overhead in low orbit, where the next battlefields may play out.

A more sophisticated and better capitalized defence industry—and a more dynamic armed forces—may even help shape the next chapter of Canada-U.S. relations. As partners, not rivals, in taking on the greater threats of China, Russia and Iran. The Great White North’s geographic sanctuary has long been a blessing. Any loss of that sanctuary will challenge the country anew. But for those Canadians who study their history, the role of conflict—present and hidden—has never been far from sight.

Download the Report

This is a part of RBC Thought Leadership and Eurasia Group’s joint report

Canada is aiming to double non-U.S. exports through two of its biggest trade antagonists, China and India, even as Canadian investment continues to pour into the United States.

Since Mark Carney launched his “elbows up” campaign to get the country to trade more with the rest of the world, and with each other, Canadians have spent and invested more in the United States, even as Americans are doing less in Canada. The strong U.S. economy, and tax breaks under the Big Beautiful Bill, have reinforced the attractiveness of the world’s largest market for Canadian investors. From pension funds to mutual funds, more Canadian dollars than ever have headed south. Business investment has done the same. Carney may need to do even more on taxes and regulations to keep Canadian investments at home.

For all the bark, and bite, of tariffs, Canadian consumers have been slow to change habits, too. Highly visible brands like Tennessee whiskey were perhaps an easy early target. Florida and Arizona vacations have taken a hit, too. But in large measure, Canadians are still watching Netflix, buying Fords and drinking Coke at the same rate as before the trade war.

A couple of generations ago, in the Trudeau 1 era, when Canada was trying to shift away from a Vietnam-era America, similar tensions reverberated through Canadian living rooms, and board rooms. The proverbial U.S. elephant and Canadian mouse was about more than sneezes and colds; it was about dependencies (plural) in the economy, culture and ultimately sovereignty. A new approach emerged to the binary option of dependence versus independence, known as the Third Option in which Canada would become more closely tied with a reconstructed Europe, a re-emerging Asia and a resurgent Third World.

Back then, there was strong concern about Canada as a branch plant economy—meaning American branch plants. But 50 years on, instead of playing from a position of strength, Canada’s search for new global alliances comes at a moment of maximum dependence on, and maximum uncertainty about, the United States. That dependency has been built over the past century through defence and deterrence partnerships like the North American Aerospace Defense Command (NORAD), trade and investment cooperation and, for Canada, a profile that rested on being the ally most like—but not—America. Now, the central risk is not that Canada will suddenly “break” with its neighbour and ally but that attempts to diversify away from U.S. power will expose how little hard leverage Ottawa has with other partners—and how quickly a more transactional White House can weaponize asymmetry in defence, intelligence, and trade. Geography still is destiny.

Canada’s struggle for more independence starts with the economy. The impact of Trump’s tariffs has included the loss off tens of thousands of manufacturing jobs, and body blows to the auto, steel and lumber sectors and regions that depend on them. If those tariffs are sustained, most projections suggest a prolonged period of slow growth for the economy, which will further erode Canada’s relevance on the world stage. The Trump tariffs were felt quickly and deeply, driving down Canada’s overall exports by close to 10% by mid-2025.

Compounding the challenge of dependence, while Canada’s trade deficit with the U.S. is worsening, its investment surplus is growing. The first year of the trade war made Canadians even more keen to invest in the U.S., despite the bourbon boycotts. Canadians injected $61 billion in U.S. securities in the first half of 2025. The country’s biggest pension fund, the Canada Pension Plan, had raised its share of all investments in the U.S. from 35% at the start of the decade to 47% in 2025.

After decades of Canadian exports gravitating to the U.S., business is starting to find opportunities elsewhere. Britain is buying more unwrought gold as investors and central banks look for alternatives to the U.S. dollar. The rest of Europe has been buying more Canadian canola, aluminum, and oil. China is also buying more oil from Canada, thanks to the Trans Mountain pipeline expansion that fuelled an all-time high, in October 2025, of oil shipments outside North America. Even faraway Singapore and Indonesia saw a surge in Canadian sales, from oil to coal to potassium chloride.  

Those successes speak to Carney’s pledge to double exports to non-U.S. markets by 2035. To accelerate the early trend, the Carney government is focussed in 2026 on forging closer trade ties with China and India. The federal government also launched consultations on trade talks with several countries, including the United Arab Emirates, Qatar, Saudi Arabia. And the first Carney budget pledged $159 million over three years for trade-financing programs to assist firms trying to enter and grow in new markets. It will need to do a lot more to unglue the infrastructure bottlenecks that have made Canadian ports among the least efficient in the industrialized world. 

To gain leverage in more overseas markets, Canada will need to do more to enhance its relevance to those countries—especially in countries and markets, like China, India and even continental Europe, that have a history of hitting Canada with non-tariff trade measures when a point needs to be made. That won’t be easy. As global power has shifted to Asia and as Europe and the Middle East rearm and realign, Canada’s relative salience has eroded. The risk is not outright exclusion from clubs, but quiet marginalization in the working coalitions that matter most for security, technology, and industrial policy—and ultimately trade. Consider Ottawa’s Indo-Pacific Strategy and its deepening security partnership with the Philippines—politically effective, yet not enough to deliver big trade breakthroughs in a region where Japan, Australia, India, and ASEAN states look first to Washington, Beijing, and each other. In Europe, Canada’s big contributions to helping defend Latvia, and a more assertive defence of the Arctic, is buying credibility. Closer to home, in the Caribbean, commitments to helping restore order in Haiti, while important and appreciated, aren’t transforming Canada’s place in the region. 

Too often, these allies calibrate their engagement with Canada through the lens of Trump-era conditionality on NATO and trade. Ottawa is seen as tightly bound to U.S. markets and security but slow to invest in capabilities, enforcement, and industrial scale. To carve out a more independent and ambitious role in the world, Canada can build on some of the alliances and networks it’s already part of. Take the Arctic Council, a group of regional players and powers that focuses on soft issues like science and environmental protection. Canada can deepen ties with Scandinavians and perhaps one day re-engage with Russia through those non-military efforts, while also building up military capacity in the region with like-minded allies like Sweden. It cuts to the new (and old) ethos of foreign policy being rooted in interests, not values.

A very different approach could be taken to the Francophonie and Commonwealth, if other members are willing to muscle up, especially with money. In Africa, for instance, where France’s image has deteriorated, Canada can work with francophone partners to strengthen non-military defences against a resurgent ISIS in the Sahel. The Commonwealth can play its own pragmatic role, helping build trade bridges from Australia to India to South Africa while the U.S. doubles down on America First. More military commitments will be needed, too, as the U.S. pulls back from volatile regions and countries. Haiti crystallizes the risk. A Kenya-led mission with UN authority and rising pressure from the Organization of American States gives Canada a chance to be the training and standards hub for Caribbean contributors, focusing on ports, fuel logistics, and basic state functions—and perhaps with difficulty for Canadians to look the other way if the U.S. shows up in the dead of night to take out gangs or shut down migrant rings.

One of the biggest plays for Canada in gaining more leverage may be AUKUS—the security alliance of Australia, U.K. and U.S. The trilateral pact has focussed initially on nuclear submarines—not a Canadian strength—and is now widening its aperture to advanced capabilities, including undersea sensing, low-orbit satellites, and cyber defences, all of which are Canadian strengths. Canada can pitch itself as a serious member for the next stage of the alliance, which would build leverage overseas while also maintaining a respectful and relevant partnership with the U.S.

The year ahead will present plenty of opportunities to explore this sort of realpolitik diplomacy, as Canada helps design or join more strategic approaches based on interests more than values, and pragmatism more than principles. This will be a step back from those more idealistic approaches that emerged in that earlier time of Third Options. But as every nation knows, independence has a price.

Download the Report

This is a part of RBC Thought Leadership and Eurasia Group’s joint report

A shift in global oil and gas prospects, from Venezuela to Qatar, changes the investment outlook for Albertan exports—and the big infrastructure projects designed to get them to overseas markets.

Canada’s ambitions to be an energy superpower—including oil and gas—is being tested after the U.S. intervention in Venezuela. But the challenges lie well beyond Canada’s immediate neighbourhood. Long-term demand for oil and gas remains an open question, especially as Asia continues to turn to electrons to power growth. A global surplus of supply, including American LNG, clouds the picture further. And then there’s the question of global growth. No growth, no need for more energy, from Canada or anywhere else.

In one strategic swoop in Caracas, U.S. President Donald Trump has attempted to ringfence the Americas with Washington as its most consequential capital. In that respect, Trump may have weakened Canada’s most valuable negotiating card—energy exports. A resurgent Venezuela crude production could displace Canadian oil in the U.S. and leave it scrambling for market share with Saudis and others elsewhere. It’s a potential competitive shock. Over the past 25 years, Canada had solidified its position as the foremost supplier of oil and gas to the world’s biggest oil market, accounting for nearly three out of every five imported barrels entering the U.S. An industry built to serve America now pumps out a record five million barrels per day, compared to just over two million bpd in 2000, with more than 90% of its exports ending up in refineries in the U.S. Midwest, West Coast and the Gulf Coast.

With the U.S. moving at lightning speed on securing its energy and resource needs, Canada needs to pivot quickly, not just to capture a portion of the investment dollars being spent in a hurry, but also to defend its turf and diversify its exports (hello, Xi)—everything all at once to match the American blitz.

Disruptions to the north-south energy flow could deal an economic and political blow to Canada. The industry generates close to $100 billion in annual revenues. A decline in energy exports could also test national unity. Failure to build out Alberta’s oilsands will be seen by the province as a national declaration of political war, at a time when the province’s independence movement is louder than it’s been in a generation. Land-locked Alberta is also at odds with neighbouring British Columbia, which is opposed to building an oil pipeline across its territory to tidewater.

Canada has a few strong cards to play. Venezuela may be home to the world’s largest proven crude oil reserves, but Canada boasts the world’s third largest, with the added advantages of a world-class infrastructure, ready expertise, technology and the capital to deliver on America’s oil needs. After decades of dithering, Ottawa, under Mark Carney, seems to have the will to follow through.

There’s a strong correlation between Canadian oil’s supremacy in the U.S. coinciding with Venezuelan crude’s steady decline (see chart). Both trade primarily in what’s known in the business as “heavy oil,” which has the consistency of peanut butter—it’s harder to extract from the ground, is energy and carbon-intensive to produce, and needs thinning diluents to push through pipelines, adding to shipping costs. Canadian oil’s viscous nature makes it ideal for making gasoline/diesel, jet fuel and plastics, compared to the light blend pumped out from American shale basins.

Canada's oilsands has displaced Mexican and Venezuelan heavy oil in the U.S.

As Canadian oilsands firms innovated over the past decade to overcome cost and emissions intensity, Venezuela’s state-owned Petróleos de Venezuela (PDVSA) fell into a state of neglect, mismanagement, and corruption. Another blow: in 2018, the company was looted by thieves, stripping the oil company of vital equipment, including copper wiring, and its skilled workers fleeing to neighbouring states. If U.S. firms return to Venezuela, they will have to start from scratch in many ways, with some suggesting it will cost upwards of US$100 billion over 10 years to get the Venezuelan oil sector up and running. In a best-case scenario, it would take at least a decade to displace some of Canada’s 4.5 million bpd of oil shipments to the U.S. from Venezuela, which currently produces around 750,000 bpd. That would give Canada a head start to adjust to the new energy paradigm.

Heavy oil is deeply integrated into U.S. refinery systems, which should give oil executives in Calgary some comfort. As early as the 1990s, U.S. refiners began investing billions in heavy-sour configurations to run Canadian and Latin American barrels, given the proximity of both energy sources. Total refining capacity in Gulf Coast refineries (known as PADD 3) rose 2.9 million barrels per day, while Midwest refineries (PADD 2) grew 700,000 bpd. Both regions boosted coker capacity of 1 million bpd during the period.

U.S.-Canadian joint ventures also started to spring up, such as Cenovus and ConocoPhillips collaborating on two refineries in the U.S. as cross-border upstream and downstream flows became entrenched. Meanwhile, Canadian pipeline operators Enbridge and South Bow (spun off from TC Energy) cast a wider system of pipeline spurs and added capacity to reach the Gulf Coast and the Midwest.

Canada’s heavy oil is prized in other markets. While much is made of China becoming an electro-state and other Asian markets switching to renewables, there are few viable substitutes for heavy oil as a critical ingredient for plastics. Rising income levels across Asia is set to fuel ever more demand for TVs, refrigerators, electronics, and Labubu dolls, even as population growth in many emerging markets tapers off. The federal government-owned TMX pipeline expansion has already demonstrated a market for Canadian oil outside the U.S. While overall more than 90% of Canadian oil exports are destined for the U.S., only a third of TMX’s shipmentsended up across the border with the rest shipped to refineries in China, Singapore, South Korea and India.

After all, Asia is where the growth’s at, especially with Europe set to see declining demand. The continent is forecast to account for 80% of total net oil demand growth until 2030, according to the IEA. Indian demand alone is expected to grow almost one million bd, with emerging Asia also in the market for more barrels.

There’s also the perennial question of the value of Canada spending billions on an industry presumed to be slowing down—in a crowded market. While the International Energy Agency recently retreated from its “peak oil” forecast, global demand is inching up only slowly while producers ramp up. New player Guyana, led by production from a three-way ExxonMobil-Chevron-CNOOC venture, has quickly boosted production to around 900,000 bpd in a short span of time. Several OPEC producers and independents such as Brazil, Mexico and Norway also have ambition to pump up oil volumes. While the Saudis, the most influential OPEC producer, have been quiet as U.S. moves threaten to drive down oil prices, Brent crude prices of around US$60 per barrel are nowhere near Saudi government’s fiscal breakeven prices of around US$90.

For Canadian oil firms, which spent roughly $25 billion in dividends and buybacks in 2025, the risk is to embark on a new capital-intensive project without a new pipeline proposal or much visibility when it comes to market direction. Another caveat: Ottawa would insist companies contribute to a much-anticipated and expensive carbon capture storage and utilization (CCUS) project to offset new emissions. Indeed, it’s in writing as part of the Ottawa-Alberta Memorandum of Understanding.

The MoU, which offers a path for the oil industry’s expansion and inject a new investment wave in the country, is an iconic symbol of what Canadian energy can achieve. If it succeeds, the MoU could serve as a model for how Canada can deliver its resources, assets and expertise to a customer base beyond the United States.

Download the Report