


 Canada - EN
Methodology
Climate Action Barometer
What’s in the index and how we calculated it
The Climate Action Barometer is an index developed by the Climate Action Institute team to track economy-wide climate action in Canada across several key drivers of change, that are described below. The index starts from year 2019, which is the baseline year and is set at 100, and all changes are relative to the baseline.
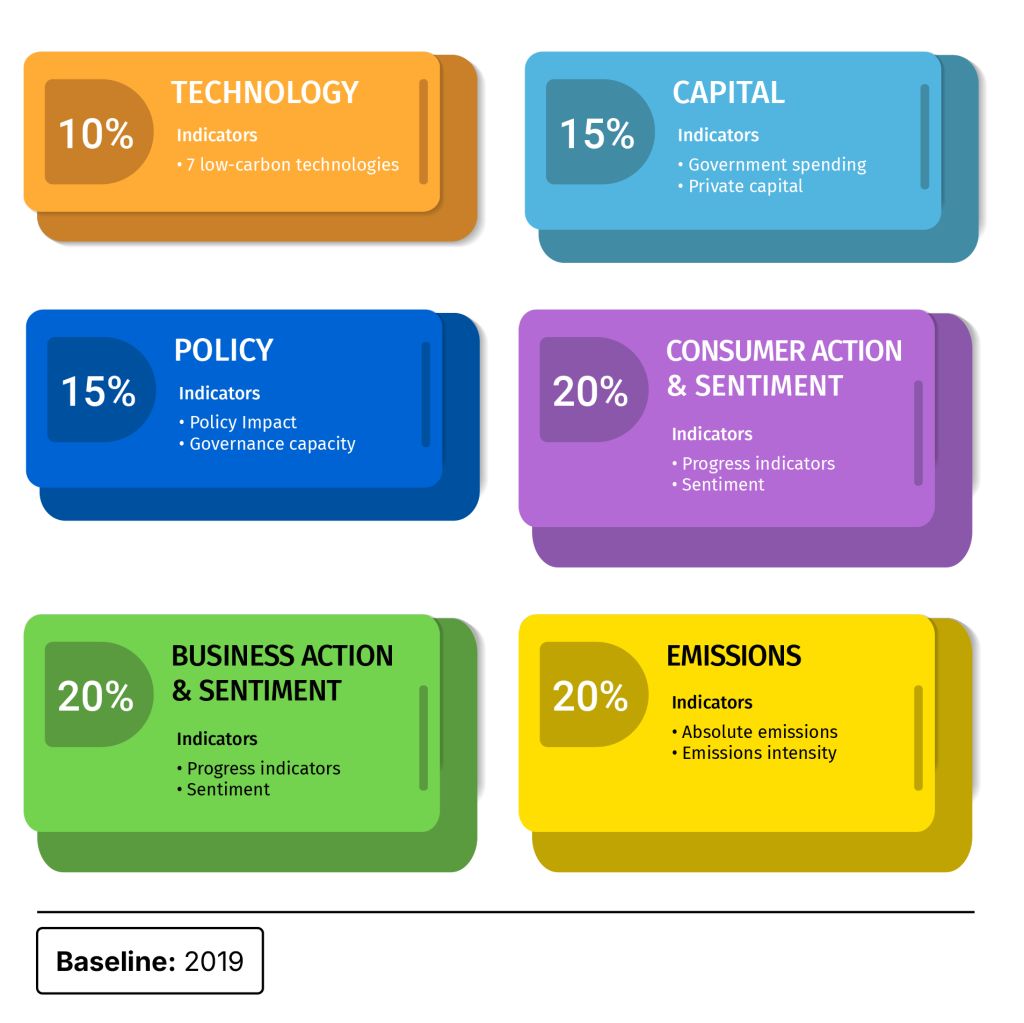
The index is constructed using progress indicators that fall into one of the six themes, described in detail below.
-
The Barometer includes six themes, each adding up to a single score with respective weights: Emissions (20%), Business Action & Sentiment (20%), Consumer Action & Sentiment (20%), Policy (15%), Capital (15%), and Technology (10%). The weighting was decided by the team.
-
All indicator values are set to 100 for the baseline year 2019, with increases in value indicating progress.
-
Time frame covered by indicators 2019-2026, or wherever latest data is available.
-
Data values used in the Barometer are from 2026. Where data for year 2026 is not available, it is estimated based on projections or annualized year-to-date data.
-
Within each theme are indicator(s) that measure progress towards decarbonization and enabling factors, such as policy, funding and sentiment. Choice of indicators was decided by the RBC Climate Action Institute team.
-
If indicators have different units of measurements, they are converted to a common unit by applying factors or combined with weights to ultimately create one score.
EMISSIONS THEME
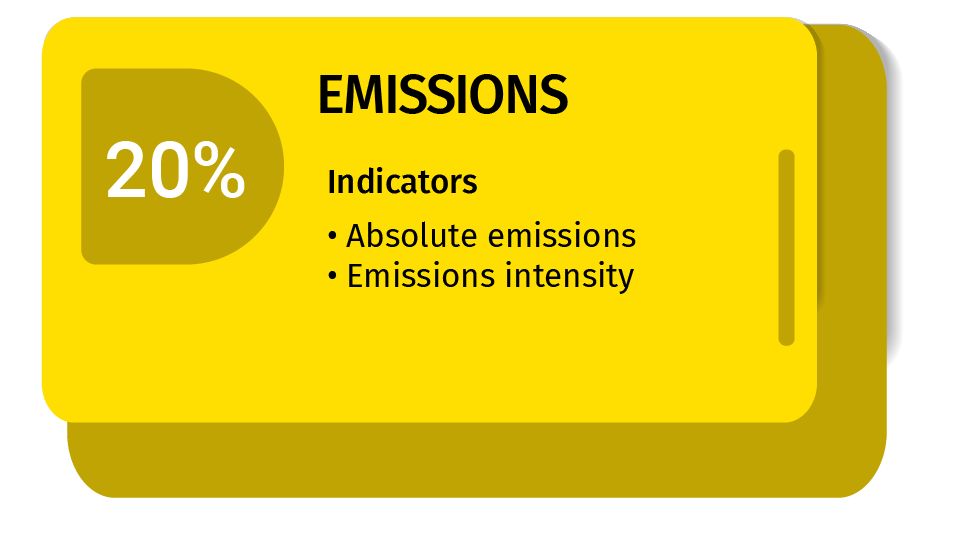
Absolute emissions:
Historical emissions values are used for the absolute emissions indicator.
The data is sourced from most recent Canada’s Official Greenhouse Gas Inventory released in April 2026, covering the period up to 2024. Reported emissions data has a two-year lag from the year when they are released.
We complement it with Environment and Climate Change Canada’s (ECCC) annual emissions projections to derive values for the years 2025 and 2026 where data is not yet reported.
We compute annual percentage changes from the ECCC projections for each sector and apply them to historical data to extend the series for the years not yet reported. Emissions projections have been informed by the Intergovernmental Panel on Climate Change (IPCC) standards and external expert views, use recent data, and apply internationally recognized energy and macroeconomic modelling framework (that incorporates ENERGY 2020 model, and Oxford Economics’ North America Economic Model), as described in Canada’s First Biennial Transparency Report under the Paris Agreement submission to United Nations Framework Convention on Climate Change (UNFCC).
Emissions intensity:
We define emissions intensity as a ratio of absolute emissions and real gross domestic product (GDP).
Absolute emissions data is as described above; and real GDP is sourced from Statistics Canada’s Table: 36-10-0434-03. For the year 2026 we use projection from RBC Economics released in June 2026.
Emissions are measured in two ways: absolute emissions and emissions intensity. Because a drop in emissions is good news, both are flipped so that a higher number means more progress. Each is then converted to an index via formula (a), and the two are combined into one score for the theme, with equal weights of 50%, via formula (b). That score is multiplied by the theme’s 25% weight in the Barometer to get its final score, via formula (c). The formulas are at the end of the document.
BUSINESS ACTION & SENTIMENT THEME
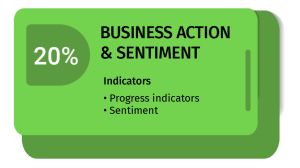
Progress indicators:
Following actions have been selected by the Climate Action Institute as progress indicators towards decarbonization, that captures primary technology/practice choices, within the business sector. We use the following technology/practice to track progress: wind and solar deployment, carbon capture, utilization and storage (CCUS) usage, carbon sequestration in the agriculture sector, and electrification of commercial transport.
Due to difference in measurement units, we attempt to convert all values to a common unit and then aggregate into a single value. We estimate how much each technology or practice could reduce emissions converting to tonnes of CO2 equivalent units where needed.
Data sources and how it is measured:
-
Wind and solar deployment: sourced from BloombergNEF’s Global Power Capacity database. The database includes both historical data and forecast in megawatt units. For each year of the indicator, we record difference from the previous year, which constitutes net new capacity addition. To convert units, we assume that wind and solar power avoid the same emissions that natural gas power would have produced. Based on data from Canada’s Official Greenhouse Gas Inventory (Table: A7-1), we derive the emissions intensity per MWh as the ratio of electricity generated from natural gas to emissions associated with it – resulting in ~470 ktCO2e per MWh. We also assume 30% and 10% utilization factor for wind and solar, respectively, based on electricity generation and installed capacity from Statistics Canada tables 25-10-0015-01 and 25-10-0022-01.
-
Carbon capture, utilization and storage (CCUS): sourced from Quest Carbon Capture and Storage project annual reports. Annual total mass injection of CO2 is recorded for respective years. For the years where reporting is not yet available, we extend the latest year’s value. The unit for the indicator requires no conversion.
-
Carbon sequestration: sourced from Canada’s Official Greenhouse Gas Inventory (Table: 6-9). Each year of the Barometer, we record the annual change in ‘C’ inputs from change in tillage. The unit is in CO2e and requires no conversion.
-
Electrification of commercial transport: sourced from BloombergNEF’s Long-Term Electric Vehicle Outlook dataset. The commercial electric vehicles sales are converted from unit of sales to the common unit of emissions abated using an estimate of 10 ktCO2e per vehicle from Pembina Institute’s fact sheet.
Progress across the technologies/practices are summed to get a value for the indicator. The total value for the progress indicator is indexed via formula (a).
Sentiment:
Business sentiment indicator is based on (1) RBC Climate Action Institute business surveys to assess sentiment based on a sample of business leaders’ responses towards their emissions targets progress and (2) data from Bloomberg on emissions target setting:
(1) RBC Climate Action Institute business surveys ask corporate leaders about their agreement level from ‘strongly disagree’ to ‘strongly agree’ with the following statement: “My organization will achieve its emissions reduction targets by 2030”. For each year of the surveys, we record the share of those who respond, ‘strongly agree’ and ‘agree’, and combine them using 75% and 25% weight.
(2) From Bloomberg, starting from the baseline year 2019 and each subsequent year, we record the share of S&P/TSX Composite Index constituents that claim net-zero target or report an emissions target to Climate Disclosure Project (CDP).
The steps above result in two data series – survey results from (1) and net-zero target claims from (2) – which are the combined to create a measure for overall sentiment tracking. To combine these, we first convert them into an index (formula a), then averaged into one score for the indicator (formula b), with each counting for 50% each.
The resulting indexed values for the progress and sentiment indicators are combined into total score for the theme via formula (b) using following weights – 75% for progress and 25% for sentiment. Resulting value is then multiplied by its scorecard contribution factor (25%). This results in the final score for the theme. Formula (c) is used to aggregate all final thematic scores into total score for the Barometer. Refer to formulas for details.
CONSUMER ACTION & SENTIMENT THEME
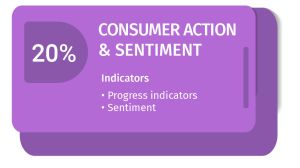
Progress indicators:
Following actions have been selected by the Climate Action Institute as progress indicators towards decarbonization, that attempts at capturing main technology/practice choices, related to consumers: electric vehicles adoption and heat pump sales.
Due to difference in measurement units, we attempt to convert all values to a common unit and then aggregate into a single value. We estimate a potential emissions abatement for each technology and convert to units of emissions abated, for example an electric vehicle saves on emissions that otherwise would have been generated by a gas-powered vehicle.
Data sources and how it is measured:
-
Electric vehicles adoption: sourced from Statistics Canada Table: 20-10-0025-01. Quarterly data is summed to derive annual value. For the latest year, where full annual data is not yet available, BloombergNEF’s projection from Long-Term Electric Vehicle Outlook dataset is used. The engine type coverage is for battery, plug-in and hybrid electric vehicles. For passenger vehicles segment, we use ratio of total ICE vehicle fleet to emissions to derive per vehicle emissions intensity which it used as a proxy for the emissions abatement per vehicle.
-
Full value of emissions abatement is applied to battery electric vehicles.
-
For plug-in electric vehicles, we assume they are driven 50% the time powered by electricity, therefore, 40% of the emissions abatement is applied.
-
For hybrid electric vehicles, we assumed 25% emissions abatement.
-
-
Heat pump sales: sourced from Heating, Refrigeration and Air Conditioning Institute of Canada’s quarterly statistics on shipments as a proxy. We use combined shipments of ductless split systems (assuming 85% are heat pumps) and central heat pump systems. Emissions abatement is based estimates on emissions saving from Canadian Climate Institute’s online calculator for heat pumps. We take an average across all building types and vintages
Electric vehicle adoption and heat pump sales values are multiplied by the respective emission abatement proxies, and summed to get a value for the indicator.
The total value for the progress indicator is indexed via formula (a).
Sentiment:
Consumer sentiment indicator is based on results of a third-party survey by Ipsos of 2,000 Canadians, conducted quarterly. The question used for measuring sentiment asks Canadians to rank various economic and social issues facing Canada. For each year, we record the share of respondents that rank ‘climate change/environment’ among top 3 issues.
The total value for the sentiment indicator is indexed via formula (a).
The resulting indexed values for the progress and sentiment indicators are combined into total score for the theme via formula (b) using following weights – 75% for progress and 25% for sentiment. Resulting value is then multiplied by its scorecard contribution factor (25%). This results in the final score for the theme. Formula (c) is used to aggregate all final thematic scores into total score for the Barometer. Refer to formulas for details.
POLICY THEME
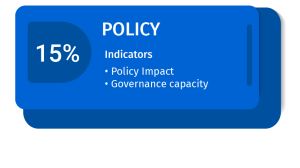
Policy impact:
Based on the Environment and Climate Change Canada’s (ECCC) annual emissions projections.
We use emissions projections (under 2 scenarios specified below) relative to the historical emissions values to gauge the impact of policies.
For each year of the indicator, we obtain the following from the latest available release from ECCC: (1) the historical emissions reported for 2019, (2) projected emissions values for 2035 under the ‘Reference Case’ scenario and (3) and projected emissions value for 2035 under the ‘Additional Measures’ scenario.
With the data collected above, for each year, we compute the following differences to create two data series: (2) minus (1), and (3) minus (1). Resulting data series are averaged, and constitute the final value of the indicator.
Emissions projections have been informed by the Intergovernmental Panel on Climate Change (IPCC) standards and external expert views, use recent data, and apply internationally recognized energy and macroeconomic modelling framework (that incorporates ENERGY 2020 model, and Oxford Economics’ North America Economic Model), as described in Canada’s First Biennial Transparency Report under the Paris Agreement submission to United Nations Framework Convention on Climate Change (UNFCC).
For the years where projections did not cover 2035, we used 5-year average year-over-year change to extend the projections.
Governance capacity:
This indicator assesses whether the governance system in each sector where government policies are introduced is conducive to enabling climate action.
This governance indicator is adapted from the OECD’s governing for a green transition framework for the following economic sectors: oil and gas, transportation, heavy industry, buildings, agriculture, electricity.
The Climate Action Institute team evaluated the following government practices:
-
Long-term strategy: A sector strategy to inform and align policy and action direction towards a common decarbonization vision.
-
Whole of government: All relevant departments and agencies are engaged and have a working framework to coordinate resources, policies and actions.
-
Monitoring & measuring outcomes: A system is in place to track progress against decarbonization pathways and/or targets in the sector.
-
Independent oversight: There is a governing body that provides objective reviews on sector progress in climate action.
-
Policy innovation & foresight: There is evidence of novel or advanced policy development that puts the sector on a robust decarbonization path.
-
Enabling regulatory framework: Legislation in place is conducive for sector decarbonization.
-
Enabling markets: Market conditions and dynamics are conducive for sector decarbonization.
-
Sufficient budget: There is sufficient government spending committed to deliver on the sector’s decarbonization path.
-
Enabling procurement: Government procurement and procurement policy for the sector is conducive for sector decarbonization.
-
Sector skills: Training and talent acquisition is aligned to the skills and expertise required for sector decarbonization.
Based on available information and their knowledge of the sector, the team evaluated each practice every year, from low to high: where low (0-3) means the indicator does not exist, is in early development stages, or in poor state; medium (4-7) suggests that the indicator exists and there is some evidence of positive impact; and high (8-9) shows the indicator exists and there is strong evidence of positive impact. Then the scores are summed to get a total value for the indicators in respective year.
Evaluations across the sectors are summed to derive the final value for the indicator.
The indicators are then indexed via formula (a) and combined into total score for the theme via formula (b) using equal weights – 50% for each. Resulting value is then multiplied by its scorecard contribution factor (25%). This results in the final score for the theme. Formula (c) is used to aggregate all final thematic scores into total score for the Barometer. Refer to formulas for details.
CAPITAL THEME
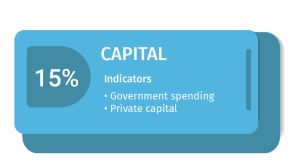
Government spending:
-
For public spending, we track climate-related funding and expenditures announced in the budgets of the federal government and the four largest provinces—British Columbia, Alberta, Ontario and Quebec.
-
These include transfer payments, program spending, tax expenditures, and selected public financing that cover announced plans towards climate- and environment-related initiatives focused on decarbonization, innovation, energy efficiency, fuel switching, and low-carbon technology manufacturing and deployment, skills, research and planning.
-
We spread each program’s total expenditure amount evenly over the program’s timeframe announced in the budgets. For example, a $500 million program announced to run from 2021 to 2025 is counted as $100 per year.
-
We do not include Clean Economy Investment Tax Credits from public spending to avoid double accounting as these are likely captured in private capital deployment.
Private capital:
-
-
Private capital tracks investments in the low-carbon energy transition, covering a wide scope of sectors central to the transition, from renewables and energy storage to hydrogen, CCUS and electrified transport.
-
It is sourced from BloombergNEF’s Energy Transition Investment Trends database.
-
Data is updated annually, typically in January of each year, with mid-year updates available for renewable energy investments. For the latest year where data has not yet been released, we applied the average of the previous 3-year period and included estimates from the mid-year update for renewable energy if available.
-
The dollar values of both indicators are summed.
To align with sectoral scorecards outlined in Sector Methodology, we adjust the dollar amounts to be relative to the total capital required to achieve a net-zero transition. This step is done through formulas (d) and (e). The total capital requirement is determined in The $2 Trillion Transition: Canada’s road to net-zero report.
The theme score construction follows formula (a) for indexing the indicator. Resulting value is then multiplied by its scorecard contribution factor (25%). Then we apply the scaling factor as descried in formulas (d) and (e). This results in the final score for the theme. Formula (c) is used to aggregate all final thematic scores into total Sector scores. Refer to formulas for details.
TECHNOLOGY THEME
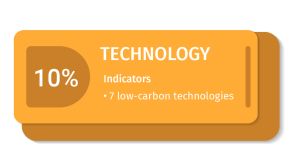
Indicators:
The Technology score tracks the adoption readiness of the major anticipated technologies determined by the Climate Action Institute: carbon capture, storage and utilization (CCUS), direct air capture, hydrogen, geothermal, small modular nuclear reactors, utility scale batteries and anerobic digestors.
Each technology is considered/referred as an indicator.
In evaluating the adoption readiness of various technologies, we used a similar approach to the U.S. Department of Energy’s Adoption Readiness Assessment (version: April 2025).
Our research team selected eight criteria: (1) cost, (2) development stage, (3) infrastructure, (4) technological maturity, (5) supply chains, (6) regulatory environment, (7) market opportunity, and (8) market competitiveness–that are aimed at illustrating the viable ecosystem for the commercial deployment of the technology through market forces.
Our research team evaluated each technology and practice, based on their knowledge and available information, across the above criteria on a 1 to 4 scoring scale, where the lowest score (1) is meant to illustrate the following:
-
Cost: no pricing signal;
-
Development stage: primarily R&D development stage;
-
Infrastructure: no available infrastructure for deployment;
-
Technological maturity: lowest/no score by Global Technology Readiness Level from Energy Technology Perspectives published by the International Energy Agency;
-
Supply chains: no upstream or downstream value chains;
-
Regulatory environment: no regulations or environment;
-
Market opportunity: lack of target market;
-
Market competitiveness: limited viability and only via government support.
Below is an example of each score for ‘cost’ criteria, for illustrative purposes:
-
1: Cost level continues to fluctuate with no benchmark level;
-
2: Technology reached a benchmark cost level, which is substantially higher than alternatives;
-
3: Technology cost exhibits a declining trajectory;
-
4: Technology is cost competitive with alternatives.
We apply following weight to each technology: carbon capture, storage and utilization (40%), hydrogen (25%), batteries (10%), SMR (10%), anerobic digestor (5%), geothermal (5%), direct air capture (5%). These weights are determined by the Climate Action Institute team based on our judgement of total addressable emissions pool by the given technology.
The indicators are then indexed via formula (a) and combined into total score for the theme via formula (b) using equal weights – 50% for each. Resulting value is then multiplied by its scorecard contribution factor (25%). This results in the final score for the theme. Formula (c) is used to aggregate all final thematic scores into total score for the Barometer. Refer to formulas for details.
FORMULAS
Formula (a):
Creates the starting value of an indicator in 2019 to 100. The formula adjusts subsequent years’ data relative to the 2019 baseline value. Indexing allows to level set all indicators to the same starting point, and track their relative progress. For illustrative purposes, we show how an indicator value is indexed. Assume the following: the indicator value is 195 in 2019, and 288 in 2026 (actual values of the Governance Capacity indicator within the Policy Theme), As the first step the formula sets the 2019 value at 100. All subsequent years’ values are then divided by 195 and multiplied by 100. Hence indexed indicator value for 2026 is 288/195*100 = 148.
Formula (b):
Combines indicators into a total value for a theme, using respective indicator weights.
Formula (c):
Combines themes into a total value for a scorecard, using respective theme weights.
Formula (d) and (e):
A two-step process developed by the Climate Action Institute team allow for comparability across barometer and sectoral scorecards: first step (formula d) converts the dollar amounts relative to total capital requirement; second step (formula e) uses the result from previous step to scale every year’s progress.
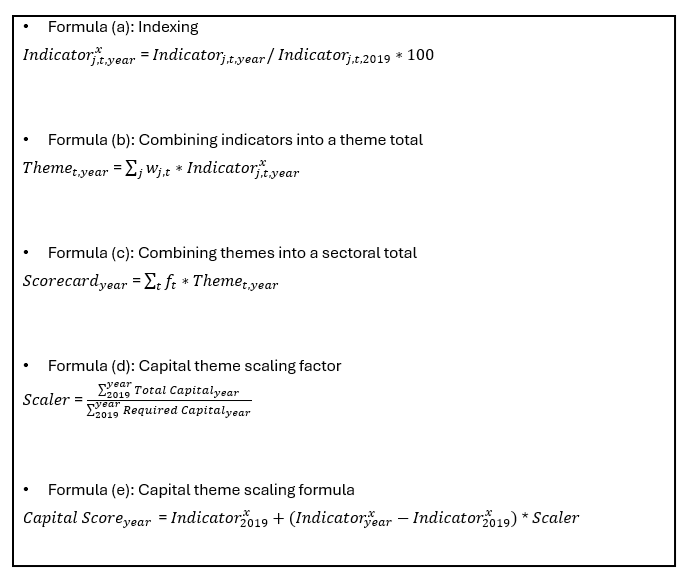
Where:
Indicatorj,t,s,year are the actual values of indicators in the period year. Where j denotes the indicator, t used for a theme, and s for a sector.
Upper script x denotes indexed value for the indicators with value for 2019 set at 100.
w are the weight for indicators.
f are themes’ scorecard contribution factors.
Total Capital in formula (d) refers to the value of the indicator as described in the ‘Capital’ section of the methodology. And Required Capital is annual spending based on ‘Two Trillion Transition’ study.
Sector Methodology
What’s in the index and how we calculated it
The Sector Scorecards are indexes developed by the Climate Action Institute team to track climate action in Canadas main economics sectors per Canada’s Official Greenhouse Gas inventory – oil and gas, transportation, electricity, heavy industry, buildings, and agriculture – across several key drivers of change, which are described below. The indexes start from year 2019, which is the baseline year and is set at 100, and all changes are relative to the baseline.
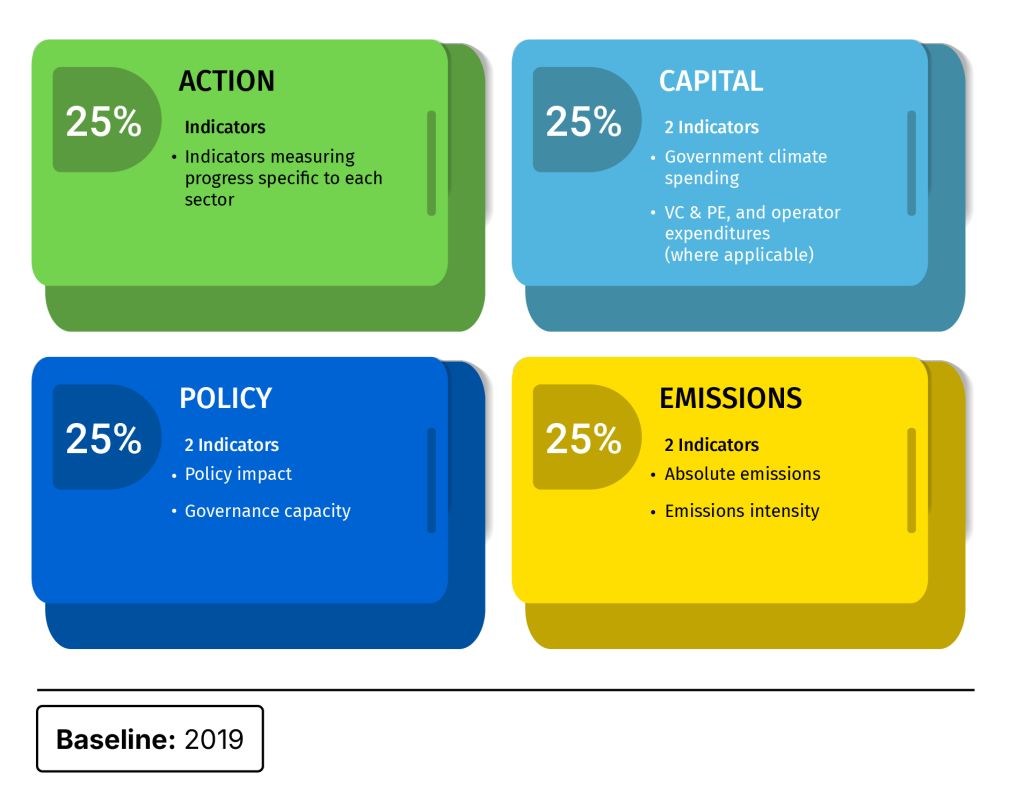
The indexes are constructed using progress indicators that fall into one of the four themes, described in detail below. The themes sum up to one Sector Scorecard for each sector, allowing for comparison of progress over time and across sectors:
-
Sectoral scorecards include four themes, each adding up to a single score with respective weights: Emissions (25%), Action (25%), Policy (25%), and Capital (25%). The weighting was decided by the team.
-
All indicator values are set to 100 for the baseline year 2019, with increases in value indicating progress.
-
Time frame covered 2019-2026, or wherever latest data is available.
-
Data values used in the Sectoral Scorecards are from 2026. Where data for year 2026 is not available, it is estimated based on projections or annualized year-to-date data.
-
Within each theme are indicator(s) that measure progress towards decarbonization and enabling factors, such as policy, funding and sentiment. Choice of indicators was decided by the RBC Climate Action Institute team.
-
If indicators have different units of measurements, they are converted to a common unit by applying factors or combined with weights to ultimately create one score.
-
Approach and calculations for Emissions, Policy and Capital themes apply equally across the six sectors, except where specified otherwise. For Action theme, we provide the approach and calculations for each sector separately.
EMISSIONS THEME
Absolute emissions:
Absolute emissions are measured using same approach across all six sectors.
Historical emissions values are used for the absolute emissions indicator.
The data is sourced from most recent Canada’s Official Greenhouse Gas Inventory released in April 2026, covering the period up to 2024. Reported emissions data has a two-year lag from the year when they are released.
We complement it with Environment and Climate Change Canada’s (ECCC) annual emissions projections to derive values for the years 2025 and 2026 where data is not yet reported.
We compute annual percentage changes from the ECCC projections for each sector and apply them to the historical data to extend the series for the years not yet reported. Emissions projections have been informed by the Intergovernmental Panel on Climate Change (IPCC) standards and external expert views, use recent data, and apply internationally recognized energy and macroeconomic modelling framework (that incorporates ENERGY 2020 model, and Oxford Economics’ North America Economic Model), as described in Canada’s First Biennial Transparency Report under the Paris Agreement submission to United Nations Framework Convention on Climate Change (UNFCC).
Emissions intensity:
-
For each year of the scorecard, we compute emissions intensity. Emissions intensity is calculated separately for each of the six sectors.
-
To compute emissions intensity, RBC Climate Action Institute team determined to take the ratio of absolute emissions and a sector specific activity measure.
-
Absolute emissions data is as described above.
-
Sector specific activity measures are determined by the Climate Action Institute team based on data availability and judgement about best representation of activity in the sectors. For example, for transportation sector, annual activity is measured by how many kilometres are driven each year. Below we list activity measures selected by the team for each of the six sectors:
-
Transportation: Total vehicle-kilometres driven annually. This data is sourced from BloombergNEF’s Long-Term Electric Vehicle Outlook dataset that covers passenger and commercial vehicles and busses.
-
Electricity: Real gross domestic product of the utilities sector (NAICS 22). This data is sourced from Statistics Canada Table 36-10-0434-06, in chained 2017 dollars. For 2026, where full annual data is not yet available, we calculate the year-over-year percentage change in monthly GDP to the latest reported month and apply it to the 2025 annual value.
-
Oil and Gas: Total annual Oil and Gas production, measured in barrels of oil equivalent. Historical data is sourced from the Canada Energy Regulator. Current year production is per RBC Capital Markets’ most recently published Canadian oil and gas production estimates.
-
Buildings: Absolute greenhouse gas emissions in the building sector (Mt CO2e) and emissions intensity by gross domestic product (GDP) of the building sector (tCO2e / $million). Data is sourced from Statistics Canada and Environment and Climate Change Canada
-
Agriculture: Emissions intensity estimates are based on primary agriculture emissions and production outputs, covering on-farm nitrous oxide, carbon dioxide, and methane emissions from both crop and animal production. Emissions intensity is measured by dividing primary agriculture emissions by national total on-farm outputs, which is “agricultural production” (i.e., crops and animals in tonnes). The data sources for the estimated emissions intensity are annual emission estimates reported by Environment and Climate Change Canada in the National GHG Inventory Report and the National GHG Emission Projections, and annual agriculture production of crops and livestock are reported by Statistics Canada.
-
Heavy Industry: Real gross domestic product of key heavy industry sub-sectors, including mining and smelting, pulp and paper, iron and steel, cement and chemicals is summed to get a single value. This data is sourced from Statistics Canada Table 36-10-0434-06, in chained 2017 dollars. For 2026, where full annual data is not yet available, we calculate the year-over-year percentage change in monthly GDP to the latest reported month and apply it to the 2025 annual value.
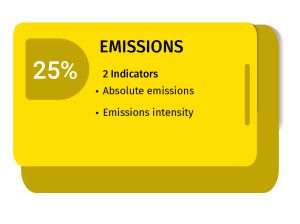
Emissions are measured two ways: absolute emissions and emissions intensity. Because a drop in emissions is good news, both are flipped so that a higher number means more progress. Each is then converted to an index via formula (a), and the two are combined into one score for the theme, with equal weights of 50%, via formula (b). This results in the final score for the theme. That score is multiplied by the theme’s 25% weight in the Sectoral Scorecards to get its final sector score, via formula (c). The formulas are at the end of the document.
POLICY THEME
Policy impact:
-
To gauge the impact of policies that have been implemented we use emissions projections into 2035.
-
For each year of the indicator, we obtain the projected emissions values for 2035 under the ‘Reference Case’ scenario from the latest available release from ECCC at the time. The projected emissions’ value for each year is then used as the indicator for each sector.
-
Data is sourced from the Environment and Climate Change Canada’s (ECCC) annual emissions projections.
-
Emissions projections have been informed by the Intergovernmental Panel on Climate Change (IPCC) standards and external expert views, use recent data, and apply internationally recognized energy and macroeconomic modelling framework (that incorporates ENERGY 2020 model, and Oxford Economics’ North America Economic Model), as described in Canada’s First Biennial Transparency Report under the Paris Agreement submission to United Nations Framework Convention on Climate Change (UNFCC).
-
For the years where projections did not cover 2035, we used 5-year average year-over-year change to extend the projections.
Governance capacity:
-
This indicator assesses whether the governance system in each sector where government policies are introduced is conducive to enabling climate action.
-
This governance indicator is adapted from the OECD’s governing for a green transition framework for the following economic sectors: oil and gas, transportation, heavy industry, buildings, agriculture, electricity.
-
The Climate Action Institute team evaluated the following government practices:
-
Long-term strategy: A sector strategy to inform and align policy and action direction towards a common decarbonization vision.
-
Whole of government: All relevant departments and agencies are engaged and have a working framework to coordinate resources, policies and actions.
-
Monitoring & measuring outcomes: A system is in place to track progress against decarbonization pathways and/or targets in the sector.
-
Independent oversight: There is a governing body that provides objective reviews on sector progress in climate action.
-
Policy innovation & foresight: There is evidence of novel or advanced policy development that puts the sector on a robust decarbonization path.
-
Enabling regulatory framework: Legislation in place is conducive for sector decarbonization.
-
Enabling markets: Market conditions and dynamics are conducive for sector decarbonization.
-
Sufficient budget: There is sufficient government spending committed to deliver on the sector’s decarbonization path.
-
Enabling procurement: Government procurement and procurement policy for the sector is conducive for sector decarbonization.
-
Sector skills: Training and talent acquisition is aligned to the skills and expertise required for sector decarbonization.
-
Based on available information and their knowledge of the sector, the team evaluated each practice every year, from low to high: where low (0-3) means the indicator does not exist, is in early development stages, or in poor state; medium (4-7) suggests that the indicator exists and there is some evidence of positive impact; and high (8-9) shows the indicator exists and there is strong evidence of positive impact. Then the scores are summed to get a total value for the indicator in respective year.
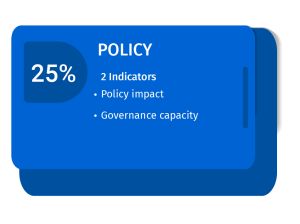
The indicators are then indexed via formula (a) and combined into total score for the theme via formula (b) using equal weights – 50% for each. This results in the final score for the theme. That score is multiplied by the theme’s 25% weight in the Sectoral Scorecards to get its final sector score, via formula (c). The formulas are at the end of the document.
CAPITAL THEME
Government spending:
-
Public sector climate spending is sourced from federal budgets and the budgets of the four largest provinces—Ontario, Quebec, Alberta and British Columbia. For more details on how this dataset is compiled, refer to the methodology section of the Climate Action Barometer.
-
Public investments from the Canada Growth Fund directed towards Climate Action business.
-
Each spending program within our compiled list is allocated to the most relevant sector.
Venture capital (VC) & private equity:
-
We use climate-related venture capital (VC) and private equity (PE) fundraising to determine private capital spending. We source data from S&P Capital IQ and BloombergNEF’s Climate-Tech Investment database.
-
BloombergNEF defines climate tech as a label for the emergence of technologies addressing the climate crisis, usually targeting both mitigation and adaptation.
-
Where distinguishable, we include operator capital expenditures.
The dollar values of both indicators are summed.
To align with Climate Action Barometer outlined in its respective Methodology, we adjust the dollar amounts to be relative to the total capital required to achieve a net-zero transition. This step is done through formulas (d) and (e). The total capital requirement is determined in The $2 Trillion Transition: Canada’s road to net-zero report.
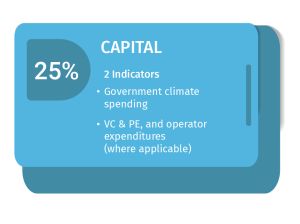
The combined value of the indicators is indexed via formula (a). This results in the final score for the theme. That score is multiplied by the theme’s 25% weight in the Sectoral Scorecards as in formula (c). Then we apply the scaling factor as descried in formulas (d) and (e), before it is aggregated into total Sectoral score. The formulas are at the end of the document.
ACTION THEME
For each sector we select relevant set of indicators determined by the RBC Climate Action Institute team, and apply approach and calculations that are relevant for each respective sector, while aiming to maintain comparability. Each sector approach and calculations are outlined and described separately below.
TRANSPORTATION
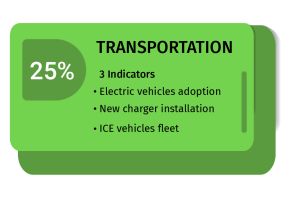
We measured three indicators and weighted them equally (33%).
Electric vehicles adoption:
-
Electric vehicles adoption covers passenger and commercial vehicles and busses.
-
Engine type coverage: Battery electric vehicles (BEV), Plug-in electric vehicles (PHEV). For purposes of this Sector Scorecard, we extend the adoption to Hybrid electric vehicles (HEV) where available.
-
Passenger electric vehicles adoption is based on Statistics Canada Table 20-10-0025-01. Quarterly data is summed to derive annual value. For the latest year, where full annual data is not yet available, we used projections from BloombergNEF’s Long-Term Electric Vehicle Outlook dataset. The engine type coverage is for battery, plug-in and hybrid electric vehicles.
-
Commercial electric vehicles and electric bus adoption is sourced from the BloombergNEF dataset mentioned above.
-
Due to differences in size of vehicles and engine types, adoption values are first converted to a common unit and then aggregated. We estimate a potential emissions abatement per vehicle and convert the units of sales to units of emissions abated, for example an electric vehicle saves on emissions that otherwise would have been generated by a gas-powered vehicle.
-
For passenger vehicles segment, we use ratio of total ICE vehicle fleet to emissions to derive per vehicle emissions intensity which it used as a proxy for the emissions abatement per vehicle.
-
Battery electric vehicles are assumed to reduce full amount of the emissions from the ICE vehicles, therefore, we apply full value of emissions abatement to this engine type segment.
-
For plug-in electric vehicles, we assume they are driven 50% of the time powered by electricity, therefore, 50% of the emissions abatement is applied.
-
For hybrid electric vehicles, we assumed 25% emissions abatement.
-
For commercial vehicles and busses, we assumed 10 tonnes CO2e per vehicle based on Pembina Institute’s fact sheet on decarbonizing medium- and heavy-duty vehicles.
-
Each year’s we collect the electric vehicle sales across the tree engine types – battery, plug-in, and hybrid. These are then multiplied by their respective emission abatement estimate discussed above, and summed to get a value for the indicator.
New charger installation:
-
This indicator is based on data from BloombergNEF’s Global Public Charging Infrastructure Dashboard. For each year, we take the difference of the total EV chargers number from the previous year to represent net new installation.
ICE vehicles fleet:
-
This indicator is based on data from BloombergNEF’s Long-Term Electric Vehicle Outlook dataset. For each year we take the value of the total passenger ICE vehicle fleet size.
The indicators are then indexed via formula (a) and combined into total score for the theme via formula (b) using equal weights – 33% for each. This results in the final score for the theme. That score is multiplied by the theme’s 25% weight in the Sectoral Scorecards to get its final sector score, via formula (c). The formulas are at the end of the document.
OIL & GAS
We measured four indicators and weighted them as described below.
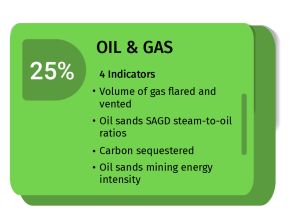
Volume of gas flared and vented:
-
For historical years, venting and flared emissions are calculated based on historical emissions factors and reported volumes of flared and vented gas across three provinces Alberta, Saskatchewan and British Columbia. For 2026, values are an annualized value based on the calendar-day average of reported volumes.
-
For Alberta, vented and flared gas volumes are taken from Petrinex’s Conventional Volumetric Data Download and calibrated with Alberta Energy Regulator historical data as denoted under Statistical Report ST60b.
-
For Saskatchewan, vented and flared gas volumes are taken from Petrinex’s Conventional Volumetric Data Download.
-
For British Columbia, vented and flared gas volumes are taken from the BC Energy Regulator Well Flare and Facility Volumetrics data (BIL-311) report.
Oil Sands SAGD steam to oil ratios:
-
For historical years, changes in steam to oil rations are the year-over-year change in reported oil sands steam to oil ratios across Steam-Assisted Gravity Drainage (SAGD) as disclosed in the Alberta Energy Regulator Statistical Report ST53. For 2026, values are an annualized value based on the calendar-day average of reported volumes within statistical report ST53.
Volume of carbon sequestered:
-
For historical years, annual carbon sequestration volumes are taken from Petrinex’s Conventional Volumetric Data Download well specific data for both Alberta and Saskatchewan. For 2026, values are an annualized value based on the calendar-day average of reported volumes within Petrinex.
Oil sands mining energy intensity:
-
For historical years, energy intensity is calculated by taking the reported total gas used at oil sands mining facilities (Alberta), specifically the aggregation of purchased fuel gas and processed fuel gas, divided by total bitumen produced as disclosed in the Alberta Energy Regulator Statistical report ST39. For 2026, values are an annualized value based on the calendar-day average of reported statistical report ST39 volumes.
The indicators are indexed to 2019 values and then selectively weighted to obtain an aggregate Action score for the oil and gas sector. The respective weighting for each indicator is as follows: Volume of gas flared and vented (35%), oilsands steam to oil ratios (30%), Oilsands mining energy intensity (25%), carbon sequestered (10%). The respective weights align with the historical aggregate emissions as measured by each indicator, with slight adjustments in weights based on RBC Climate Action Institute’s assumption of the relative importance of each technology to future sector emissions declines.
ELECTRICITY
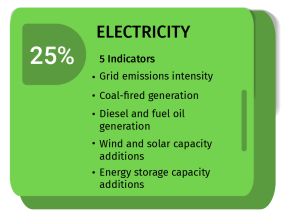
We measured five indicators and weighted them as described below.
Electricity grid emissions intensity:
-
Electricity sector emissions from Canada’s National Greenhouse Gas Inventory (ECCC), extended for unreported years as described in the Emissions theme, divided by total electricity generation.
-
Total generation is based on Statistics Canada Table 25-10-0015-01, for Canada, all classes of producer and all types of generation. Monthly data is summed to derive the annual value.
Coal-fired electricity generation:
-
This indicator is based on the Canada Energy Regulator’s Canada’s Energy Future 2026, Electricity Generation appendix, Current Measures scenario, coal by primary fuel type. For years beyond the CER’s reported historical data, CER projections under the Current Measures scenario are used.
Diesel and fuel oil electricity generation:
-
This indicator covers internal combustion generation in Yukon, the Northwest Territories and Nunavut, based on Statistics Canada Table 25-10-0015-01. Monthly data is summed to derive the annual value (MWh). Territorial data for 2019 is not available. The 2019 value is estimated by linear extrapolation from subsequent years.
Wind and solar capacity additions:
-
This indicator is based on BloombergNEF power assets data. For each year, we take the capacity of onshore wind and solar photovoltaic (crystalline silicon and thin film) assets by year commissioned. 2026 reflects year-to-date commissioning.
Energy storage capacity additions:
-
This indicator is based on BloombergNEF energy storage assets data. For each year, we take the energy capacity GWh of operational storage assets by year commissioned. 2026 reflects year-to-date commissioning.
Electricity grid emissions intensity, coal-fired electricity generation and diesel and fuel oil generation are first inversed to align upward direction with positive progress. All indicators are then indexed for each year via formula (a) and combined into total score for the theme via formula (b) using weights of 35% for grid emissions intensity, 35% for coal-fired generation, 20% for wind and solar capacity additions, 5% for diesel generation and 5% for storage capacity additions. This results in the final score for the theme. That score is multiplied by the theme’s 25% weight in the Sectoral Scorecards to get its final sector score, via formula (c). The formulas are at the end of the document.
AGRICULTURE
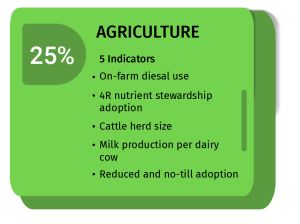
We measured five indicators and weighted them equally (20%).
Reduction in on-farm diesel use
-
Tracks diesel fuel used in the agriculture sector each year, for purposes such as running tractors, combines, or other farm equipment, based on Natural Resources Canada’s Comprehensive Energy Use Database. That database draws from Statistics Canada’s report on Energy Supply and Demand (Table 25-10-0029-01). The sector covers all types of farms, businesses that provide services to agriculture, and hunting and trapping. Use is measured in terajoules, a unit of energy. One terajoule is roughly the energy in 26,000L of diesel. Burning diesel releases carbon dioxide, so lowering use can mean lower emissions from on-farm fuel use.
Adoption of 4R Nutrient Stewardship Plans ®
-
Tracks the national average share of farmers (%) with a 4R Nutrient Stewardship plan, based on Fertilizer Canada’s Fertilizer Use Survey, conducted by Stratus Ag Research. A 4R Plan® is a nutrient management plan tailored to an individual farm that applies the Fertilizer Institutes concept of the right fertilizer source at the right rate, at the right time, and in the right place. Nitrogen fertilizer is a major source of nitrous oxide from farm soils1, and matching applications more closely to crop needs can reduce those emissions.
Advancements in herd management that lead to herd size reductions
-
Tracks the total number of cattle and calves on Canadian farms on January 1st of each year, counted in head (one head is one animal), based on Statistics Canada livestock estimates. The count covers beef and dairy animals of all ages. Cattle produce methane through digestion and from their manure2, so a smaller herd reduces those emissions.
Improvements in milk production per dairy cow
-
Tracks the average volume of milk produced per dairy cow each year, in hectolitres, based on data from Agriculture and Agri-Food Canada. It is calculated by dividing the total Canadian milk production from AAFC by the number of dairy cows from Statistics Canada (table 32-10-0130-01 (formerly CANSIM 003-0032). When each cow produces more milk, fewer cows are needed to supply the same volume, which lowers methane emissions per litre of milk.
Adoption of reduced and no tillage
-
Tracks the national average share of crop acres (%) under reduced and no tillage, as reported by growers in Fertilizer Canada’s Fertilizer Use Survey. No-till plants directly into the previous crop’s residue without working the soil. Reduced tillage disturbs the soil less than conventional tillage. Fewer tillage passes burn less fuel3, and leaving soil undisturbed can help sequester more soil organic carbon4.
Because the five indicators use different units, they are not converted to a common unit or to emissions abatement. Instead, each indicator is indexed to its 2019 value (2019 = 100) via formula (a). On-farm diesel use and cattle herd size are inverted, so that declines increase the score.
The indicators are then indexed via formula (a) and combined into a score via formula (b) using equal weights – 20% for each. This result is the final score for the theme. That score is multiplied by the theme’s 25% weight in the Sectoral Scorecards to get its final sector score, via formula (c). The formulas are at the end of the document.
HEAVY INDUSTRY
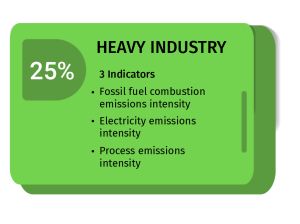
We measured three indicators and weighted them equally (33%).
Fossil fuel combustion emissions intensity:
-
Covers pulp and paper, iron and steel, aluminum and non-ferrous metals, cement, chemicals and mining. – Fossil fuel consumption by sub-sector is based on Statistics Canada Table 25-10-0029-01, Supply and demand of primary and secondary energy in terajoules. Consumption is converted to emissions using emission factors from Canada’s National Greenhouse Gas Inventory (ECCC).
-
Emissions are divided by annual production in tonnes to derive intensity for each sub-sector. Production is sourced from the Canadian Industrial Energy End-use Data and Analysis Centre (CIEEDAC) NAICS database at Simon Fraser University. – Sub-sector intensities are combined into a single value using production weights.
Electricity emissions intensity:
-
Electricity consumption by sub-sector is based on the same Statistics Canada table, converted to emissions using grid emission factors from Canada’s National Greenhouse Gas Inventory.
-
Emissions are divided by annual production and combined using production weights, as above.
Process emissions intensity:
-
Covers cement, iron and steel, chemicals and aluminum.
-
Industrial process emissions are sourced from Canada’s National Greenhouse Gas Inventory (ECCC) and divided by annual production for each sub-sector. Sub-sector intensities are combined using production weights.
Production data are reported through 2023. Subsequent years are estimated through linear extrapolation. Energy use data are reported through 2023 and process emissions through 2024. Values for subsequent years are estimated through linear extrapolation.
Because a decline in emissions intensity is good news, all three indicators are first flipped so that a higher number means more progress. Each is then converted to a index via formula (a), and the three are combined into one score for the theme, with equal weights on 33%, via formula (b). This is the final score for the theme. That score is then multiplied by the theme’s 25% weight in the sector scorecard and combined with the other themes’ scores into the total sector score via formula (c). Refer to page 6 for more details on formulas.
BUILDINGS
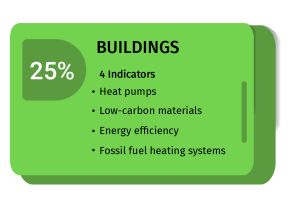
We measured four indicators and weighted them equally (25%).
Heat Pumps:
This indicator is based on data from Statistics Canada and Natural Resources Canada. The value reported is the estimated floor area of homes in Canada with heat pumps.
Assumptions: Average home size of 185 square meters; excludes apartments and mobile homes.
Low Carbon Materials:
This indicator is based on data from the Government of Canada database of mass timber buildings under construction or planned in Canada. The value reported is the total surface area of completed projects.
Assumptions: Calculated using linear progression from previous years as no new data yet available for 2026.
Energy Efficiency:
This indicator is based on data from the Canadian Green Building Council (CAGBC)’s list of LEED buildings. The value reported is the cumulative floor space of registered buildings.
Assumptions: Used available data from January to June 2026 and projected for the remainder of the year.
Fossil Fuel Heating Systems:
This indicator is based on data from Natural Resources Canada (NRCan). The value reported is the number of household buildings with fossil fuel heating systems.
Assumptions: Calculated using linear progression from previous years as no new data yet available for 2026.
The indicators are then indexed via formula (a) and combined into total score for the theme via formula (b) using equal weights – 25% for each. This results in the final score for the theme. That score is multiplied by the theme’s 25% weight in the Sectoral Scorecards to get its final sector score, via formula (c). The formulas are at the end of the document.
FORMULAS
Formula (a):
Creates the starting value of an indicator in 2019 to 100. The formula adjusts subsequent years’ data relative to the 2019 baseline value. Indexing allows to level set all indicators to the same starting point, and track their relative progress. For illustrative purposes, we show how an indicator value is indexed. Assume the following: the indicator value is 195 in 2019, and 288 in 2026 (actual values of the Governance Capacity indicator within the Policy Theme), As the first step the formula sets the 2019 value at 100. All subsequent years’ values are then divided by the 195 and multiplied by 100. Hence indexed indicator value for 2026 is 288/195*100 = 148.
Formula (b):
Combines indicators into a total value for a theme, using respective indicator weights.
Formula (c):
Combines themes into a total value for a scorecard, using respective theme weights.
Formula (d) and (e):
A two-step process developed by the Climate Action Institute team allow for comparability across barometer and sectoral scorecards: first step (formula d) converts the dollar amounts relative to total capital requirement; second step (formula e) uses the result from previous step to scale every year’s progress.
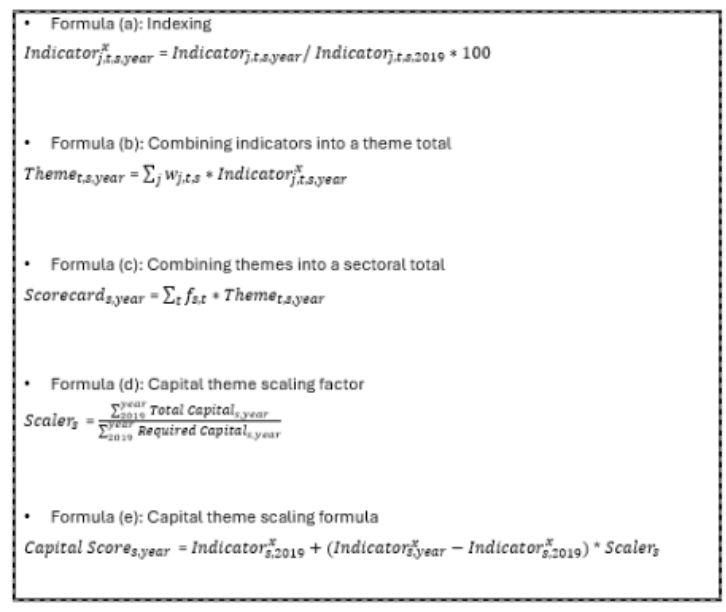
Where:
Indicatorj,t,s,year are the actual values of indicators in the period year. Where j denotes the indicator, t used for a theme.
Upper script x denotes indexed value for the indicators with value for 2019 set at 100.
w are the weight for indicators.
f are themes’ scorecard contribution factors.
Total Capital in formula (d) refers to the value of the indicator as described in the ‘Capital’ section of the methodology. And Required Capital is annual spending based on ‘Two Trillion Transition’ study.
Government Pulse Check
The government pulse check is informed by quantitative and qualitative insights on government spending, government policy impact on GHG emissions trajectory, and climate policy experts’ perspectives on climate policy and its efficacy in Canada.
The RBC Climate Action Institute research team tracks annual government spending at the federal level and in the four largest provinces by gross domestic product to maintain tracking of government fiscal commitment to climate action.
To understand if government policies and spending are tracking towards 2035 and 2050 targets, the research team also considers the modelled projections of policy on GHG emissions scenarios to provide a directional, quantitative lens on policy efficacy in meeting GHG targets. These projections are produced each year by Environment and Climate Change Canada.
Finally, the research team surveyed an expert policy panel of more than 40 to glean additional detailed insights on the impact of current policies on Canada’s GHG emissions reduction targets. CAI solicited their views of policy efficacy (i.e., did it achieve its desired result), policy impact (i.e., broader consequences of policy–intended and unintended), policy durability (i.e., long-term stability of policy). This survey was conducted between June and August 2026.
The list of participants for the expert policy panel was curated by the Climate Action Institute and the Canadian Climate Institute and included academics, policy experts, former government officials and analysts. Key policy actions identified in the Government Pulse Check—such as carbon pricing, methane regulations and Clean Fuel Regulations, consumer incentives, industry incentives, funding programs and education and awareness—were deemed by our Climate Action team, in collaboration with external climate policy experts, to have a meaningful impact on the trajectory of Canada’s emissions.
Please see full list of participants in the Acknowledgment section.
Business survey
The business survey tracks year-over-year change in business leaders’ approach to climate action in their strategies, operations and products and services. The businesses are primarily focused on the six key sectors identified by the CAI Team as our focus areas, namely: Buildings, Agriculture, Oil & Gas, Transport, Heavy Industry, and Electricity.
The business survey is run by Kantar Canada Inc., a third-party vendor in June and July 2026 and attracts roughly 150 business responses.
Kantar Canada’s business survey is a self-administered online poll. It targeted vice-presidents and business leaders on a best-effort recruitment process. The survey was targeting complete responses from 100-150 companies.
Industry coverage included Buildings, Agriculture, Oil & Gas, Transport, Heavy Industry, and Electricity, with top up in ‘other’ industries.
Consumer Survey
The consumer survey tracks year-over-year change in Canadian consumers’ perspectives, experiences and actions on climate change.
The consumer survey is run by a third-party vendor, Ipsos Canada, between June and July 2026 and collects roughly 2,000 individual responses from its Ipsos online omnibus in English and French across Canada.
This survey examines the views, experiences, and actions related to climate change among adults in Canada, the United States, and the United Kingdom.
All three countries were asked the same three questions, while respondents in Canada were asked an additional 11 questions.
The survey was conducted online between June 3–5, 2026 in Canada; June 8–9, 2026 in the United States; and June 12–16, 2026 in the United Kingdom.
Surveys were completed by adults aged 18 and older through the Ipsos I-Say Panel.
Results are considered accurate within a confidence interval (+/- percentage points), 19 times out of 20, compared to what would have been obtained if all adults aged 18+ had been surveyed. Sample sizes and confidence intervals are as follows:
CA n=2001 +/- 2.7
To allow for international comparisons, Ipsos ran select questions in the U.K. and U.S. to gleam insights from international consumers. These surveys run in June and July and collect roughly 1,000 responses each.
Sample sizes and confidence intervals are as follows:
U.S. n=1005 +/- 3.8
U.K. n=1122 +/- 3.6
Government Survey Acknowledgments
RBC Climate Action Institute would like to thank the Canadian Climate Institute and especially Dave Sawyer, Principal Economist, and Julia Kilpatrick, Vice President, External Affairs, for their collaboration on the Government Pulse Check survey.
We would also like to thank the following people for participating in the survey:
-
Bentley Allan, Vice-President, Future Economy Transition Accelerator
-
Louis Beaumier, Directeur exécutif, Institut de l’énergie Trottier – Polytechnique Montréal
-
Vittoria Bellissimo, President and CEO, Canadian Renewable Energy Association
-
Michael Berends, CEO, ClearBlue Markets
-
Mel Cappe, Distinguished Fellow, Munk School of Global Affairs and Public Policy
-
Aaron Cosbey, Senior Associate, International Institute for Sustainable Development
-
Alison Cretney, Executive Director, Energy Futures Lab
-
Corey Diamond, Executive Director, Efficiency Canada
-
Simon Donner, Professor, University of British Columbia
-
Rachel Doran, Executive Director, Clean Energy Canada
-
Jason Dion, Chief Impact Officer, Clean Economy Fund
-
Brad Griffin, Director, Energy and Materials Research Group, Simon Fraser University
-
Michael Gullo, Vice-President, Policy, Business Council of Canada
-
Tyler Hamilton, Senior Director, Climate, MaRS
-
Robert Hornung, Independent Consultant, Net-Zero Advisory Body Co-Chair
-
Don Iveson, Principal, Civic Good
-
Robert Johnston, Director, Energy and Natural Resources, University of Calgary School of Public Policy
-
Jeremy Kronick, President and CEO, C.D. Howe Institute
-
Tamara Krawchenko, University of Victoria
-
Kwatuuma Cole Sayers, Executive Director, Indigenous Power Coalition
-
Na’im Merchant, Executive Director, Carbon Removal Canada
-
Andrea Moffat, Strategic Advisor, Addenda Capital
-
Normand Mousseau, Professor and Scientific Director, Université de Montréal and Institut de l’énergie Trottier, Polytechnique Montréal
-
Nancy Olewiler, Professor Emerita, Simon Fraser University
-
Martin Olszynski, Associate Professor, University of Calgary
-
Nicholas Rivers, Professor, University of Ottawa
-
John Robinson, Professor Emeritus, University of Toronto
-
Daniel Rotman, Executive Director, Equiterre
-
Aaron Schroeder, CEO, Brightspot Climate Inc.
-
Blake Shaffer, Associate Professor, University of Calgary
-
Chris Severson-Baker, Executive Director, Pembina Institute
-
Merran Smith, President, New Economy Canada
-
Roger Street, Green Templeton College, University of Oxford
-
Katie Sullivan, Global Managing Director, IETA
-
Tim Weis, Sr. Director, Industrial Decarbonization, Pembina Institute
-
Dan Woynillowicz, Principal, Polaris Strategy + Insight.
Important notice regarding information in this report and Caution regarding forward-looking statements
This report is intended as general information only and does not constitute an offer or a solicitation to buy or sell any security, product or service in any jurisdiction; nor is it intended to provide investment, financial, legal, accounting, tax or other advice, and such information should not be relied or acted upon for providing such advice. Nothing herein shall form the basis of or be relied upon in connection with any contract, commitment, or investment decision whatsoever. The reader is solely liable for any use of the information contained herein, and neither the Climate Action Institute, nor Royal Bank of Canada (“RBC”), its subsidiaries and its affiliates nor any of their respective directors, officers, employees or agents shall be held responsible for any direct or indirect damage arising from the use of any information contained herein by the reader.
Except as required by law, none of RBC nor any of its affiliates undertake to update any information in this report. All expressions of opinion in this report reflect the judgment of the authors as of the date of publication and are subject to change. We do not guarantee the accuracy of the information or expressions of opinion presented herein and they should not be regarded as a complete analysis of the subjects discussed. No endorsement of any third parties or their advice, opinions, information, products or services is expressly given or implied by RBC or any of its affiliates. All references to websites are for your information only. The content of any websites referred to in this report, including via website link, and any other websites they refer to are not incorporated by reference in, and do not form part of, this report. This report is also not intended to make representations as to sustainability-related initiatives of any third parties, whether named herein or otherwise, which may involve information and events that are beyond our control.
From time to time, we make written or oral forward-looking statements within the meaning of certain securities laws, including on this website, and in other communications. Forward-looking statements in this report include, but are not limited to, statements relating to economic or sustainability-related objectives, vision, ambitions, commitments, goals, and targets as well as potential events and actions. By their very nature, forward-looking statements require us to make assumptions and are subject to inherent risks and uncertainties, which give rise to the possibility that our predictions, expectations or conclusions will not prove to be accurate, that our assumptions may not be correct, and that any economic or sustainability-related objectives, vision, ambitions, commitments, goals, and targets will not be achieved. We caution readers not to place undue reliance on these statements. Sustainability-related metrics, data and other information contained on this website are or may be based on assumptions, estimates and judgements.
Climate Action 2027 Team
John Stackhouse, Senior Vice President, Office of the CEO
John Intini, Senior Director, Editorial
Yadullah Hussain, Managing Editor
Research
Lisa Ashton, Interim Head
Wilson Fink, Director, Agriculture Policy
Shaz Merwat, Director, Energy Policy
Farhad Panahov, Economist
Vivan Sorab, Senior Manager, Clean Technology
Editorial and production
Lavanya Kaleeswaran, Director, Digital & Production
Alicja Siekerska, Editor
Caprice Biasoni, Design Lead
Communications
Sarah Kennedy, Senior Director Communications
Jen Gorman, Senior Manager, Communications, Media Relations
Joelle Schonberg, Senior Program Manager

