rbc_toc_for_mmm_action

A COP28 declaration by 25 countries in 2023 to triple nuclear capacity by 2050 sets the stage for a new race to deploy nuclear power. Several structural shifts have only accelerated that momentum, driven by nuclear’s competitive advantage to power artificial intelligence data centres and advanced manufacturing, and the criticality of energy security in a changing geopolitical order.

Where does Canada stand in a world that is re-embracing nuclear power?

Canada has a window of opportunity but must race to capture it. Its key advantages are its first-mover status on the construction of a grid-scale Small Modular Reactor (SMR) just east of Toronto and an 80-year track record as a formidable civil nuclear power.

Expected to come online by 2030, the SMR power plant in Darlington is Canada’s first new reactor in three decades and has the potential to power 300,000 homes. Crucially, it showcases Ontario’s nuclear prowess, paving the way for its operational and supply-chain expertise to power grids from Saskatchewan to Tennessee to Poland.

But competitors are also on the move. The Trump administration’s Nuclear Reactor Pilot Program aims to have at least three advanced nuclear test reactors achieve an advanced stage by the summer of 2026. China’s SMR program is also advancing, with the demonstration project of its domestic ACP-100 design achieving new construction milestones in 2025.

RBC Thought Leadership’s Vivan Sorab moderates a panel – The Role of SMRs in a Global Tripling of Nuclear Capacity – at the Canadian Association of Small Modular Reactors SMR Forum 2025 in Edmonton.

Canada’s continued success hinges on it bolstering its nuclear sector to deliver new capacity for power and non-power applications, and strengthening fuel supply for tomorrow’s nuclear fleet.

Here’s what’s needed for Canada to succeed:

Anchor nuclear fuel supply around Canadian uranium. Potential reductions in secondary uranium supplies and the emergence of SMRs in the 2030s and 2040s will reconfigure nuclear fuel supply chains, increasing the need for uranium concentrate, conversion, enrichment, and fuel fabrication services. Canada’s world-class uranium deposits and its expertise in uranium milling and conversion are key advantages, and can help anchor a North American—and global—nuclear fuel supply chain.

Collaborate with the U.S. to unlock continental nuclear energy security. Lessons from decades of U.S. operational experience in boiling water reactors (BWR) will be invaluable as Canada constructs its first SMR—based on a BWR design—at the Darlington New Nuclear Project. As a first-mover in SMR construction and deployment, Canadian expertise will be critical to the success of similar U.S. SMR projects when they commence construction and move into operation.

Build investor confidence. Construction risks have hindered private sector participation in new nuclear reactor financing. Successfully translating Ontario’s success in nuclear refurbishment into new reactor construction will be critical to increasing investor confidence in SMRs, though government support—especially in smaller jurisdictions—will remain important. 

Nurture Indigenous engagement and equity. Engagement with Indigenous communities is critical for new nuclear projects. That includes raising technology awareness and buy-in from communities where nuclear power has never been built before, but also giving them a stake in the project through jobs, training and equity opportunities.

rbc_toc_for_mmm_action

Even as the world reels from tariffs, there’s a new levy lurking on international borders: a carbon duty on imports.

The EU rolled out its Carbon Border Adjustment Mechanism (CBAM) in 2023; Mark Carney’s government is considering a Border Carbon Adjustments (BCA) to level the playing field for domestic energy and heavy industry against foreign competitors; and a handful of bills in the U.S. at the federal and state level are proposing fees on imports with weaker climate compliance.

The idea of a border carbon fee is simple: ensure that manufacturers from, say, Montreal or Berlin, that spend money and effort to adhere to their domestic robust carbon policies are not disadvantaged against competitors that benefit from weak climate policies in their jurisdictions. Combined, a domestic carbon policy and a border carbon fee is a one-two punch that forces foreign competitors to raise their environmental standards, and ensures domestic industries are not unduly penalized for pursuing decarbonization strategies. Think of Ottawa taxing coal-powered Chinese steel to ensure its not unfairly advantaged against Canadian steel that’s forged by low-carbon but highly capital-intensive electric furnaces. 

While a border carbon fee would be a natural extension to Canada’s industrial carbon policy, its implementation is tricky. For starters, it could further inflame Ottawa’s already tense relationship with the Trump administration, which has cracked down on climate policies.

Canada’s carbon policy is in a state of flux, too. Earlier this year, the federal government scrapped a fuel charge—widely known as a carbon tax, followed soon after by British Columbia that had one of the longest and most stable emissions pricing systems globally. The past year has seen Canadian policymakers wobble on industrial carbon pricing: commitment to carbon pricing in Quebec and British Columbia all the  while  Alberta froze its carbon price at $95/tCO2e earlier in the year, and Saskatchewan cancelled its industrial carbon pricing system.

Canada’s industrial carbon policy has had mixed success to date—it has helped fund renewable energy projects, but with limited direct impact on emissions reduction to date. As the federal government and some provincial jurisdictions look to adjust their industrial carbon pricing strategy, they will also need to factor in shifting trading patterns, changing global economic priorities and the competitiveness of Canada’s industries.

Canada is one of 40-plus countries that have deployed a version of carbon pricing, covering 28% of global emissions.1 Several are now also exploring or advancing domestic carbon pricing systems in response to the European Union’s CBAM:

  • Emerging markets such as India, Türkiye and Brazil are pursuing domestic carbon pricing mechanisms to ensure their exports comply with EU rules.

  • The U.K. is in the process of linking its carbon market to the EU to streamline its climate policy with the economic bloc.

  • China recently expanded its carbon pricing coverage to include cement, steel and aluminum sector emissions.

  • Japan is consolidating its carbon pricing regimes into a single market as part of its Green Transformation (GX) plan, starting early 2026.

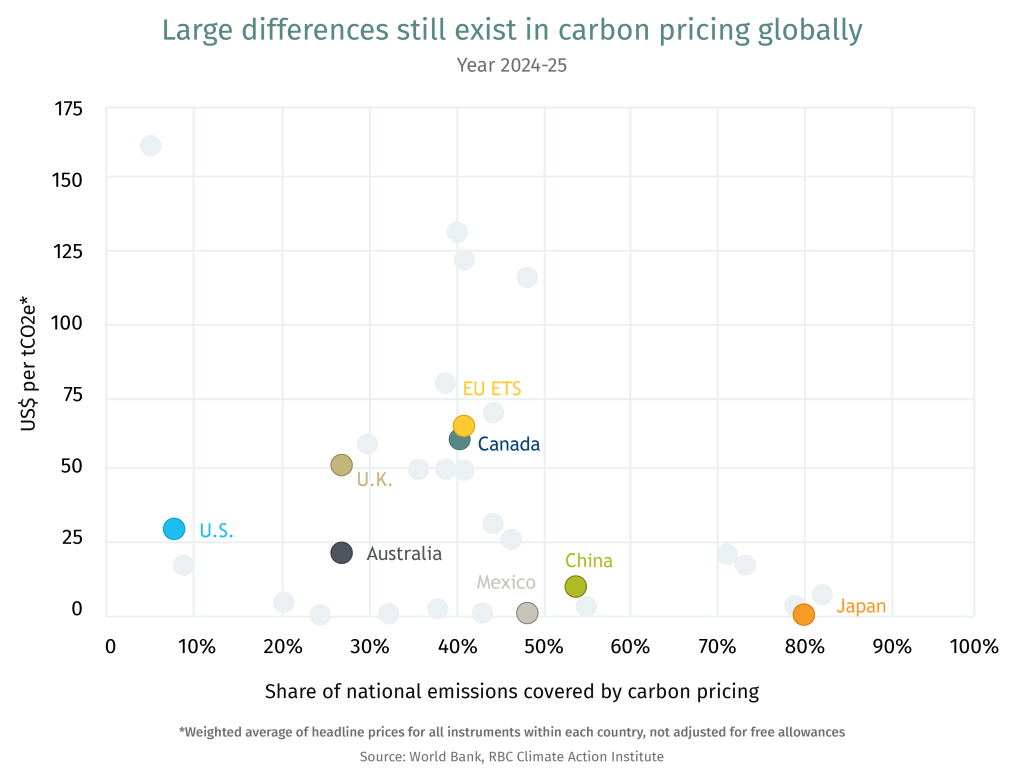
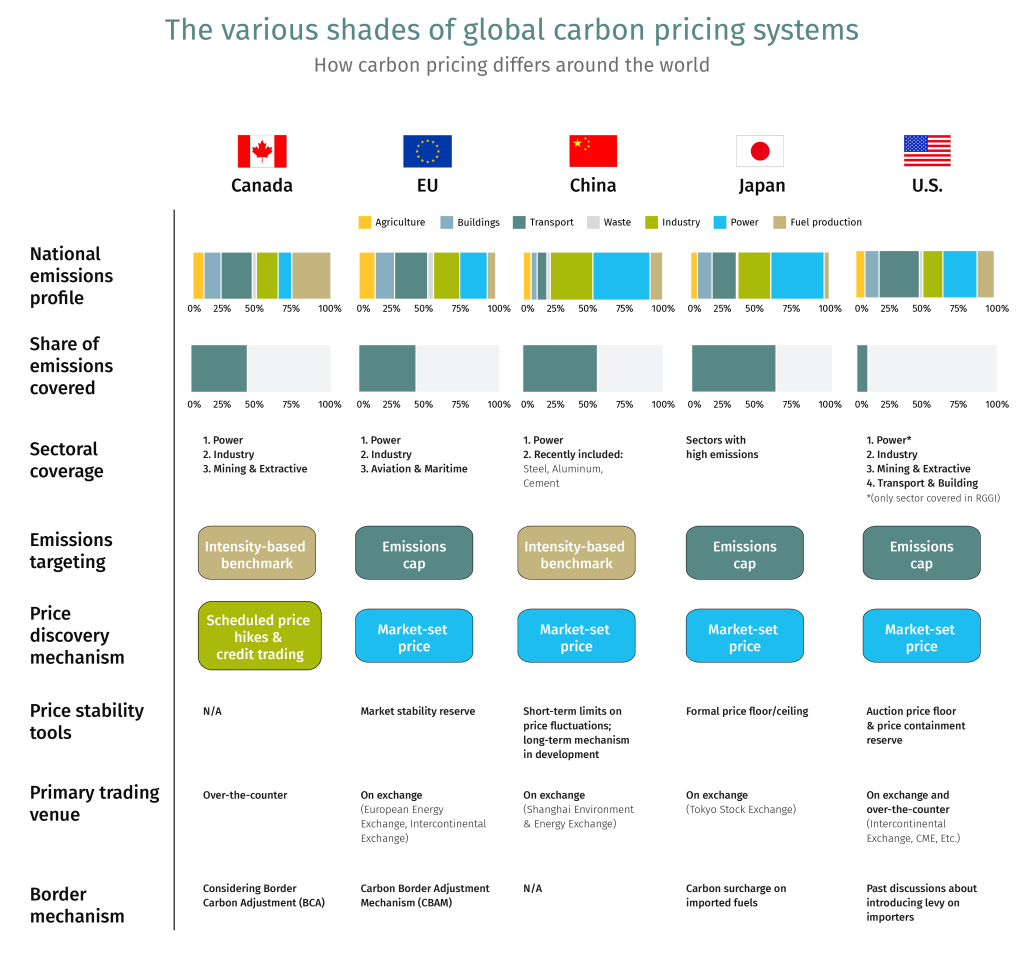
Still, pricing of carbon remains varied. Emissions trading schemes (ETS)—the most common carbon pricing system—rely on market signals to determine the pathway for emissions reduction. As the chart below shows, different jurisdictions assess their sectoral emission profiles, emission reduction potential and costs, that has led to significant differences in how they price carbon.

The U.S.’s Border Carbon Policy Proposals

The Foreign Pollution Fee Act (of 2025) is making its way through the U.S. Senate. It’s a policy designed to impose hefty levies on carbon-intensive imports from primarily China and Russia. But Canada could also get caught in the crossfire, and potentially face carbon tariffs ranging between 17%-33% on its industrial exports to the U.S.2

American policymakers have also been looking to shield domestic industries through a slew of other carbon policy proposals. These include:

  • The FAIR Transition and Competition Act aimed at ensuring American businesses are not undercut by unregulated importers by imposing a border carbon adjustment on carbon-intensive imports.

  • A U.S. Clean Competition Act would establish US$55 per tonne carbon tax on domestic producers and protect them from imports through border adjustments.

  • PROVE IT Act, if enacted, will facilitate the collection of emissions intensity data for energy intensive industries across major trading partners to ensure global transparency on carbon emissions. It was considered a precursor to the Foreign Pollution Fee Act.

The Foreign Pollution Fee Act, reintroduced on April 8, 2025, by Republican Senators Bill Cassidy and Lindsey Graham, seems most advanced. The structure avoids domestic carbon tax, and creates a linear relationship between the levy on importers and their emissions intensity gap. While the bill is unlikely to proceed, it’s seen as another form of protectionism under the guise of climate change policies.

Alberta and Quebec kicked off Canda’s carbon pricing journey in 2007, pursuing two different ways to apply carbon levies on their large industrial emitters. Now, a patchwork of federal and provincial carbon pricing regimes in Canada apply to a range of sectors including power, industry, mining and extraction, and covering nearly half of the country’s total emissions.

With some exceptions, the emissions trading system is Canada’s preferred carbon pricing mechanism. This is how it works: a greenhouse gas emissions performance benchmark places allowance limits on a company’s emissions. Companies emitting beyond those benchmarks buy permits from other companies with emissions that are under the prescribed level. The policy is designed to incentivize investments in low-carbon technologies that would help sharpen Canada’s competitive edge.

The system has encouraged capital to flow to sustainable projects: More than $80 billion worth of projects in carbon capture, utilization and storage (CCUS), wind, solar and bioenergy were either shovel-ready or under consideration and poised to benefit from carbon credit revenues, according to the Major Projects Inventory in 2024.3 Similarly, Emissions Reduction Alberta, funded through the province’s industrial carbon pricing, has facilitated over 300 clean technology projects, valued at more than $10 billion.4

Setting performance benchmarks means not all emissions are subject to carbon pricing, only those beyond the allowance limit—by design. Average cost in Canada, when adjusted for free pollution allowances, stood at $10 per tonnes of carbon dioxide equivalent (tCO2e) in 2024, a fraction of the $80 headline carbon price, according to latest estimate by the Canadian Climate Institute.5 This helps limit carbon leakage (i.e., manufacturers moving to jurisdictions with lower compliance).

Impact on emissions reduction

Carbon pricing reduces emissions with limited or no impact on the economy, according to several studies. But the scale of emissions reduction remains relatively small, with up to 2% annual GHG reduction on average across a range of countries with carbon pricing, including Canada.6 Emissions will need to climb down 6% annually for Canada to reach its climate goals by 2030, as set out in its Nationally Determined Contribution (NDC) commitment to the United Nations.

But there’s a reason the impact on emissions has been muted over the past two decades: Carbon prices were kept low as most clean technologies were nascent with high costs and in early-adoption stage. That’s slowly changing, with solar and wind becoming competitive with fossil fuels, and electric vehicles poised for price parity with conventionally-powered cars; in places like China, EVs are cheaper than gas-powered vehicles. Meanwhile, carbon-capture capacity has doubled globally over the past 10 years.

Major discrepancies in carbon pricing with its trading partners can impact Canada’s competitiveness at a time of a structural global upheaval.

Overall, about a fifth of Canada’s imports and exports are from jurisdictions that don’t price carbon. In the U.S.—where policy vary by state—the average carbon price is only US$6 per tonne when adjusted for Canada-U.S. trade flows at the state level.

Here’s what Canada should watch for as its looks to maintain its global competitiveness amid fragmented trade and climate policies:

  • Diversify trade partners: This won’t be an easy task with 75% of goods destined for the U.S. But nearly a third of Canadian export categories are more diversified; even oil and gas exports are finding new customers in Asia since the expansion of the TMX pipeline and the start of LNG Canada. Beyond the U.S., the global rise of climate-compliant products could give Canada an edge. For instance, Japan’s evolving carbon pricing policy favours cleaner fuel sources.

  • Foster predictable policy: Access to capital was the top challenge businesses faced in their emissions reduction goals, as noted in our Climate Action Report 2025. Large-scale investments to advance low-carbon technologies require strong and stable price signals to lower risk and allow capital to flow. Policy certainty could help pave the way for capital to be directed towards Canada.

  • Streamline provincial systems: Reducing barriers and inefficiencies could help de-risk the investment environment. Businesses operating in multiple jurisdictions face different rules, varying price levels and limited or no ability to transfer credits between their facilities. We have previously emphasized that harmonizing fragmented markets could offer considerable economic upside. Removing interprovincial trade barriers could offer greater market access and liquidity.

  • Beware the wrath of the U.S.: Reconciling carbon policy differences with the U.S.— where less than a tenth of total emissions are priced and at a much lower rate—is eventually required. With 80% of Canada’s oil production, 90% of aluminum, about half of steel and a third of cement shipped to the U.S., Ottawa needs to be mindful of how the U.S. reacts to changes to our policies. For some industries like the oilsands, compliance with emissions obligations costs about $1 per barrel, and less than 50 cents when using carbon offsets. This limits the competitiveness concerns. However, other industries already under tariff pressure and commanding much lower profit margins might require more support.

  • U.S. trade irritants cut both ways: Extending carbon pricing to imports through BCA is effectively a tariff. With Canada already at odds with its biggest trading partner, any attempt to level the playing field with American companies might be viewed as a trade escalation.

  • Resolve administrative complexity: From reporting to verifying, BCA is a daunting administrative task. Especially with varying provincial prices, coverage and benchmarks. It’s another reason to pursue harmonization as we wrote previously. The EU excluded SMEs and individual importers from CBAM to avoid regulatory complexity and reduce their costs. Canada should also strive for simplicity of rules.

  • Beware of unintended consequences: Emissions-intensive trade-exposed (EITE) sectors account for only 5% of Canadian GDP. However, those materials feed into an array of downstream industries. In effect, BCA could cascade through the supply chains. Raising costs for imported steel, for example, while protecting domestic manufacturing may raise costs for automakers, and construction companies, among others, as estimated by the Bank of Canada.7

rbc_toc_for_mmm_action

  • Gas is critical in our best—and worst—case scenarios for global energy systems. Gas will be vital as a transition fuel in a ‘Decarbonizing World’ before declining by the late-2030s; and as an energy security cushion in our worst-case scenario, that we call ‘Dystopian World’.

  • Gas can anchor G7+’s energy security—but needs work. For G7+ consumers, it can reduce dependence on Russia in the near-term and avoid boom-bust cycles. In the longer term, it opens up promising new markets for G7+ producers. But the commodity is geopolitically problematic, too expensive in certain regions like Asia, and deemed too carbon-intensive. The G7+ can help overcome those hurdles.

  • Gas can help address, but also worsen, climate change. Achieving net-zero before the 2060s is challenged. But the G7+ can advance policies and technologies that catalyze carbon capture, accelerate methane intensity reductions, and encourage the development of low-carbon alternatives such as ammonia and hydrogen. That would help limit global temperature rise to around 1.7-1.8 Celsius compared to pre-industrial levels.

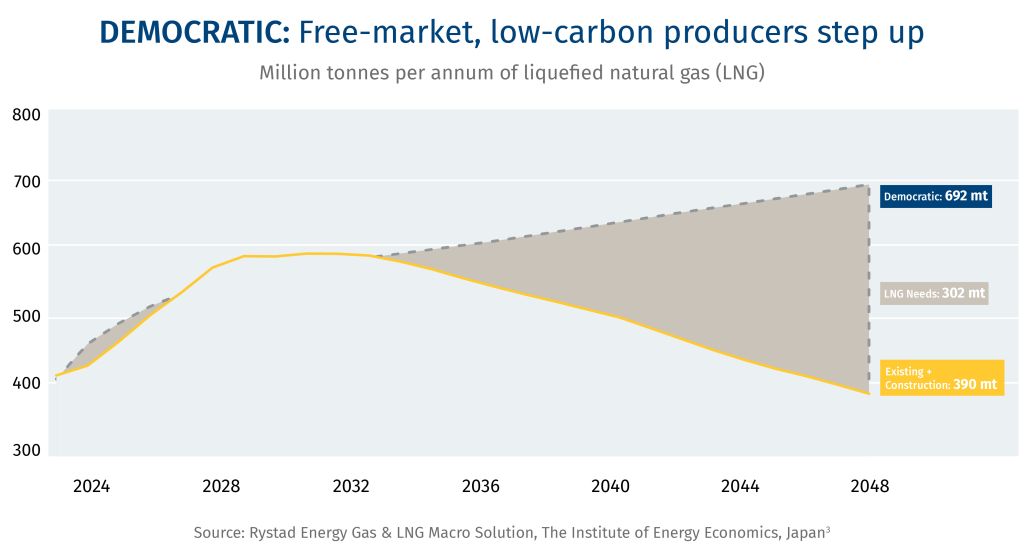
  • The G7+ could emerge as the most influential LNG player. By 2040, LNG exports from the U.S., Canada and Australia can power G7+ economies and also ship gas to emerging Asia, as we outline in our ‘Democratic World’ scenario. It’s an opportunity for G7+ to expand its geopolitical influence and forge stronger ties with emerging markets.

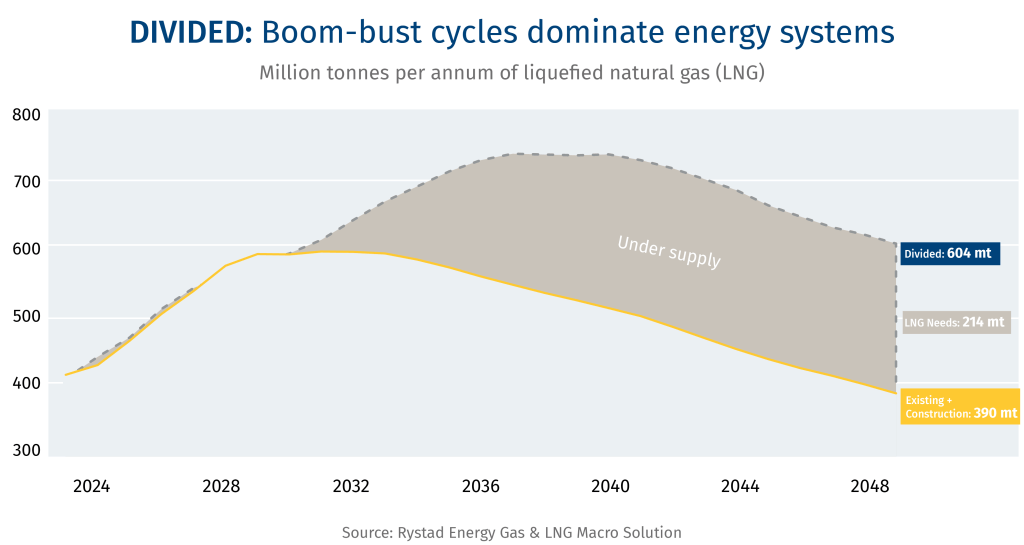
  • Global LNG export capacity may need to rise by nearly 50% by 2040. Current export capacity and supply under construction is insufficient to meet the needs and aspirations of a rising global population and a world economy that will expand 42%, according to our ‘Divided World’ scenario.

  • G7+ compact can help unlock financing for LNG projects. It could facilitate funding from a range of financial institutions, including multilateral development banks and national export credit agencies, that have excluded natural gas investment for fear of “locking in” emissions.

  • Exporting gas would require US$1.2-trillion in investments in North America alone. A build-out of the continent’s gas infrastructure would likely require around US$1.2 trillion over the next 15 years. But it would require supportive policies and clear frameworks for communities and corporations.

Welcome to the 2040s.

In the decade that will take us to the mid-century, our world will be very different, and so will our energy needs.

The planet will be home to at least a billion more people, with a population well over nine billion. The world’s economic output, if it follows recent decades, will add the equivalent of another U.S. economy, spread largely across Asia and the global south, with all the energy demands that go with it. Add to that something entirely new—the world of artificial intelligence at mass scale, with computing needs that, for now, seem incomputable. By one estimate, we will need 4,000 more terawatt hours of power to run this emerging data centre economy; that’s equivalent to 15% of the world’s electricity generation today.1

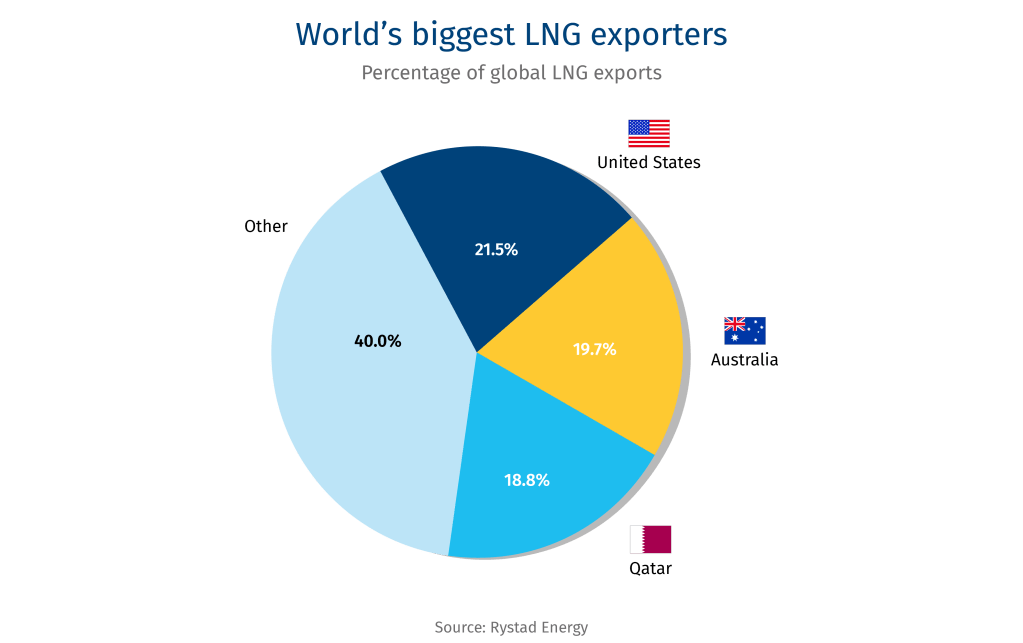
Another step change in energy demand may require more of every practical and affordable energy source, but the greatest expectations may be placed on natural gas. It’s expected to become the world’s dominant energy form, surpassing oil, having already grown in supply by 70% in the first quarter of the 21st century.2 The advent of liquefied natural gas, and supertankers to carry super-chilled LNG across oceans, has transformed the gas outlook even more. In a little over a decade, the United States has transformed itself from amongst the world’s largest gas importers, to the world’s largest LNG exporter.

As oil was to the 20th century, gas may be as critical to the 21st, but not without strategic choices that are already challenging the world. Russa’s invasion of Ukraine, and its weaponization of gas to weaken Europe, is just one indication of how the world’s rapidly growing reliance on gas has put energy security at risk. Rapidly growing and urbanizing countries across much of the world have found their dependence on imported gas to present further risks. The West’s growing ambition to reshore manufacturing, and remilitarize, may require more gas, too, as a reliable and affordable concentrated energy source.

Few bodies may be better suited to address these challenges than the G7, the group of leading liberal democracies (the United States, Canada, the U.K., France, Germany, Italy and Japan) that is meeting June 15-17 in Kananaskis, Alberta. Atop the group’s agenda: energy security.

The G7 was formed 50 years ago, in the mid-1970s, in response to similar disruptions to the global economy caused by an oil shock and ensuing conflicts. Today, the alliance faces new challenges, particularly from China and Russia, and may find opportunities in reasserting itself through an approach to democratic and decarbonized natural gas for a fast-changing world.

Properly managed, the G7 and key allies such as Australia and South Korea, known as G7+, can create stronger alliances with emerging markets, especially in Asia, stabilize energy prices and strengthen long-term global growth. It could even provide a bridge to lower energy emissions, by displacing coal. Led by the European Union’s 107 million tonnes per annum (mtpa) and Japan’s 64 million mtpa of LNG consumption, the G7+ consumes 227 mtpa, or 51% of global demand. That exceeds the 179 mtpa currently produced by the U.S. and Australia.

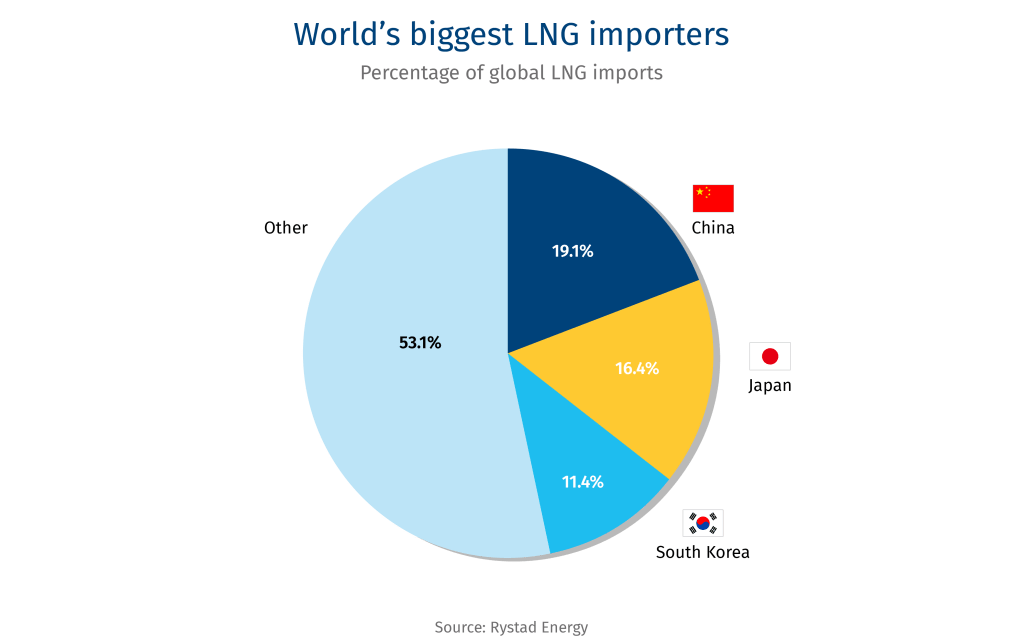
By 2040, however, the G7+ gas trade balance could reverse such that its supply far exceeds the demand of its members and allies—by almost 150 mtpa—requiring the Western-led alliance to secure new markets. China is expected to be, by far, the largest purchaser of LNG in 2040 (163 mtpa, from 79 mtpa in 2024, according to Rystad Energy’s base case). But trade frictions with North America could result in Chinese LNG imports diversifying away from American sources.

For the G7, other allies will be critical to ensure a greater balance between supply and demand. India is often seen as a vital long-term prospect for G7+ exports, with projected demand of 63 mtpa. But other emerging Asian markets such as Pakistan, Bangladesh, Thailand and Indonesia will be essential, too, as they’re projected to consume a combined 219 mtpa by 2040. In a potential world where the Chinese market is inaccessible to the U.S., and India follows its own path—prioritizing price above all else, perhaps from Russian supplies—Asian demand will be vital to any G7+ strategy.

With all these forces at play, the world almost certainly will need more gas in 2040—but just how much will be needed?

To map out potential pathways, RBC Thought Leadership and Oslo-based Rystad Energy developed a novel research methodology to outline plausible scenarios for the 2040s, knowing the trajectory of growth will be critical to the mid-century condition of our world. Each was shaped by geopolitical alignments, climate policy ambitions and market dynamics. We then worked with a range of policy experts to assess the risks in each scenario, and develop broader policy options.

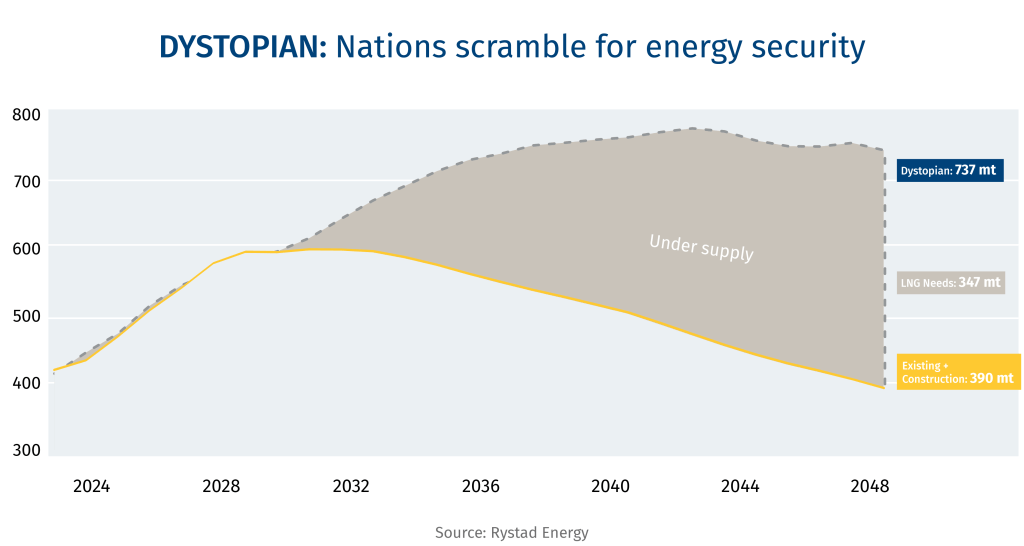
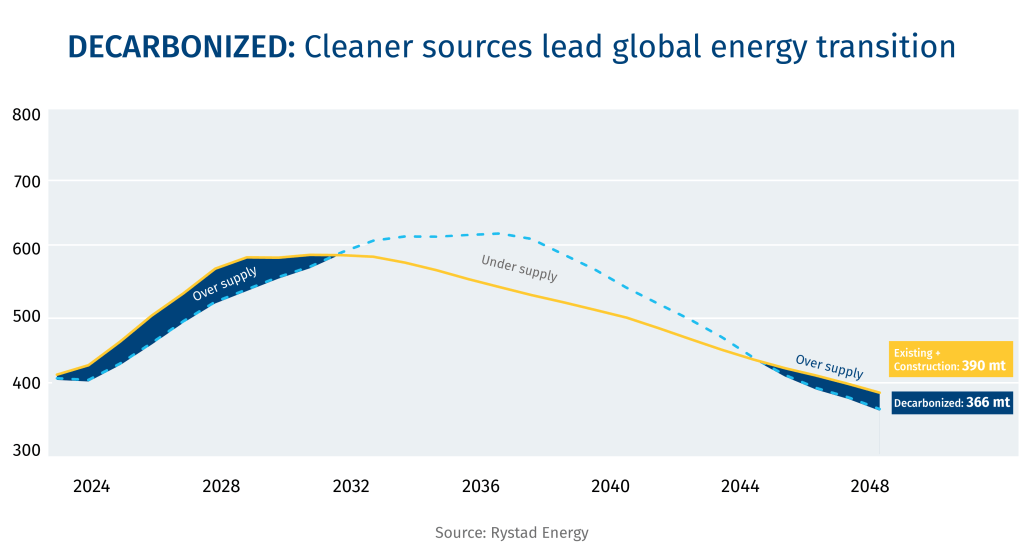
The outcomes suggested by each scenario are profoundly different. The range of our pathways shows that total global gas exports could grow from 411 mtpa in 2024 to as high as 737 mtpa by 2050—or shrink to just 366 mtpa. The net swing of 371 mtpa is nearly equivalent to current LNG exports.

The difference depends on whether the world develops more structured markets for gas, finds ways to connect fast-growing markets with reliable (and democratic) suppliers, and invests in technologies to cut emissions. The environmental attributes of this future gas supply—including the scale of transition to capture carbon and low-carbon derivative fuels like hydrogen and ammonia—will have a major impact on the direction of climate change, as methane emissions from gas are widely considered to be more dangerous to global warming than carbon, even though they’re also easier to contain.

The G7+ nations have an interest in securing long-term supplies of reliable and affordable natural gas, having experienced price shocks from the Western U.S. power crisis of 2000-01, the post-Fukushima disaster LNG price spike in Japan, the recent twin shocks of the Covid pandemic and Russia’s weaponization of gas exports in its war on Ukraine. A coordinated G7+ approach can stabilize markets through more cohesive policy alignment and joint investments around infrastructure.

Leveraging democratic, rules-based gas markets can ensure environmental standards across the supply chain, and further add to economic growth through industrial decarbonization, including investments in carbon capture, utilization and storage (CCUS), low-carbon fuels for industrial heat and heavy transportation, and a coordinated action plan on zero flaring and mitigation of fugitive methane emissions.

In a potential world where the Chinese market is inaccessible to the U.S., and India follows its own path—prioritizing price above all else, perhaps from Russian supplies—Asian demand will be vital to any G7+ strategy.

As such, emerging Asian markets including Pakistan, Bangladesh, Thailand and Indonesia, will be essential for the G7+ as they’re projected to consume a combined 219 mtpa by 2040, especially as they accelerate the switch from coal to natural gas.

To do all this, a G7 gas compact may be needed to lay the foundation for a robust and secure natural gas infrastructure that aligns with the needs of producers and consumers, delivering price stability, affordability, reliability, and lower greenhouse gas emissions. Such a compact could address the needs of a rapidly growing global gas world to develop more sophisticated markets and financial tools; to resolve infrastructure bottlenecks and coordinate national investment plans; and work collectively to ensure rapidly growing countries across Asia, Africa and Latin America have access to G7+ supplies, not only for economic growth but for geopolitical stability.

But the G7 and its core allies need to recognize the risks of some very divergent paths if a coordinated approach is not taken. Our modelling lays out four such outcomes.

Behind the scenes—our research approach

The research and methodology behind this paper is unique for three main reasons:

The research paired quantitative modelling with qualitative interviews and roundtable forums, including with senior officials in Canada’s federal and provincial governments, the private sector, Indigenous groups, international research institutions and multilateral development banks. The team engaged these experts individually and as part of convenings in Washington D.C., Vancouver, Ottawa, London, Beijing, New York, Calgary and Toronto.

RBC Thought Leadership spoke to more than 100 experts in Canada, the U.S., Japan and Europe to explore practical energy security solutions. These included representatives from the Asian Development Bank (ADB), the Bloomberg New Energy Finance (BNEF), Mokwateh, the First Nations Climate Initiative, Dr. Robert J. Johnston, Senior Director of Research, at the Center on Global Energy Policy, Columbia University, and Dr. Ken Koyama, Senior Managing Director, Chief Economist at the Institute of Energy Economics, Japan (IEEJ). RBC Thought Leadership partnered with Rystad Energy to collaborate on the data and modelling for this research.


The four scenarios were modelled for the purposes of developing robust recommendations for the G7+ heading into the Kananaskis meeting in June. We know that traditional forecasting methodologies fall short of capturing the complex drivers of change in our geopolitical landscape and energy systems. We mapped these drivers of change and developed a range of four distinct yet plausible futures against which to stress-test what a coordinated G7+ natural gas strategy could look like.

The scenarios are built on different variations of key drivers in the G7+ environment, including geopolitical stability, population and economic growth in emerging markets, digitization and data centre deployment, climate and energy policies, the role of international institutions and multilateral forums, fossil fuel production, manufacturing and supply chain distribution, the role of civil society, social cohesion and global gas demand.

Among our assumptions that span all four scenarios:

  • The world’s population will be approximately 9.2 billion, with significant regional variation depending on GDP, education and healthcare trends;

  • coal consumption will continue to decline in OECD countries;

  • continued growth of coal in Asia will offer significant potential for coal-to-gas switching;

  • oil will remain a dominant fuel for the transportation sector, particularly in emerging Asia;

  • nuclear generation will continue to have a strategic but overall minor role to play into the 2030s, with new builds expected in Asian markets such as China and in the U.S., particularly to meet growing demand from data centres;

  • renewables will enjoy exponential growth, particularly in solar and wind, as costs continue to decline;

  • global temperatures are expected to be anywhere from 1.8-2.2 degrees Celsius above pre-industrial levels.

The following scenarios are by no means a prediction of what the future will look like in 2040, rather, they represent a range of plausible futures.

  • Headline of the year: “Japan and China resilient to global gas price shocks

  • Fragmented, protectionist world order, with a further erosion of international institutions and growing influence of Russia and China as global powers.

  • Australia, Russia, Qatar and the U.S. dominate global gas production; concentrated gas supply subjects the G7+ to significant market risks and volatility as a supply gap emerges.

  • Technology growth is regionalized with China and the Gulf nations leading in AI and digital infrastructure that matches North America, driving gas flows to non-G7 markets.

Context

Divided 2040 is characterized by protectionism and regionalism, as the superpowers continue to recede from global alliances, opening the door to a world dominated by Russia for energy and resources, and China for technology and manufacturing. Concerns about energy security in the mid-2020s and early 2030s are now exacerbated by supply and affordability challenges. Multilateral institutions and alliances such as the G7 have limited influence over state actors. The U.S., China and other major global players have receded from international institutions and alliances, further embedding realpolitik and an increasing focus on national policy and borders. Energy security is one of the world’s primary concerns and has had a deep impact on emerging markets’ ability to industrialize and develop economically. A current boom-bust cycle leaves consumers exposed to volatile prices, while major producers such as the U.S., Qatar, Russia and Australia are vulnerable as customers avoid signing long-term contracts. As countries focus on addressing immediate energy security challenges, climate activism has given way to more extreme and violent civic action.

The Global Energy Story

Total power demand is up 66% in 2040 compared to 2025, driven by the industrialization of emerging markets, electrification of transportation, heating and industrial processes. Countries prioritize the deployment of energy systems based on renewables and clean energy sources such as nuclear and hydro, and while natural gas remains an important transition fuel, reliance on fossil fuels declines globally.

Global climate action from the late 2010s and early 2020s has slowed considerably, with only a handful of European countries strongly dedicated to the cause. While this world remains divided, climate progressivism still endures. Global companies and capital remain directionally committed to a net-zero target. Emissions, on a gradual decline for the remainder of the century, are due to hit net-zero by 2096 as temperatures are limited to 2.0C, an outcome marginally out of bounds of the Paris Agreement.

South Korea and China continue to lead as technology innovators and providers, while other nations are falling behind in the AI revolution and remain mere buyers of those technologies. Global data centre energy demand is about six times what it was in 2025. Technological development is increasingly influenced by regional powers, leading to divergent standards and ecosystems. This fragmentation hampers global interoperability and exacerbates geopolitical tensions. Efforts by Gulf nations to fast-track AI infrastructure deployment as set out in the mid-2020s have come to fruition. The UAE continues to have the highest public cloud spend per employee in the region and is now firmly established as a global AI leader, with Saudi Arabia and Singapore also in the forefront. Given China’s diversification of gas supply and acceleration of domestic production efforts in the mid-2030s, the Gulf and China are strong rivals to the G7 nations when it comes to clean technology innovation and digital infrastructure.

The LNG Story

The world needs to find 207 million more tonnes of LNG by 2040, relative to current capacity and supply under construction. Industrialization of emerging markets like Indonesia and India has been constrained due to the lack of affordable energy supplies. The rise of technological infrastructure in South Korea, China and the Gulf, however, provides a strong demand signal for consistent, growing natural gas demand that peaks in 2038. A supply gap emerges, and gas consumers are subject to market volatility with pricing predominantly influenced by incumbent suppliers—the U.S., Russia, Qatar and Australia—that hold a concentration of supply. The U.S. remains the world leader, bringing on more LNG than Russia and Australia through the 2030s. Other members of the G7+ are subject to market volatility as prices fluctuate, controlled by leading producers and subject to regional market disruptions.

Technology leaders such as South Korea, India and China remain dependent on non-democratic sources such as Russia for the majority of their energy supply to power data centres and digital infrastructure. The global landscape of AI data centres and digital infrastructure, ownership and operation are led by technology leaders. And while developing nations still gain access to AI tool sets, they have little say in setting standards and experience increasing bias and unfair terms from technology providers.

  • Headline of the year: “Indonesia’s new robot factory stalled by global gas shortage

  • Rise of regional conflicts and a global economic downturn in the late 2030s has led to a highly fragmented world.

  • Fossil fuel dependence continues to rise alongside rising demand for LNG.

  • With a significant energy supply gap emerging, Gulf states experience major growth.

  • Energy security dominates policy agendas, distracting from climate action, while national agendas prioritize trade weaponization and geopolitical leverage in the interest of security.

Context

In Dystopian 2040, regional conflicts and a protracted global economic downturn experienced in the late 2030s have led to an erosion of international institutions and the post-WWII global order. International protocols around the rule of law and global security are unenforceable and stuck in a quagmire of indecision and veto power. A failure of any country or international institution to meaningfully act in the face of growing aggression out of occupied Ukraine and the Middle East has resulted in violent and authoritarian regimes redefining the world stage. In economies like the U.S., fearmongering, protectionism and hardline authoritarian rhetoric has led to a declining global presence. The EU is dominated by protectionist policies, focusing on local economies and a handful of key trading relationships to buffer the impacts of regional conflicts. Security dominates national policies and agendas, with nationalist policies creating a bifurcated trade and investment climate. China’s imposition of export restrictions on rare earth elements in the mid-2020s set the stage for a growing trend of supply chain control, particularly in technology and defence sectors. As a result of closed borders and bloc-style co-operation, international trade is limited to small clubs of countries, who limit market access, building on the techno-nationalist policies of the late 2020s to bolster independence from foreign supply chains and competitiveness on semiconductor production. Rising unemployment due to a global economic downturn and a growing technological divide means that there is a rift among those who have access to digital infrastructure and those who do not. In a world where civil society and institutions are characterized by high levels of mistrust and a lack of coordination, the G7 struggles to build energy resiliency and withstand periodic energy supply and demand shocks.

The Global Energy Story

Climate change, alongside regional and protracted conflicts, creates fresh waves of humanitarian crises. The phrase “energy transition” has almost been forgotten, while national security agendas dominate the narrative around energy systems. Global sentiment is heavily tied to energy security, driving demand for low-cost fossil fuels such as oil and coal, at the expense of managing emissions. Fossil-fuel rich Gulf nations experience significant growth as they support Asian economies, and unlock a wealth of state capital increasingly oriented towards a data economy. Globally, increased nationalism and national security concerns lead to a decline in multilateralism. Coalitions like the Paris Agreement fade in significance as the pursuit of cheap energy and economic recovery dominate priorities. The weaponization of trade becomes a common occurrence—even an expected phenomenon as the competition between nations spreads into new spheres. Expect increased militarism and protectionism.

The LNG Story

Natural gas demand is up 16% from 2025 levels. These numbers are tempered by demand for other cost-effective fossil fuels like coal, which remains a core part of energy systems (22% of total primary energy). Global fossil fuel demand continues to rise beyond the original 2030 projections with no sign of slowing into the 2040s. As climate goals take a back seat to national security, coal-to-gas switching in Asia does not play out as predicted in the late 2020s. Energy and national security challenges lie ahead, with projected supply shortages limiting global economic growth. By 2040, an incremental 225 million tonnes of LNG—equal to over half what the world produced in 2024—is required on top of current and in-construction supply.

  • Headline of the year: “G7 Methane Club Declares Victory at 15th Anniversary of Kananaskis

  • Climate security dominates global policymaking, with aggressive emissions reduction targets.

  • Global power demand more than doubles, driven by industrialization and digital infrastructure. Renewables and clean-tech solutions take the lead to meet demand.

  • LNG demand declines, presenting the risk of stranded assets.

  • Remaining gas supplies are governed by the emergence of a clean gas market, with methane performance tracking to meet demand for abated natural gas.

Context

In Decarbonized 2040, aggressive climate policies and targets dominate the international landscape, as the world’s leading economies race to cut emissions and secure a more cost-competitive energy supply. Climate security is the pre-eminent focus shaping energy policies as destructive climate events became increasingly difficult to ignore by the 2030s, shaping voter preferences and civic action, and leading governments to re-invigorate global cooperation and international institutions. There is a meaningful return to global climate targets and the creation of new market mechanisms to unlock value from decarbonization. This includes the emergence of a clean fuels and certified natural gas market, underpinned by the measurement and tracking of methane emissions. Carbon capture is on track to reach three billion tonnes sequestered by 2050, equivalent to four times Canada’s total emissions in 2025. Millennials and GenZ, now in critical leadership roles in organizations, are driving the decarbonization agenda across governments and institutions. Civil society, too, is characterized by strong, diverse voices who are active in holding institutions accountable to their climate commitments.

The Global Energy Story

Total power demand is up 66% in 2040 compared to 2025, driven by the industrialization of emerging markets, electrification of transportation, heating and industrial processes. Countries prioritize the deployment of energy systems based on renewables and clean energy sources such as nuclear and hydro, and while natural gas remains an important transition fuel, reliance on fossil fuels declines globally.

While China has maintained its position as a clean technology manufacturer and intellectual property leader, the West’s investments in clean technologies through the 2030s begins to pay off, with a more distributed global supply chain that leads to greater resiliency and lower costs.

Countries that developed small modular reactors (SMRs) in the 2030s—Canada, the U.S., Argentina, Poland, Romania and China—are exporting that expertise around the world to countries seeking clean and reliable energy. Electrification is a clear winner, too, allowing for the displacement of direct-use emissions and an increase in energy efficiency. Oil demand falls almost 60% from current levels to 43 million barrels per day by 2050—a level not seen since 1969. Natural gas demand, while falling, remains more resilient, down 33% from current levels.

The LNG Story

The maturity of carbon markets, border adjustment mechanisms and a “methane club” across G7+ buyers and sellers drives a robust certified natural gas market. Throughout the 2030s, governments and industry leaders worked to develop clear and transparent market regulations, as companies were incentivized to reduce methane emissions and sought to differentiate themselves based on performance. National regulations in G7+ countries are grounded in a multilateral G7+ natural gas strategy, which enables global trade and methane measurement. Significant innovation around satellite technologies has enabled more effective methane tracking and robust data sets, enabling greater consistency of methane tracking than the world saw in the 2020s. There is a risk that existing LNG infrastructure becomes stranded, as the world’s leading economies shift to alternative energy sources and LNG demand declines. Global LNG demand declines rapidly by 2040 such that the world does not require any net new LNG by 2050 relative to existing and in-construction supply. Existing natural gas supplies from G7+ sources have a competitive advantage among climate-minded buyers looking for hydrogen/ammonia and abated gas. Multilateral development banks like the Asian Development Bank have supported energy efficiency improvements in gas distribution and gas power plants as well as coal-to-gas switching projects in Asia.

Net-zero likely occurs in the mid 2070s, with a projected temperature rise of 1.8C. However, further efforts such as requiring a 30% decrease in carbon intensity of natural gas production post-2030 could result in a further 40-45 billion tonnes of incremental CO2e avoided in this scenario by 2100.

LNG: An opportunity for reconciliation

Canada’s LNG opportunity cannot be capitalized without Indigenous partnerships and participation. Most of the land connecting the country’s major gas fields to the Pacific Coast are unceded territory, claimed by, or ratified through, treaty to First Nations in British Columbia. This is a huge opportunity for reconciliation—one that’s already being slowly realized. Cedar LNG and Ksi Lisims, two West Coast projects that will add 15 mtpa to Canada’s export capacity, have significant Indigenous ownership through the Haisla and Nisga’a Nations, respectively. By cultivating meaningful Indigenous partnerships and developing models for Indigenous capital, capacity and consent, LNG can be an opportunity for shared prosperity, while allowing Canada to meet the moment and expedite major projects quickly.—Varun Srivatsan

  • Headline of the year: “G7+ agreement to connect Earth with low-orbit data centres

  • The world is dominated by coalitions of like-minded nations, and multilateral institutions are reinvigorated.

  • A dual-energy trajectory emerges as renewables scale rapidly with global climate funds while LNG demand continues, driven by Asian industrialization and coal-to-gas switching.

  • Global supply chains and trade are more evenly distributed and resilient, with the G7+ coalition solidifying its influence in LNG and manufacturing in an effort to counter China’s dominance over supply chains.

Context

In Democracy 2040, the world features strong coalitions among like-minded nations, with a growing effort to counter the fragmentation seen in the late 2020s and early 2030s. Multilateral institutions are experiencing a renaissance, undergoing a shift in their governance and structures to address frequent and critical global challenges. There are a few dissenting and regionally-focussed nations, as we saw during a decade-long retrenchment of international institutions that continued through the late 2020s and early 2030s. The international landscape is now dominated by coalitions of democratic countries in the G7+ to counter China and Russia, and ensure resilience in critical sectors of the economy such as advanced manufacturing, defence and energy. The most recent G7+ Agreement enables G7 gas importers and allies such as South Korea to secure gas supply for power data centres and digital infrastructure needed to power the next generation of AI technologies. As renewables continue to scale, gas has a critical role to play to serve demand peaks in big cities and support resiliency of electricity grids. The G7+ cooperation on natural gas has reduced gas market volatility, compared to the 2020s. Without a robust clean gas market, however, tensions remain between EU countries and the rest of the G7 members, who have compromised on meeting emissions targets in favour of affordability and resiliency. The global public square is robust in democratic countries, with civil society organizations advocating for greater collaboration and cooperation between countries with shared values and renewed commitments to bold climate goals. However, system-level oppression of civil society actors and voices in non-democratic states creates a global divide between liberal democracies and the rest of the world.

The Global Energy Story

Progress on climate is slow to start in the 2030s, but the Green Climate Fund is beginning to have real impact on climate mitigation and climate action. Contributions from both the global south and the G7+ mean that in 2040, the Fund has reached $800 billion worth of leveraged investments with a total of 25 billion tonnes of avoided emissions. The Green Climate Fund is only one example of a general sentiment that shifting away from fossil fuels is inevitable and renewables’ share of the global energy mix continues to increase exponentially. The rapid adoption of cost-competitive renewable energy sources and the G7+’s coordinated strategy on natural gas helped the West secure energy supplies for rapidly growing economies like Indonesia and India.

Global trade and supply chains are diversifying in 2040 through international and regional trade agreement. Mutually beneficial friendshoring and reshoring in a systematic, orderly fashion provides policy certainty and unlocks capital for critical infrastructure. For the G7+, diplomacy among its members helps develop common ground for climate-minded economic growth, which in turn secures its geopolitical presence in South and Southeast Asia, countering growing Chinese influence.

Technology leadership is spread across a range of competitive states, including continued leadership from China, the U.S. and the United Arab Emirates, as in the mid-2020s. But a renewed commitment to multilateral institutions has resulted in robust global pacts such as a Global Digital Compact that seeks to democratize access to AI and the energy sources needed to power a new data economy.

The LNG Story

Access to resilient natural gas supply through the G7+ coalition unlocks greater adoption of AI and energy needs for greater industrialization across Asia. Japan, Thailand, Korea, and India are major demand centres as an Asian renaissance dominates global LNG demand through 2050. LNG demand reaches 692 million tonnes by 2050—and is still rising as global economic growth drives demand. The climate impact of this reality is mitigated by the maturity of methane capture technologies and demand for abated gas by ethical buyers like Japan. However, a global clean gas market hasn’t emerged in the way experts predicted in the late 2020s. Clean gas market mechanisms are adopted by smaller coalitions of states and in bilateral or multilateral trading relationships. Growing carbon markets among the G7+ ultimately enables both energy transition and greater gas supply, which allows for growing natural gas demand rooted in significant coal-to-gas switching in Asia. While the G7+ coordination on a natural gas strategy enables access to resilient supply and demand within these countries, China continues to play a significant and growing leadership role in clean technologies and manufacturing, posing a major risk to the G7+ who actively seek these technologies to meet their climate commitments.

As the G7 host and the world’s fifth-largest natural gas producer, Canada is uniquely positioned to shape the future of natural gas by advancing its own economic and climate goals and supporting global energy security.

But there are several roadblocks that’s holding back natural gas. First, G7+ member nations — the core group plus allies like Australia and South Korea — are not aligned on gas’s role in the future of energy markets. Major producers like Canada and the U.S. need contract security to build up infrastructure and strategic supply. But consumers such as France, Japan and Britain want contract flexibility and diversified supply sources to hedge their risks and meet climate targets. Another layer of complexity comes with Canada, Germany, Italy, Japan and the U.S. favouring natural gas, while France and Britain support greater use of hydrogen, nuclear and abated gas to achieve climate goals. Moreover, climate-minded governments in Australia, Canada, France and the EU also don’t see eye-to-eye with the U.S., which sees fossil fuels driving its energy dominance.

A coordinated and cooperative policy framework adopted by G7 members can facilitate the creation of a more resilient natural gas and LNG market that reduces price volatility, unlocks capital, increases diversified supply and de-risks demand, and enables the eventual transition to a decarbonized gas market.

Here are some action-oriented approaches that could help the G7, through its energy ministers, move toward a democratic and decarbonized future for gas:

1. Declare a G7 compact to support decarbonized natural gas

A G7 policy compact that defines the role of natural gas and related fuels across a range of energy demand scenarios can help break the boom-and-bust cycle of prices and investment. It can also signal investment and financing of gas infrastructure sufficient to meet the expected supply gap identified in three of the four scenarios outlined in this paper.

G7 governments should also work to end the debate over whether natural gas is a solution or contributor to climate change. It’s both. In the short to medium term, coal-to-gas fuel switching, methane intensity reduction, and deployment of gas as an intermittency solution for renewables make a significant contribution to climate action. Over the longer term, governments need to work with industry to secure a commitment to new pathways to develop abated natural gas pathways, which may be required across all scenarios.

2. Develop a stable, well-functioning global gas market

The LNG market has evolved dramatically over the past decade, from a series of regional markets anchored mostly by long-term, oil-indexed contracts to something more dynamic and global.

In these ways, the LNG market is starting to resemble the global oil market which has become deep, resilient and highly liquid since the 1980s, offering a wide range of contracts, price benchmarks, and risk management tools for both physical and financial markets. These features mean that oil prices, while volatile, have a greater capacity to absorb shocks and rebalance.

Despite progress, the LNG market still has a ways to go to become sufficiently global and liquid to attract price-sensitive importers and risk-averse capital providers. Price spikes in 2022, in the midst of the Russia-Ukraine conflict, were dramatic and damaging for consumers, leading to a rebound in coal demand in Asia and shut-ins of gas-intensive industrial production in the EU.

A key feature of a G7 gas compact should be to further develop a tradeable market with both financial and physical participants, which in turn derisks capital, reduces capital costs and incentivizes further investment. More financial, or non-commercial participants, can help expand liquidity and bring in new pools of capital.

The global LNG market also needs effective and transparent reference prices. The emergence of such benchmarks with variance in duration and indexation can anchor a well-functioning market. This includes the ability to structure contracts to trade LNG cargoes using a range of markers across varying periods of time to avoid exposure to a single formula based on Henry Hub or Brent benchmarks. G7 countries should look to build on existing efforts such as the Japanese-led Producer-Consumer Dialogue.

Methane-tech: Reining in a potent gas

Natural gas is predominantly made up of methane, a powerful greenhouse gas. Lowering methane emissions in the LNG value chain—from wellheads to carriers to regasification terminals—is seen as a key driver of environmental performance for companies. This is especially critical as methane is 28 to 36 times more potent than CO2 over a 100-year timespan.

Several technologies can help plug leaks from LNG infrastructure: this includes tech that can detect (through satellites, airborne and on-ground sensors), contain (through vapour recovery units, low-bleed pneumatic devices), or combust (high-efficiency flare stacks) methane. Emissions can also be reduced by replacing gas-powered devices such as compressors with electricity driven equivalents, freeing up the gas for shipment.

Several technologies and policies are already making a difference. In the U.S., methane emission intensities dropped across natural gas processing (30%) and transmission and compression (33%) facilities between 2014-23, according to Environmental Protection Agency (EPA) data. Norway, meanwhile, has the world’s lowest emissions intensity driven by policies such as a ban on non-emergency flaring as far back as 1971, and a venting and flaring emission tax imposed in 2015.

However, precise measurement of methane emissions remains a challenge, with estimates subject to widespread uncertainty and underreporting. As methane measurement advances (for example, through satellite-based monitoring, of which more than a dozen satellites are in orbit today), operators and regulators can further constrain emissions, lower measurement uncertainty, and take appropriate mitigating action.

Some methane mitigation technologies can also allow oil and gas producers to capture methane and feed it back into the gas chain to lower emissions. In North America, for example, leak detection and repair (LDAR) technologies and improved equipment maintenance practices can conservatively avoid up to 55 million metric tons of carbon dioxide equivalent (MTCO2e) in methane emissions annually—the equivalent of taking 13 million gas-powered cars off the road.-Vivan Sorab

3. Invest in decarbonization to cut emissions with new technologies 

A G7+ gas compact should not be an endorsement of business-as-usual practices. Action on methane mitigation is critical alongside pathways to carbon-neutral fuels derived from natural gas.

The elimination of fugitive emissions and routine flaring/venting from the natural gas value chain is embedded in the Global Methane Pledge, which is central to the natural gas industry’s hopes to be aligned with a low-carbon future. It can be business-friendly, too, as mitigation costs are generally low and even net-positive in cases where fugitive gas can be captured, processed, and sold.

The G7 can play a critical role in supporting the deployment of measurement, monitoring, reporting, and verification (MMRV) protocols for methane emissions. The EU is leading such efforts through the rollout of its Methane Regulation, which requires the energy sector to document the methane intensity of fossil fuel imports, as a precursor to implementing a shift to lower methane-intensity fuels. This can be a differentiator for LNG sources, and involve major consumers such as Japan and South Korea to adopt regulations similar to the EU, while producers like Canada, the U.S., and Australia align on timelines and technology/policy pathways for rapid reductions in methane intensity.

The pathway to carbon neutral fuels should include the application of carbon capture and storage (CCS) technology to the production of ammonia, methanol, and hydrogen products. CCS technology will also be integral to preserving long-term demand security for natural gas in power generation as industrial production decarbonizes.

Energy security generally depends on the diversification of energy sources by fuel, technology, and geography. Clean electricity is essential to achieving a low-carbon economy, but maintaining a diverse, resilient system will require other sources including nuclear, bioenergy, offsets, and carbon capture. Low and zero carbon fuels can also support the decarbonization of industrial production processes such as steel and cement production that require higher temperatures. Canada and the U.S. can also partner with G7+ countries to decarbonize bunker fuel markets by switching to ammonia or methanol. Recent data from China shows a pathway to displace diesel in trucking with LNG, a pathway that could further evolve to clean hydrogen.

4. Promote new financing tools for developing economies to invest in clean growth

LNG’s status as a fossil fuel and its inherent price volatility as a commodity, along with its capital-intensive nature, presents project financing challenges. Developing countries tend to require large-scale infrastructure to import and store LNG and convert it from liquid to gas, to be shipped to internal markets. Most require concessional financing. A clear G7+ policy signal, providing greater acceptance of natural gas can unlock financing across a range of institutions, including multilateral development banks like the International Finance Corporation (IFC) and European Bank for Reconstruction and Development (EBRD), national export credit agencies such as Export Development Canada and private sector banks and asset managers that have excluded natural gas investment for fear of “locking in” emissions or being misaligned with Paris Agreement objectives. Supportive policies should stress the above-mentioned compact among G7 member states and commit to derisking and decarbonization the natural gas sector.

The continued evolution and progression of Article 6 of the Paris Agreement and the use of Internationally Transferred Mitigation Outcomes (ITMOs) such as Japan’s Joint Crediting Mechanism (JCM) also provide avenues for new financing methods based around the transfer of carbon credits generated from investments in methane reduction, coal-to-gas switching, or bunker fuel to clean ammonia.

However, the current Article 6/ITMO framework is not fit for purpose for natural gas or for trade between developed countries. Nonetheless, the spirit of “carbon clubs”—and creating shared incentives for natural gas-linked carbon reduction projects among G7 members—could be used to create financeable revenue streams for projects. These measures could be further complemented by programs such as Japan’s GX bonds, and South Korea’s climate funds could also co-finance LNG aligned with energy security and emissions transitions.

The use of certified natural gas can further demonstrate a clear pathway to decarbonization and alignment on values within G7+, in turn reducing project finance risks and improving project economics through enhanced pricing and offtake, and enabling access to transition finance.

Japan’s Emissions Trading Opportunity

Launched in 2023, the GX-ETS is a central component of Japan’s strategy to achieve carbon neutrality by 2050 and support industry decarbonization through a phased approach. Auctioned carbon credits support the repayment of Climate Transition Bonds (GX Bonds) which support transition-focused spending in areas such as hydrogen, ammonia, carbon capture, and EV infrastructure. These sovereign bonds aim to raise approximately ¥20 trillion (US$150 billion) by the early 2030s, catalyzing greater capital mobilization of approximately ¥150 trillion (US$1 trillion) in public and private investments.

While its focus is on domestic decarbonization, Japan has expressed interest in securing clean energy and low-carbon supply chains abroad and in funding the development costs of clean technologies.

Canada can benefit significantly by aligning its clean fuel exports—especially LNG and hydrogen—with Japan’s GX goals, provided projects meet Japan’s standards on carbon intensity, transparency, and reliability.

Here’s how:

  • Japan’s GX policy accepts low-carbon LNG—particularly if paired with methane abatement, CCS, or certified emissions standards—as transition-aligned. Canadian LNG could qualify for long-term GX-aligned supply contracts, if emissions reductions are verifiable.

  • Japanese investment via GX Transition Bonds, especially in infrastructure such as liquefaction and CCS-enabled transport. The country is already engaging Australia and other countries for clean ammonia. Canada’ low-carbon certified energy products can tap several opportunities including financing through GX Transition Bonds and Japan’s Joint Crediting Mechanism (JCM)—a bilateral initiative launched by the government to facilitate GHG emission reduction in collaboration with partner countries.

  • Canada can also participate in Japan’s plan to scale imports of green and blue hydrogen and ammonia for power and industrial use, given Canada’s potential to produce green hydrogen, and several hydrogen hubs under development in Alberta and Newfoundland and Labrador. Blue hydrogen, through natural gas with CCS potential, could emerge as another opportunity.

  • Japan’s economy also needs power to maintain its edge in computation and digital infrastructure. Data centres, AI and digital infrastructure are going to depend on natural gas. — Robert J. Johnston.

5. Create a Centre of Excellence to share market insights, technologies and best practices

The U.S. and Canada have strong incentives for cooperation on natural gas. The two countries have deeply integrated domestic markets, growing demand for gas-fired electricity to support reindustrialization and data centres, and a shared need to ensure growing exports do not lead to higher prices at home. Increasingly, as LNG exports from North America grow, the incentives for cooperation and coordination across the G7+ loom large.

The G7+ can advance these interests through a new organization to provide follow-on technical and policy action to support the implementation of a decarbonized and derisked natural gas market. Canada would be an excellent location for such a centre, given its role as the host of the 51st G7 leaders’ summit, longstanding commitments to climate action, technical expertise in horizontal drilling, methane capture and electrification, and growing role as a producer.

The Centre could sponsor technical, applied research in areas like methane mitigation, lower cost ammonia and hydrogen fuels. Equally important would be policy research and financial innovation supporting areas such as regulatory project assessment, community benefits sharing, methane MMRV, and sustainable/transition finance to support developing countries. The Centre could further embrace analysis of carbon market development, including markets for certified natural gas.

A G7 Centre of Excellence would be a clear signal from the world’s leading natural gas producers and consumers of their commitment to a derisked and decarbonized global gas market.

Certified gas: The gold standard

Several natural gas certification programs underwritten by independent third parties have emerged in recent years. North American operators Project Canary, Equitable Origin (EO), and MiQ (Methane Intelligence) play a meaningful role in certifying the carbon, environmental and human-rights credentials of natural gas.

In North America, about 30% of natural gas is currently certified to EO and MIQ. A third of production from Canada’s Montney basin is certified, as is two-thirds of contracted supply of the soon-to-launch LNG Canada. Over half the production from the Utica and Marcellus in the northeastern U.S. is certified as well.

For methane, where leaks often go unreported, producers certify natural gas volumes to MiQ as a way of highlighting the low carbon pedigree of their molecules. Additional environmental and social performance aspects that exceed regulatory minimums such as Indigenous equity participation and water use minimization are captured under the EO standard, largely consistent with disclosures that would be required under the EU’s emerging Corporate Sustainability Reporting Directive. The theory is that that these environmental and social attributes would lead to higher prices or, at a minimum, better market access.

The certified market is in the early stages of development, but the outlook for certified natural gas and potential regulatory catalysts could drive a bigger, more liquid market. If enough countries jointly developed and implemented a methane-intensity requirement (or broader certification standard) that exceeded the volume of certified natural gas, then the value of the certifications would increase and further incentivize emissions reduction.

Finally, field-based audit by industry experts following increasingly well-defined assurance processes consistent with ISO and IFRS norms adds rigour and a paper trail to claims of higher commitment and associated performance on the ground. Certifications can also assist in reducing project finance and insurance risk premiums, improving project economics through the potential for enhanced pricing and offtake, and enabling access to transition finance. Dr. Robert J. Johnston

The Big 5: The power sources that fuelled the global economy over the past 25 years

Coal

2000: 24% of global market share
2024: 26% of global market share

Global coal consumption has risen 67% since 2000, with growth in Asia more than offsetting declines in Europe and North America. China alone accounted for 74% of Asian growth. While Chinese consumption is expected to decline, rising consumption in India and Southeast Asia means coal will remain a critical energy source in Asian economies.

Oil

2000: 37% of global market share

2024: 31% of global market share

Global oil consumption is up almost 30% since 2000, with China accounting for over half of global growth. North American and European consumption is largely flat, with growth primarily coming from emerging markets. Transport across road, marine and shipping has represented almost 80% of global oil demand growth since 2000. Still, oil’s dominance within global energy systems continues to fall.

Nuclear

2000: 7% of global market share

2024: 5% of global market share

Energy generation from the technology has remained relatively consistent over the past quarter century, with declines in the developed world offset by new capacity in China. New nuclear power plants proposed and underway in Asia, revival of nuclear power plants in Canada and Europe, and new reactor designs in the U.S., largely driven by the electricity needs of data centres, could offset historical declines in nuclear.

Renewables

2000: 10% of global market share

2024: 13% of global market share

Wind and solar generation has grown exponentially from negligible levels in 2000, boosting total renewables (including hydro and biomass) global primary energy market share to 13%. Growth in other renewable generation sources such as geothermal are also growing moderately.

Natural Gas

2000: 22% of global market share

2024: 25% of global market share

Gas has boosted its market share over the past quarter century on rising demand from several economies. The power sector’s shift from coal to gas has also spurred demand and helped lower emissions for several countries, including Canada. Since 2000, 50% of gas growth has come from the power sector. Another 12% from the energy industry and another 8% from the residential sector. As a critical feedstock for petrochemicals, gas was also at the centre of a plastics boom. The globalization of LNG markets, with several new countries building LNG import terminals, has also driven demand.

All data sourced from BNEF World Energy Outlook

The Growth Project

The report is part of RBC’s Growth Project, an initiative to spark new ideas for the Canadian economy. For more on the Growth Project, click here.

Sign up here to receive RBC Thought Leadership’s newsletter, flagship reports and analysis on the forces shaping Canadian business and the economy.

Download the Report

Subscribe to RBC Thought Leadership

All data from Rystad Energy unless otherwise mentioned. Rystad gas and LNG data is sourced from Rystad’s Gas and LNG Macro Solution module. Rystad energy and emissions data is sourced from Rystad’s Energy Scenario Solution module.

Please refer to Behind the scenes-our research approach section for more details on the research collaboration.

1. McKinsey & Co.
2. International Energy Agency
3.The Institute of Energy Economics, Japan, 2025 Outlook

rbc_toc_for_mmm_action

Key Points

More than 100 mineral projects, valued at $107 billion, are at various stages of development in Canada over the next ten years. Unlocking that potential requires diversified capital flow, both domestic and foreign, for Canada to emerge as a commodity powerhouse.

With Chinese capital constrained by stricter federal rules, American capital is the natural partner to help develop Canada’s mineral resources, given the two countries’ geo-strategic alignment. Still, recent bilateral trade tensions with the U.S., suggest Canada should be clear-eyed entering into new partnerships and diversify capital sources to derisk projects.

If part of a broader security framework, Canada can position itself as a key pillar of the U.S.’s focus on breaking China’s hold on the supply chains of several commodities critical for defence, energy and high-end manufacturing. New cross-border commodity supply chains could serve as the bedrock of a North American high-end manufacturing, defence and energy infrastructure revival.

Building metal and critical mineral projects requires patient, long-term investors who can guarantee either long-term offtake agreements or security of demand to ensure their economic feasibility. To derisk projects, Canada could broaden its capital base beyond the U.S. and tap various global sources of foreign capital that are on the hunt for strategic assets—provided they meet Canada’s national interest and energy security thresholds.

Canada in the Great Resource Game

Canada’s vast natural resources present compelling investment opportunities. Crucially, they’re becoming strategic assets for G7 and other allies in a fragmented world.

Mineral development also gives Canada an opening to service several core verticals—automotive, energy equipment, defence, and high-end manufacturing. With the right strategy, Canada can position itself as a new manufacturing supply chain hub in a geopolitically-charged world, as we wrote in The New Great Game.

But injecting geopolitics into the minerals development space is a double-edged sword.

This was evident in recent years with China, a major supplier of foreign direct investment (FDI) in the global mining sector. Its involvement in Canadian minerals over the past few years have come under strict scrutiny on security concerns—coming to a head in 2022 when Ottawa ordered three Chinese entities to divest from three Canadian mining companies. The move has largely frozen Chinese interest in Canada’s minerals’ sector.

American companies are seen as more natural partners for Canada to develop mineral resources, given the countries’ long-standing geopolitical alignment. Despite the U.S. trying to squeeze Canada on trade, defence and several sectors such as lumber, automotives and steel and aluminum, the synergies on metals and minerals could be strategic for both countries. Recent U.S. rhetoric aside, there is a sense that collaboration on several metals and minerals supply chains would fortify North American energy and national security.

Trump charts a new direction

Washington’s approach to minerals development is still being laid out.

Signals indicate that the U.S. is poised to act decisively on critical minerals1 and other resources it considers vital for defence, technology, and semiconductors. The White House has fast-tracked 10 mining projects, signed an executive order aimed at stepping up deep-sea mining within U.S. and international waters, and floated the prospect of investing directly in mining companies, including through a proposed U.S. sovereign wealth fund.

Capitalizing on Canada's mineral bonanza

U.S. President Donald Trump’s hawkish stance on resource-rich Greenland, the recent signing of a minerals deal with Ukraine, and interest in one with the Democratic Republic of Congo, suggests minerals are a strategic asset in the U.S. quest to counter Chinese dominance.

Canadian Prime Minister Mark Carney’s interest in connecting trade talks with U.S. national security, dovetails with American interest in energy and minerals development. As recently as December2, the two countries had invested in a critical mineral project in Yukon, part of a broader bilateral collaboration under the Canada-U.S. Joint Action Plan on Critical Minerals Collaboration and the Canada-U.S. Energy Transformation Task Force.

The U.S. and Canadian governments have already injected billions in capital into the space. Between 2021-2024, the U.S. government funded at least 24 critical minerals and materials projects, including five in Canada jointly with the Canadian government. Ottawa has also funded at least another five projects as of early 2024.

While Canada is keen to partner with its American counterparts on mineral development, it has taken measures in recent months to place some guardrails over its assets in a world that’s become more transactional and unpredictable. In March 20253, the Innovation, Science and Industry Ministry, responsible for Canada’s investment review, expanded the criteria for national security review to include economic security, in a move seen directed at the U.S. And in April 2025, the Government of Ontario introduced new measures “to prevent foreign governments or corporations from claiming Ontario’s critical minerals.”4

Securing geo-strategic capital

To further derisk its resource base, Canada should tap into a wide variety of capital that’s on the hunt for strategic assets.

The Canadian mining sector is already a major capital magnet. There are currently more than 100 mineral and mining major projects underway in Canada at various stages of development (announced, in review, approved or under construction) valued at more than $107 billion in capital, according to the Natural Resources Canada’s major projects database. And the list has ballooned in recent years as interest in Canadian resources has grown.
But where will the capital come from?

As miners gear up for future development, they could tap four sources of capital: self-financing, global equity markets, foreign state-owned entities, and sovereign wealth funds (SWF)— each aligned to different investment horizons and risk appetites.

Foreign capital is already a well-established feature of Canadian mining, making up around 40-45% of investments flowing into the sector over the past few years.

Self-financing: Over the past two decades, capital raising for the minerals sector has been challenged as mining and mineral companies have lagged both the underlying commodity and the broader index. Across equities specifically, this underperformance is even greater on a risk-adjusted basis given the lower volatility in returns for both the S&P/TSX Composite and the S&P 500.

This has emerged as a key financing challenge for companies. Yet a new commodity super cycle, driven by geopolitical and energy transition dynamics, could drive renewed investor interest in the sector.
Despite the market underperformance, Canadian miners are generally in good shape to partially fund projects. The sector enjoys financial strength and discipline as evident from its 0.7x capex-to-cash-flow over the past 12 months (compared to 1x in the past 10 years), indicating that funds are available to invest, while the debt burden has also fallen considerably in recent years5.

All told, the S&P/TSX metals and mining firms have accumulated as much $14 billion in excess cash flow over the past 12 months, ready to be deployed globally6. While Canada could attract a portion of that, companies will still need to tap into a variety of other capital sources to finance projects.


Equity markets: Public equity markets remain a viable capital source. New corporate equity issuance is also an attractive option from institutional and Western capital, majority of which is composed of passive or long-only funds. While investor risk appetite has been lukewarm, new macroeconomic and geopolitical drivers, coupled with strong company balance sheets could shift investor sentiment.

State and SWFs: Sustaining some of these projects with long gestation periods require geopolitical actors that take a long-term view on strategic resources. They are already on the hunt: between 2022-2024, we estimate that about 20% of global mining M&A originated from sovereign wealth funds (SWFs). The share of state-linked transactions was almost certainly higher, since the majority of China’s 18% share of global deals would have been done through its state-linked corporates.

State capitalism extends beyond sovereign wealth funds, and could include corporations that are linked to or championed by governments.

Among such state-owned entities, not all actors would be classified as high geopolitical risk like those from China, in terms of threatening market control or transferring minerals’ intellectual property (IP). Clean energy infrastructure funds linked to public pensions funds, sovereign wealth funds or large private equity firms are also eyeing opportunities in mining. Canada’s well-capitalized pension funds could also play a role here.

Other deep-pocketed investors—such as Middle Eastern sovereign wealth funds and state-owned entities—could be more active in the future. While an important source of capital, they could pose security challenges, ranging from shifting geopolitical alliances or bilateral diplomatic spats, such as Canada’s diplomatic fight with Riyadh in 2018 over Saudi Arabia human rights record.

Containing China

The issues around security of strategic assets cannot be underestimated, and will only gain more traction, as evident with Washington and Beijing locking horns over supply chains. As President Trump embarks on signing trade deals with several countries, he may pressure those nations to purge Chinese capital from their mining supply chains.

That wouldn’t be entirely without precedent. Concerns over Chinese capital compelled the prior U.S. administration of Joe Biden to enhance its internal review of new Chinese investments in critical minerals and other strategic sectors7. In the past, Washington has also raised concerns more broadly about new Chinese investment in its allies, putting pressure on close trading partners Canada and Mexico to fortify their review processes.

Bolstering the Investment Canada Act
That has already triggered a shift in how Canada has handled Chinese investments in recent years. In 2022, the Investment Canada Act (ICA) national security provisions were enforced to require the divestiture of Chinese investment in three Canadian critical minerals companies with lithium mining activities. In doing so, the critical minerals sector was flagged for enhanced government scrutiny8.

Further amendments over the past year give the federal government enhanced scope to complete a national security review for any new foreign investment in Canada, not just those with controlling interests, and greater scrutiny of investments by state-owned entities (SOE), which primarily targets China.

Amendments also asserted quasi-extraterritorial powers of the ICA – that the foreign assets of Canadian businesses were within scope of ICA review in case of foreign SOE acquisition.

Canada’s expanded reach
Combined with the fact that Canada has major mining concentration—the Toronto Stock Exchange and the TSX Venture Exchange represent 40% of the world’s public mining companies and are home to more than a 1,000 listings—, the ICA’s quasi-territorial means it’s a powerful tool for policing some Chinese investments abroad. Canada has recently asserted this authority, with two Canadian companies attempting to re-domicile to avoid the ICA review.

In the case of a more significant break with China, President Trump may seek a broader Chinese investment purge by Canada as the cost of participating in U.S.-centric supply chains. For one, it could push Canada to test its powers under the ICA. It could also take issue with some legacy investments by Chinese state-owned companies in large Canadian miners (see Managing legacy Chinese investments).

However, a provoked China could retaliate against Canada by closing its markets to certain exports, similar to its tariffs on Canadian canola in March, or by further weaponizing its supply chain.

Even as China’s capital or long-term supply agreements may no longer be welcome in the Canadian mining sector, it remains a major supplier of industrial equipment and parts. Western governments could replace Chinese equipment over time, but it is sand in the gears of further developing resources. Trump’s recent backtracking on Chinese tariffs at the behest of American corporations points to the importance of Chinese materials in the global economy.

Managing legacy Chinese investments

Analyzing the largest public Canadian mining companies reveals three with material Chinese ownership from state-owned entities. No major U.S. mining companies have similarly significant or state-sponsored Chinese interests.

Given that these are legacy investments, the Canadian government lacks the legal authority to compel their divestiture, notwithstanding the shifting national security lens.

In the U.S., President Trump’s recent political pressure may have compelled the planned sale of Hong Kong-based Hutchison Whampoa’s stake in Panama Canal and other ports to an American-led consortium (currently paused while under review by China). Ergo, other tools may be within the Canadian government’s control to achieve its aims, but they could come at the cost of provoking China and damage to Canada’s reputation as an investor-friendly jurisdiction.

Canada’s investment opportunity

The world’s looking at Canada as a stable and dependable commodity player to help diversify its commodity supply. It’s also a generational opportunity for the provinces and the federal government to unlock resource developments that are rich in gold (vital as a safe haven commodity), copper, iron and critical minerals. The right strategy, investments and security measures can help power Canadian mining.


[1] https://www.whitehouse.gov/presidential-actions/2025/04/unleashing-americas-offshore-critical-minerals-and-resources/

[2] https://www.canada.ca/en/natural-resources-canada/news/2024/12/canada-and-united-states-co-invest-to-unlock-critical-minerals-development-in-yukon.html

[3] Guidelines on the National Security Review of Investments – Investment Canada Act

[4] Protecting Ontario’s Critical Minerals and Energy Sector | Ontario Newsroom

[5] The sector’s capex-to-cash flow of 0.7x over the past 12 months and debt-to-cash flow ratio of 1.1x are both well below their 10-year averages of 1.0x and 2.1x, respectively.

[6] Float-cap weighted average trailing twelve month operating cash flow less capital expenditures less dividends less buybacks across the S&P/TSX Metals and Mining Index (GICS Level 3)

[7] https://bidenwhitehouse.archives.gov/briefing-room/statements-releases/2024/09/20/fact-sheet-biden-harris-administration-takes-further-action-to-strengthen-and-secure-critical-mineral-supply-chains/

[8] https://www.canada.ca/en/innovation-science-economic-development/news/2022/10/government-of-canada-orders-the-divestiture-of-investments-by-foreign-companies-in-canadian-critical-mineral-companies.html

rbc_toc_for_mmm_action

Seesawing trade relationships between the U.S. and China have brought critical minerals to the forefront. In fact, Rare Earth Elements (REEs), the 17 elements with physical and chemical properties that make them key inputs to some of the world’s most critical technologies, were China’s latest weapon in its trade arsenal against the U.S.

Following recent trade talks with the U.S., China expressed a willingness to walk back the REE export restrictions it announced in April. However, the threat re-emphasized the West’s collective dependence on China. In September 2020, the first Trump administration signed an executive order warning of the country’s critical dependence on China for REEs and called for increased domestic production. Even if the U.S.’s attempts at re-shoring supply are successful, its production will be a fraction of China’s, making international collaboration, including with Canada, a critical requirement.

Seven numbers tell the current state—and Canada’s potential role.

67%

Share of global REE mine production that comes from China. While the U.S. produces 11% of the global total, the second highest, it exports nearly all its production for further processing. The U.S. was once the world’s leading REE producer but has been losing share since the 1980s, with China dominating global production since. Canada has produced REEs in the past, but currently does not have any domestic mining operations.

99%

Share of Chinese control over Heavy REE separation and processing. Heavy Rare Earths, such as terbium, enable REE magnets to work in higher temperature applications without losing performance. China also controls 90% of Light REEs, including neodymium, which are also key inputs to magnets. Countries like Estonia and Canada have or are developing LREE and HREE separation and processing capabilities.

92%

Share of Chinese control of global REE magnet manufacturing. While REEs are used in various forms (e.g., as powders for polishing optical equipment, and as catalysts in petroleum refining), they are also used to make the world’s most powerful permanent magnets. These magnets are used in high-performance technology including military aircraft, submarines, and electronics and are difficult to substitute.

16

The number of U.S.-entities to which REE exports were banned by China in April, as trade tensions between the two nations escalated. Fifteen of these entities were linked to the manufacturing of defense technologies.

US$439 Million

How much the U.S. Department of Defense has spent since 2020 to strengthen its domestic REE supply chain.

$22 Million

What the U.S. has invested in Canadian REE processing companies since 2023. Canada is considered a “domestic source” of critical minerals under the U.S. Defense Production Act (DPA), so Canadian companies are eligible to receive investments under DPA Title III.

12

REE projects in Canada currently active in the exploration, resource estimation, or preliminary economic assessment phases. There are also three separation and processing facilities and two REE recycling plants. To capitalize on the opportunity, a few things could speed things along. 1/ Government investment: Provincial funding in Saskatchewan, for example, has helped bring REE processing facilities closer to commerciality. Government support could also help fast-track projects. 2/ Secure offtake for REE products: As discussed in The New Great Game, decades of focused industrial policy and technology development have left Western manufacturers competing with lower-cost products while being bound to tighter environmental standards. Guaranteed offtake at competitive prices could help Canada’s REE industry get a foothold.

Vivan Sorab is Senior Manager, Clean Technology, at the RBC Climate Action Institute

rbc_toc_for_mmm_action

The super-charging revolution is here.

Recent demonstrations by Chinese electric vehicle (EV) giants BYD and CATL of batteries that can be charged in five minutes—up to five times faster than rivals—and with a range of 520 kilometres, has made many sit up and take notice.

Could this super-charging revolution be the game changer that will pave the way for greater EV adoption in Canada, and elsewhere? Equally crucial: can electricity grids handle the increased load demand if this technology were to reach Canadian shores in the next few years?

A game changer?

A five-minute charge has the potential to address two of the top three concerns that consumers often cite when considering EVs: range anxiety and access to public charging stations (the third being affordability). According to a JD Power survey in 2024, 68% of Canadians were anxious about running out of EV battery while on the road.The inconvenience of waiting in line at public charging stations and long charge times—on average 30 minutes—have been an issue for up to half of EV drivers, a survey shows. A five-minute charge battery with extended range tackles these issues head on and entice would-be owners to finally take the EV plunge.

BYD's new 5-minute charging is 4-5x faster than rivals

The 3 big grid challenges facing 5-minute charging

Here’s how the quick-charge revolution could impact Canada’s grids:It’s a massive draw on the grid: 

  • It’s a massive draw on the grid: Unlike traditional charging that’s spread over hours, fast charging delivers high-intensity power spike that grids might not be designed to handle. An average EV with a battery of 80 kWh would require around 1,000 kW power to fully charge in minutes. That’s enough electricity to power 800 homes for the same amount time, and adds significant load to the grid, especially if charging takes place during peak hours.

  • Grid expansion is already facing once-in-a-generation challenge. Expanding local distribution networks, modernizing local substations, and improving interconnections to accommodate localized demand surges are the biggest challenges posed by super-charging. Distribution lines will also need to grow by another 55,000-85,000 kilometres by 2030—requiring a build-out that’s 30%-100% faster than the current pace.

  • Future-proofing would require a decentralized grid: Fast, localized spikes in demand require more than just expansion of centralized grid assets. They also require the addition of decentralized distributed energy resources (DERs), such as micro-grids and residential solar, and greater grid digitization. Infrastructure modernization can also transform DERs into virtual power plants during periods of peak demand.

Farhad Panahov is an economist with the RBC Climate Action Institute.

rbc_toc_for_mmm_action

Energy. Geopolitics. Trade.

All three topics were on full display at Columbia’s Global Energy Summit 2025. Tariffs and trade policy dominated the Summit, with significant implications to both the supply and demand of North American energy. Shaz Merwat, Energy Policy Lead of RBC’s Climate Action Institute, was in attendance and shares the five most pressing themes at this year’s event.

1. Energy risks becoming more complex

The push to re-orient trade flows to manifest specific economic outcomes (reduce a trade deficit, reshore production) likely increases price risk through a bifurcation of supply and demand in key commodities. At the most obvious, tariffs levied on steel, aluminum and possibly copper–all key inputs to energy infrastructure–result in regional pricing. As seen in the chart below, U.S. aluminum prices have largely decoupled from European pricing as a result of Trump’s tariffs. Similarly, price differences between U.S. Midwest hot rolled coil steel prices (US$1,075/tonne) and Northern Europe hot rolled coil steel (US$715) has increased to about $360/tonne, compared to $150/tonne at the start of the year.

Geopolitically, risks are also expanding beyond the simple ‘Middle East’ supply risk that we have known for the last half century. Spheres of influence can re-orient supply and demand relationships, especially in the case of LNG and critical minerals. These emerging geopolitical trade barriers ultimately weaken an otherwise more ‘global’ market to absorb supply and demand shocks–which likely are more deliberate at a time when weaponized trade is becoming increasingly more common (Russian gas, Chinese supply chains, the American market).

2. What is this energy dominance you speak of?

While the Administration has vowed to unleash U.S. energy dominance, to date, it appears to have done the exact opposite. On oil, Trump’s trade/tariff agenda has driven oil prices lower than those witnessed for most almost all of Biden’s presidency. WTI has twice dipped below US$60 per barrel in the past week–a level widely seen as U.S. shale’s breakeven–leading to increasing concerns of idled rigs and declining production; S&P Global estimates US$50/bbl oil could cause a U.S. production decline of 1 million bbl/d. All the while, OPEC is boosting production.

The continued desire to gut funding for the Inflation Reduction Act also stymies U.S. renewable energy, even for tax credits deemed friendly to the oil industry (such as the 45Q carbon capture tax credits). Lastly, concerns around supply inflation (steel/aluminum tariffs) and general market/economic uncertainly has created a very challenging environment to deploy capital.

3. Climate trade frictions remain alive and well

With the gutting of the WTO and Trump’s reciprocal tariffs, developing nations are increasingly seeing their preferential trade terms (higher ‘allowable’ tariff rates) erode. You can add climate to that list, as nations impose climate-related trade measures to enhance economic competitiveness.

In Europe, carbon border adjustments protect domestic carbon policy. In the U.S., a border pollution fee leverages America’s carbon advantage–especially in relation to China. The U.K. and Australia are also exploring carbon border adjustments of their own.

Domestic carbon policies without a climate trade measure (such as a CBAM), politically, is almost certainly bound to fail. Yet, expectations for developing nations to enact similar carbon prices as the E.U.’s emissions trading scheme–a system that has seen carbon pricing increase/expand over the last two decades–in a mere few years, seems unjust. This likely only accentuates climate trade tensions between North and South.

4. Reducing the trade deficit

In the eyes of U.S. President Donald Trump, reciprocal tariff rates yield a balanced trade relationship. For trade partners, a balanced trade relationship is as good as a ‘due north’ one can expect under Trump’s vision of America First. Trade partners will be served well if they can better house American (merchandise) exports.

In this world, U.S. LNG likely shines bright. The country is expected to surpass Qatar as the largest provider of U.S. LNG, globally, by 2030 according to RBC Capital Markets forecasts as seen below. For major LNG buyers that run large trade surpluses with the U.S. (the E.U., Japan, Korea, India), greater purchases of LNG supply can be the ‘easy’ win.

5. AI clusters and cross-border data flows

Nations with abundant, cheap electricity are best positioned in the race to build data centers. This likely results in supply ‘clusters’, especially torqued to renewable generation given the climate commitments of tech firms. Consensus is increasingly pointing to Canada, the U.S. and the Middle East as becoming cluster of American artificial intelligence deployment.

But what does that mean for data flows? Data protectionism towards data hosting (colocation) likely remains, but more alignment is needed on cross-border data transfers resulting from compute capacity (hyperscale). We expect more on this in the renegotiation of USMCA in 2026.

Shaz Merwat is the Energy Policy Lead of RBC’s Climate Action Institute

rbc_toc_for_mmm_action

How dependent is the U.S. on Canadian electricity to power its homes and industries? Could electricity serve as a point of leverage in Ottawa’s trade negotiations with Washington?

These questions emerged after Ontario Premier Doug Ford imposed a 25% surcharge on its electricity exports to the U.S. border states of New York, Michigan and Minnesota—only to scrap it after Washington threatened to double tariffs on Canadian steel and aluminum. Electricity flowing between Canada and the U.S. are exempt from tariffs under USMCA, which explains why the Ontario government imposed a surcharge on electricity exports, a de facto export tax.

While Ontario’s threat has died down—for now—, the episode highlights the significance of Canadian electricity in cross-border trade dynamics. We shed some light on the continental power trade flow and whether electricity could be a card worth playing in Ottawa’s negotiations with Washington.

Powering the U.S.

Canadian electricity exports to the U.S., by state (2024)

Source: Analysis of Statistics Canada data by RBC Thought Leadership
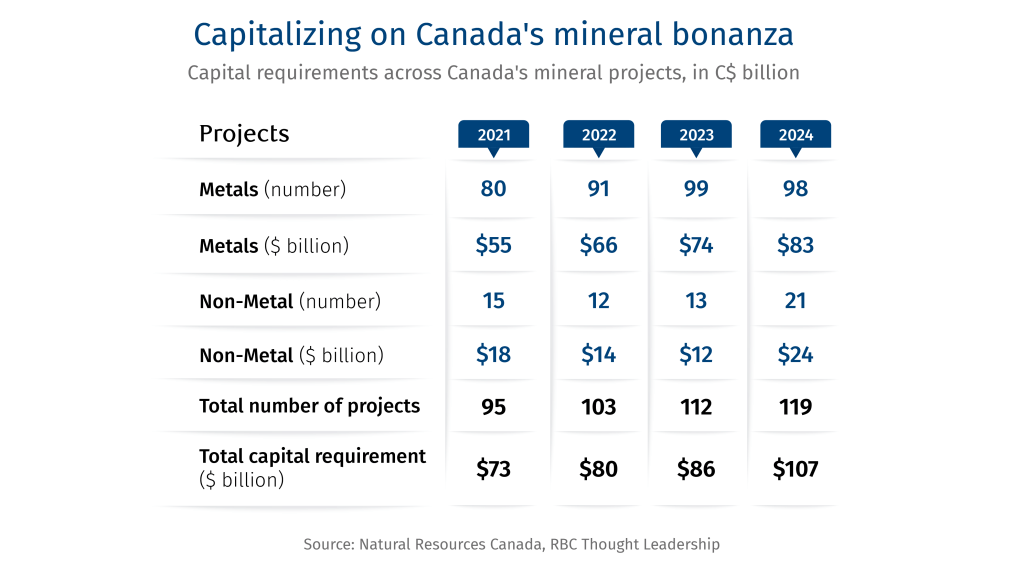
Four provinces dominate

Last year, Canada sent 35 terawatt-hours (TWh) of electricity to the U.S.–that’s less than 2% of total U.S. electricity generation—adding $3.4 billion to the Canadian economy. But some states are more dependent on Canadian power than others.

The movement of electricity within the continent follows a north-south axis, mirroring the broader trade pattern for physical goods. Four provinces dominate the Canada-U.S. electricity trade–Quebec, Ontario, British Columbia and Manitoba, accounting for 86% of exports.

Until 2022, Quebec had been the largest exporter, with one-third of Canada’s electricity exports originating from its border. While it has been surpassed by Ontario recently, that’s more a function of lower hydroelectric power output in Quebec due to droughts, and not a surge in the terawatt-hours (TWh) Ontario sends down to neighbouring states.

And it’s not entirely a one-way traffic. Occasionally, U.S. power surges back into Canada, with the above-mentioned four provinces also the biggest beneficiaries of these imports, accounting for 95% (21 TWh) of all U.S. electricity imports, especially in times of drought. British Columbia is the biggest buyer of American electricity, accounting for 57% of imports. Controlling for drought conditions and B.C.’s supply shortage—which will be resolved once the Site C hydroelectric dam runs at full capacity later this year—, Canada’s annual reliance on U.S. power would be 10 times smaller to around 2 TWh.

Canada Provides the U.S. with Enough Electricity to Power 3.4 Million Homes Annually

Provincial breakdown of electricity trade (2024)

*Numbers based on the power consumed by the average American home annually.

Source: Analysis of Statistics Canada data by RBC Thought Leadership
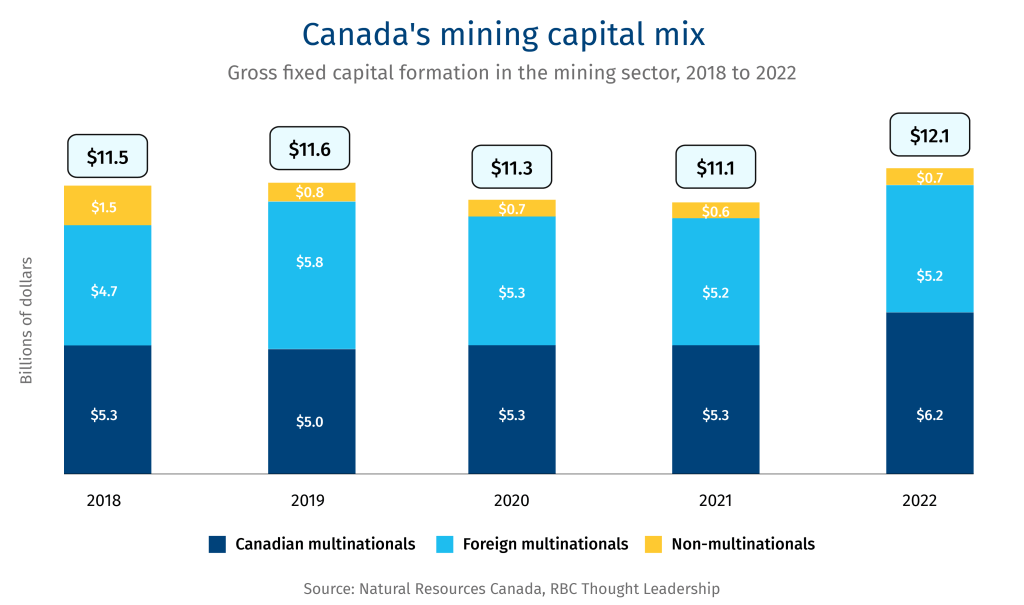
Maine and Minnesota are most dependent on Canada

Electricity as a bargaining tool in trade negotiations depends on the province’s market share in various U.S. jurisdictions.

While New Brunswick only accounted for 11% of Canadian electricity exports in 2023, the 5.5 TWh of power accounted for 44% of Maine’s power needs. When imports from Quebec and Newfoundland are added to the mix, Maine’s dependence on Canadian electricity jumps to 64%.

Similarly, Manitoba provided 13% of Minnesota’s electricity needs in 2023, a figure that’s expected to grow this summer. The Midcontinent Independent System Operator (MISO), which oversees transmission in several Midwest states including Minnesota, is anticipating a supply shortfall due to a confluence of events: the retirement of coal-fired power plants, growing demand, and slower than anticipated new generation assets coming online1.

Sourcing additional power from neighbouring system operators, Southwest Power Pool and PJM Interconnection are limited, as the grids operated by these systems operators are also facing a similar challenges2. That could leave Minnesota more reliant on Manitoba’s grid.

A weak hand?

For Quebec and Ontario, electricity is a weak hand to play. While Ontario supplies 6% of Michigan’s electricity needs, much of it is pushed out to neighbouring states, mainly Ohio and Indiana. New York, meanwhile, is reliant on Quebec and Ontario for 6% of its power.

Could the U.S. states easily switch to alternatives if Canada slaps new surcharges? New York is part of the Northeast Power Coordinating Council (NPCC), (which also includes Quebec, Ontario) and six New England states that can emerge as viable alternative suppliers. However, by 2026 demand growth in the northeast region is anticipated to cause a supply shortfall.

A co-ordinated strategy is required for Ontario and Quebec, if electricity is to be an effective bargaining chip with the U.S. administration. That may be tough for Quebec, as Hydro Quebec has an offtake agreement with New York’s independent system operator that may limit additional service level changes and charges outside of the contract.

What to watch for as trade tensions simmer

The Ontario government says electricity surcharges remain on the table as a retaliatory measure against any future U.S. trade actions. With reciprocal U.S. tariffs expected on April 2, Ontario may once again proceed with its credible threat of imposed the surcharge—as it briefly did on March 10.

A hot summer could further strengthen Ontario’s case. Keeping the lights on and air-conditioning running without Canadian electricity could prove to be challenging this summer for strained U.S. state grids. And that may prove to be the ultimate power play for Ontario, and other provinces.

But rather than a blunt negotiating tool, electricity trade represents a strategic asset for Canada—one that can help build deeper energy co-operation with the U.S. while ensuring stability for both economies.

Myha Truong-Regan is Head of Climate Research, RBC Climate Action Institute.


This article is intended as general information only and is not to be relied upon as constituting legal, financial or other professional advice. A professional advisor should be consulted regarding your specific situation. Information presented is believed to be factual and up-to-date but we do not guarantee its accuracy and it should not be regarded as a complete analysis of the subjects discussed. All expressions of opinion reflect the judgment of the authors as of the date of publication and are subject to change. No endorsement of any third parties or their advice, opinions, information, products or services is expressly given or implied by Royal Bank of Canada or any of its affiliates.

rbc_toc_for_mmm_action

The U.S.-Canada trade war has kicked off, with Canadian steel and aluminum exports, valued at $24 billion annually1, set to be tariffed at 25% starting today. We highlight five themes to watch for as the two economies brace for the fallout from these levies:

1. The tariffs are unlikely to reinvigorate U.S. production

The first iteration of Section 232 tariffs in 2018, triggered by U.S. national security concerns, did not meaningfully expand American steel and aluminum production capacity (production increased 7% and 4%, respectively)2. This scenario will likely repeat itself. The U.S. steel industry is impeded by a far bigger challenge as China floods global steel markets with excess production capacity, ultimately hindering U.S. producers’ ability to boost domestic output. This global oversupply reached 560 million tonnes (6x U.S. consumption) in 2024, with a further 157 million tonnes of carbon-intensive capacity additions set to come online by 2026, mostly from Asian countries3.

Since Section 232 tariffs were introduced, overall U.S. imports (by weight) have fallen 15% for steel and 13% for aluminum compared to 2018. U.S. net steel imports remain at 13% of domestic consumption, while aluminum net imports are structurally higher at 47% of consumption. However, total U.S. consumption of both metals has fallen about 10% since 2018, which helps explain why import dependence hasn’t dropped as much as the raw numbers suggest4.

This is evident in Tables 1 and 2.

Table 1: U.S. steel consumption and net imports are stagnant


Source: U.S. Geological Survey, RBC Thought Leadership
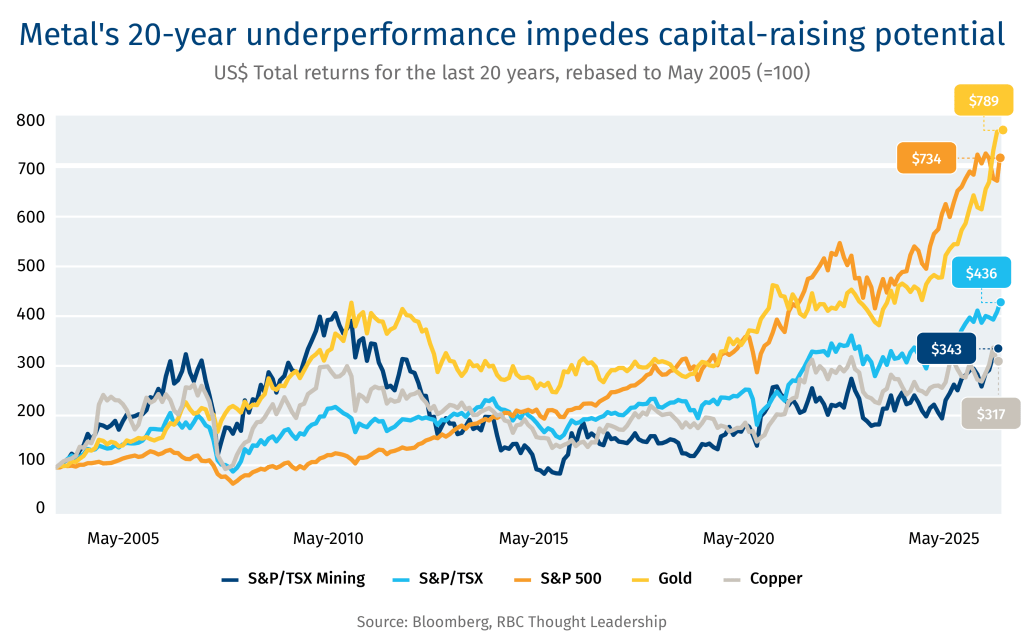
Table 2: U.S. remains heavily reliant on imported aluminum


Source: U.S. Geological Survey, RBC Thought Leadership
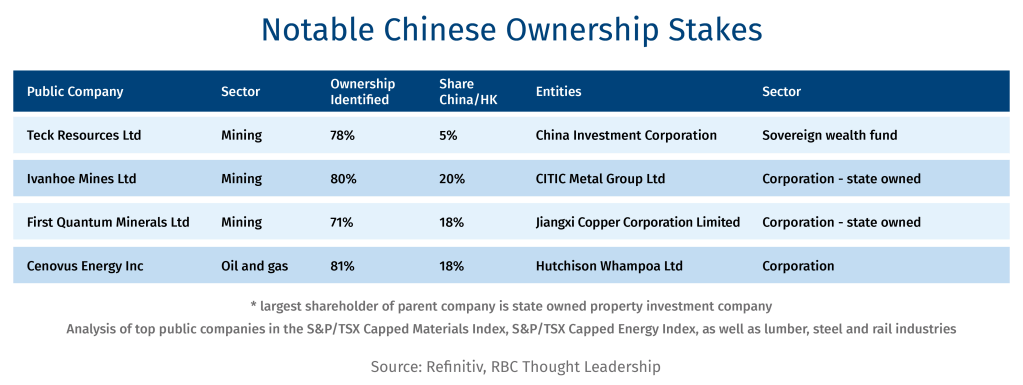
2. The devil is in the details on China’s access to U.S.

Defining “steel” is no easy task, given the hundreds of tariff line items within both Harmonized System (HS) codes 72 that covers iron and steel, and 73 which accounts for articles of iron and steel. HS codes classify products for international trade, making customs and regulations easier. The U.S. has largely succeeded in shutting Chinese “steel” out of its market (as defined in HS Code 72), as they account for only US$490 million of steel imports in 2024, or about 1.6% of total imports5.

However, Chinese steel exports to Mexico and Canada are over three times higher, at an estimated $1.7 billion (aggregate) in 2024, or 8% of each countries’ total imports6. That figure is trending upwards, having more than doubled since 2017. Including Chinese proxies (Vietnam, Thailand, Indonesia, among others), total Chinese and “back door” exports from proxies to Mexico and Canada likely surpassed US$2.5 billion. Understandably, the U.S. has voiced its concerns to both countries.

Still, this ‘concern’ is dwarfed by the reality the U.S. directly imports U$14 billion worth of steel and steel products (HS Codes 72 and 73 combined) directly from China, or a quarter of its total imports of steel and steel products7. In comparison, Chinese steel and steel products account for only 10% of Canadian and Mexican imports, respectively8.

When viewed in aggregate, U.S. national security has materially improved with allies such as Canada, Japan, South Korea and Mexico having raised their steel and aluminum shipments to America over the past six years—at China’s expense. Specifically, total U.S. steel and aluminum imports from the exempted countries increased in dollar value from 51% in 2018 to 57% by 2024, with a corresponding decline from 44% to 36% for China and its ‘backyard’—a net swing of +14% (see Table 3)9.

Table 3: Allies boosted their market share in the U.S. at China’s expense


Source: U.S. International Trade Commission, RBC Thought Leadership
3. For all the China talk, Canada has become target number one

From a fundamental market standpoint, Canada’s exports of steel and aluminum to the U.S. have increased by 35% to US$17.7 billion since 2018. That pace of growth is greater than the global average, with the most recent years far surpassing historical Canadian growth rates. As a result, Canada’s steel and aluminum trade surplus with the U.S. has more than doubled from 2018 to more than US$9 billion last year10.

However, Mexico and Vietnam both added more to their exports during the same period both on an absolute basis (US$11.8 and US$4.9 billion, respectively) and relative basis (+62% and +410%)11. The surge in Vietnamese volumes would be of particular concern to the U.S. administration—perhaps warranting a higher tariff rate. But the tit-for-tat nature of trade wars has manifested with Canada often targeted – perhaps beyond the realities of fundamental market conditions.

Lastly, and specific to Canada, it is worth noting the U.S. also has concerns on Luxembourg-headquartered ArcelorMittal’ substantial Canadian presence, likely accounting for half of total Canadian steel production. The firm has also established a strategic partnership with China Oriental Group, and is a 37% shareholder in the firm.

4. Exemptions for Canada will be hard to come by

While there is always the likelihood Trump eventually gives Canada a tariff reprieve, it remains unlikely.

Firstly, Canada’s hardening stance and tit-for-tat tariffs is creating a challenging negotiating environment. Secondly, Corporate America is unlikely to go to bat for Canada given these tariffs are sector-specific and comparatively far less economically disruptive compared to blanket tariffs.

Lastly, we have been here before: It was not until the signing of USMCA in May 2019 when Section 232 tariffs on Canada were lifted, fourteen months after they took effect.

While Canadian products may still secure an exemption if they are deemed to be ‘un-substitutable,’ it is difficult to substantiate this from the data. For steel, the U.S. is only 13% net-import reliant. Also, the end-use of Canadian steel domestically is broad-based: general manufacturing (40%), autos (20%), oil and gas (15%) and general construction (10%)12. It is unlikely that Canadian steel is consumed in the U.S. for strategic purposes that are hard to substitute. Canadian aluminum may have better luck, given Canada represents 75% of U.S. primary aluminum imports13.

5. The best chance for success is to offer concessions

The clock is now ticking for Canada and the U.S.’s other trade partners. Over the next three weeks, the Trump administration will seek concessions in the run-up to April 2, the effective date for both reciprocal global tariffs and expiry of Canada and Mexico’s broad-based 25% tariff.

In the past, South Korea ‘voluntarily’ agreed to restrict exports under a quota system, which granted them Section 232 steel and aluminum exclusions. Japan entered into bilateral trade negotiations to avoid potential tariffs on autos. Canada and Mexico held out until USMCA was signed in mid-2019. Future success could only come with meaningful concessions to the U.S.

Perhaps one promising sign is that Canada is set for new political leadership, whether it be Liberal leader Mark Carney or Conservative leader Pierre Poilievre. Both present an opportunity to ‘reset’ a personal relationship with the U.S. President. This could also be a catalyst to engage in USMCA renegotiations, following a similar playbook, and appease an increasingly hawkish (and unpredictable) Trump administration.

  1. U.S. International Trade Commission (DataWeb), U.S. Federal Register
  2. U.S. Geological Survey Mineral Commodity Summaries 2025
  3. European Steel Association (Eurofer), OECD, U.S. Geological Survey
  4. U.S. Geological Survey Mineral Commodity Summaries 2025
  5. U.S. International Trade Commission (DataWeb)
  6. Innovation, Science and Economic Development Canada, UN Comtrade
  7. U.S. International Trade Commission (DataWeb)
  8. Innovation, Science and Economic Development Canada, UN Comtrade
  9. U.S. International Trade Commission (DataWeb)
  10. Ibid
  11. Ibid
  12. Statistics Canada, Symmetric input-output tables
  13. Aluminum Association of Canada

rbc_toc_for_mmm_action

Key takeaways

  • Canada and the U.S. are each other’s largest minerals trading partner, amounting to $146 billion in bilateral trade1.
  • The U.S. is 100% import reliant for 12 of its identified list of 50 critical minerals, and net import reliant (>50%) for 29 of those critical minerals2.
  • China is the primary foreign source for a quarter of the U.S.‘s critical minerals3.
  • Disruptions to the supply of critical minerals could cause material damage to the U.S. economy. One example: a 30% supply restriction of gallium could cause a $600 billion (U.S.) decline in U.S. GDP4.
  • Defense procurement is an underutilized source of financing for key defence critical minerals, particularly graphite, tungsten, scandium, and gallium.

Bedrocks of a Fourth Industrial Revolution

Minerals are the bedrock of any industrial economy. From steel to copper to aluminum, they lay the foundation of economic, civil, and defence infrastructure. And increasingly, a growing cohort of minerals underlie the critical components of the so-called Fourth Industrial Revolution — an era of disruptive technological forces driven by human-machine interaction across research, manufacturing and an ever-expanding data economy.

In this new age, the demand for that cohort of “critical minerals” will be driven by a growing use of semiconductors and data processing machines, increased adoption of battery technologies and new energy sources, and advancements in defence and aerospace technologies. For Canada, the race to develop and process these minerals is about much more than the mining sector; it underscores a new security paradigm to protect and enhance our economic and national interests in an evolving world order. Here’s some of what’s at stake:

Semiconductors

The early days of generative AI are showing how much more computing power we will need. Global semiconductor sales are on pace to reach $1 trillion (U.S.) by 2030, with high-powered artificial intelligence (AI) chips likely accounting for the majority of sales5. To date, silicon has been the material of choice but AI is testing silicon’s thermal limits. Gallium nitrade’s (GaN) superior conductivity results in over 30% improvements in wafer power efficiency6. Palladium, arsenic, copper, and cobalt are also used in chip fabrication (plating, wiring).

Batteries

Whether it’s for EVs on the road, energy efficiency at home or long-duration storage at power generation sites, we’ll need a lot more battery technology in the years ahead. An EV battery requires an average of 205 kilograms of critical minerals (or six times that of an internal combustion engine), comprised of lithium, cobalt, nickel, graphite and manganese7. Based on Bloomberg New Energy Finance’s Economic Transition Scenario, we estimate North American battery minerals demand (transport and utility storage) is likely to increase between four to five-fold by 2040, relative to today8.

Frontier energy

We’re likely to see more oil and gas consumption over the next decade in North America, but we also will see much more growth in newer energy sources, including small modular nuclear reactors, geothermal, wind and solar. The rapid growth in renewable power, which is now about 15% of global power9, is increasing the demand of a number of critical minerals. Silicon, silver and aluminum are needed for solar panels with cobalt, tellurium and rare earth elements for wind. Based on Bloomberg New Energy Finance’s Economic Transition Scenario, we estimate North American renewables (solar and wind) electricity generation to at least triple on the back of increased demand for electricity by 2040, compared to 2024 levels10.

Defence

The push for materially more defence and security spending across the West, including in Canada, will require a lot more heavy equipment and the materials and minerals that go into them. A typical artillery tank requires over 20 different critical minerals across navigation, communications, and combat systems11, while an F-35 jet relies on almost 1,000 pounds of rare earth elements12. Batteries and semiconductors are also increasingly important to military operations, along with more traditional needs to strengthen artillery, naval and aerospace (antimony, beryllium, titanium, among others). And then there’s border security; tungsten is used in automobile x-rays and germanium within thermal imaging and night vision goggles.

A New Great Game

The battle for global tech supremacy between China and the U.S. is manifesting a critical mineral resource war, and a geopolitical great game for the 21st century that may soon rival the race for oilfields that came out of the Second World War or the competition for trade routes that shaped the 19th century.

For the U.S. and its Western allies, this competition is at risk of being lost to China. In areas of EVs, renewable energy, and advanced civil and defence technologies, China is proving to be as innovative as America. Global autos rely on Chinese battery technology. Ford CEO Jim Farley views China a decade ahead on battery technology – and still innovating13. On defence, China can bring on new weapons systems five times as quickly as the U.S.14.

Even more concerning is that the U.S. has little to no presence across the critical minerals value chain. The country is 100% import reliant for almost a quarter of its identified 50 critical minerals, and over 50% import reliant on 29 minerals15. In many instances, that reliance is on China. The country is the primary import source for a quarter of U.S. critical minerals and is the leading global producer of 16 of the U.S.’s list of critical minerals16.

China has dominant positions in either the production and/or refining across the six ‘core’ critical minerals, i.e., lithium, graphite, cobalt, nickel, copper, and rare earth elements (REE). At the most extreme, China has 75% or more global market share of produced and refined graphite, refined rare earth elements, and refined cobalt17. Across the entire six minerals, China has control of, on average, two-thirds of global processing/refining output18.

Critical mineral production is characterized by meaningful concentration risk

Top 3 suppliers as a percent of global supply, 2023

Source: IEA and RBC Thought Leadership
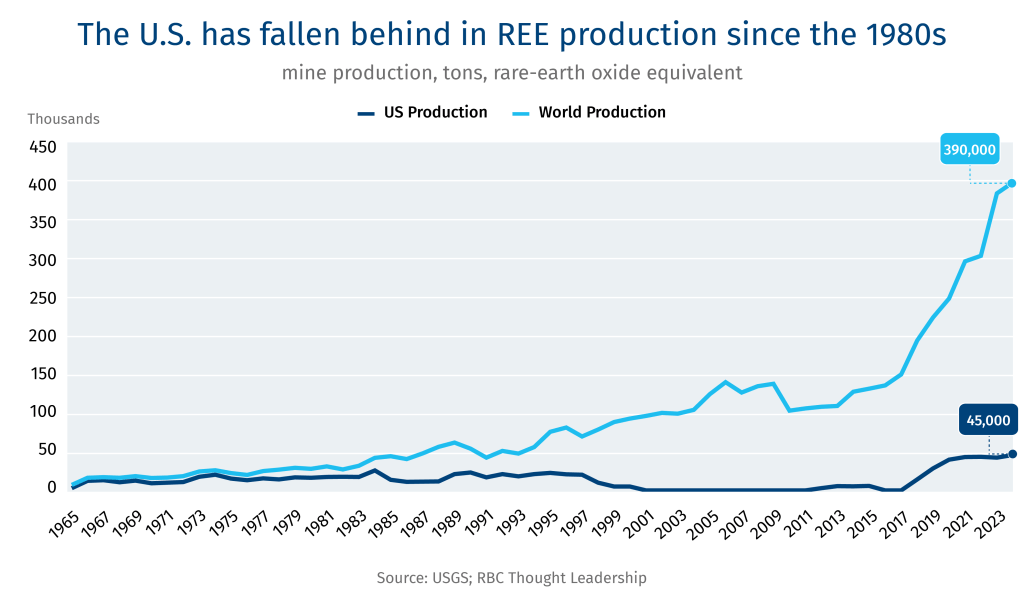
And even more so for critical mineral refining, which is dominated by China

Top 3 suppliers as a percent of global supply, 2023

Source: IEA and RBC Thought Leadership

In foreign markets, Chinese state-owned miners have meaningful operations in Peru, the Democratic Republic of Congo and Indonesia (Chinese firms control almost 75% of Indonesia’s nickel capacity)19. The country also has established investment ties and is the largest trading partner for mineral producers/refiners across virtually every country in South America, Africa, Southeast Asia and Oceania (Australia).

Playing catch-up in this rush for critical minerals will be difficult, and far more challenging than the West experienced with oil, for several reasons:

  • 1.
    Exotic minerals. Critical minerals are a varied, diverse set of both traditional and exotic minerals, with their own unique processes to both produce and refine. The process is far more complex than crude refining or natural-gas processing, which situate within a narrower molecular band of hydrogen and carbon compounds.
  • 2.
    End use matters. In critical minerals, the end use predicates the type of production and level of refinement required. For instance, primary gallium is recovered as a byproduct of processing bauxite and even at refinement, high purity gallium is refined up to 99.99999% purity.
  • 3.
    Technology. Decades of experience have allowed China to innovate refining techniques, such as perfecting the solvent extraction process to refine rare earth elements.
  • 4.
    Limited domestic resources. The U.S. has limited domestic resources of critical minerals, with less than 1% of the world’s reserves of cobalt, nickel and graphite and less than 2% of manganese and rare earth elements20.
  • 5.
    No state champions. The Seven Sisters, ancestors of British-American siblings BP, Chevron and ExxonMobil, birthed the oil industry. The seven were provided immense political (and military) assurances to traverse foreign lands in pursuit of securing reserves. In contrast, most major North American miners have smaller global footprints relative to the U.S. oil majors, especially downstream (albeit less so for Barrick Gold, Teck Resources and First Quantum Minerals).

The U.S. will be challenged to catch up to Chinese dominance, at least on its own. As a result, it’s creating new strategic spheres to secure the minerals critical to its global technological leadership, targeting resource deals – and perhaps deeper relationships – in the Ukraine, Greenland and Canada. The U.S. may even re-integrate unrestricted Russian commodities back into global markets, if that furthers its own ambitions for resource security.

Canada must be at the centre of this sphere. The country can de-risk critical mineral supply chains – reducing the reliance on China but also providing additional capacity to markets dominated by a handful of suppliers. Canada is a geologically rich, responsible mining nation with significant mineral potential including nickel, cobalt, zinc, aluminum, potash and more niche minerals such as indium, graphite, germanium and gallium. We are also a trading nation, the only G7 nation with free trade agreements across all other G7 members, complemented by a historically strong security relationship with the U.S.

How China gained the lead

The Trump Administration has made critical minerals a strategic priority. A renewed focus on defence is widely seen as a positive investment. The new administration’s executive order immediately pausing the disbursement of funds through the Inflation Reduction Act, along with recent uncertainty around the Biden Administration’s CHIPS and Scient Act, may be more problematic, as it threatens to freeze some critical investment plans at a time when Beijing is not slowing its pace. Put simply, the U.S. may need to embrace all demand drivers because China is embracing all demand drivers: batteries, renewable power, EVs, defence and AI.

We have identified four key drivers that led to China’s dominance – some of which employ industrial and foreign policy approaches that the West may be forced to take to unbalance this great imbalance:

Policy

Industrial policy targeting steel, aluminum and copper (initial industrialization) was followed by policies to further adoption of EVs and renewables. On the supply side, state assistance was provided to create national champions to compete with global majors. This was complemented with foreign policy objectives, such as One Belt, One Road, which invested $1 trillion (U.S.) in foreign countries — often in resource rich nations21. The Inflation Reduction Act was America’s industrial policy response, and while successful in stimulating capital directed towards research, development and manufacturing, little has been put towards mineral mining and/or refining.

Market

Today, China accounts for 70% of the value of global clean technology22 manufacturing within an ecosystem that is often vertically integrated; minerals are mined, refined to the specificity of end components. Demand pulls supply, which is sourced by state-owned miners operating in lower cost jurisdictions, all while being provided state support. Western miners, in contrast, are beholden to higher standards by public investors, lacking in state subsidies, and are often subject to higher social license costs in foreign resource development, given the lack of political support (state-investor dispute, versus state-state dispute).

Technology

In China, targeted state-support for both supply and demand fostered breakthroughs in technology and riding down the cost curve – especially in renewables and batteries. On the supply side, technological innovation in Chinese production and refining has allowed China to perfect the solvent extraction process to refine REEs.

Mindset

China takes a war-time mindset to allocating capital and other resources to ensure security of supply and demand through an entire value chain approach. The U.S., in contrast, lacks such urgency. It’s even moved away from strategic mineral reserves, by either not replenishing reserves relative to historical levels or, in the case of helium, selling reserves altogether. This is vastly different than the approach taken to crude oil, which maintains a strategic reserve and until 2015 had a continental export ban.

The big five: Canada’s non-fuel critical minerals

U.S. imports of all non-fuel mineral and metals reached $167 billion (U.S.) in 202423. Canada remains the largest source of U.S. imports (US$40 billion, or 24%), and is the #1 provider of steel, aluminum, potash, nickel and zinc to the U.S. (#2 for copper)24. Across the U.S.’s 50 critical minerals, Canada is also the largest source of imports (US$4.5 billion, or 20%)25.

With that said, the U.S. remains reliant on China for many less commercial yet strategically important critical minerals. Even more, China has implemented export controls on a number of these minerals, such as gallium. The economic significance from this supply risk is material; the U.S. Geological Survey estimates a 30% supply reduction in gallium (China is 90% of global supply) alone could cause a $600 billion (U.S.) drop in U.S. GDP26.

In the near to mid-term, Canada has an opportunity to gradually displace Chinese supply, while also furthering a U.S.-Canadian strategy to secure production across a range of technologies and applications critical to both continental security and the Fourth Industrial Revolution. Below, we identify five key critical minerals best situated around this opportunity.

1. Gallium


Gallium has one of the highest thermal conductivities among metals. It is used in the production of highly specialized integrated circuits and semiconductors for AI and advanced computing. Gallium-based semiconductors are also vital to U.S. next-generation missile defence, radar systems and electronic communications.

The U.S. remains 100% import reliant for its supply of gallium27. In 2024, Canada was the #1 provider of gallium metal to the U.S., accounting for over 50% of imports (effectively displacing Chinese supply)28. Current supply is sourced from recycled gallium at Neo Performance Materials’ site in Peterborough, Ontario. Rio Tinto’s Saguenay demonstration project could add another 5-10% of total global primary gallium metal production if it can reach commercial viability29. A proposed expansion at Teck Resource’s Trail, B.C. operations could also increase production of germanium and add gallium and antimony.

2. Graphite


High electric conductivity, temperature resistance, chemical inertness, and lubricity characterize this battery metal increasingly relevant in defence applications. Graphite’s unique properties make it difficult – even impossible – to substitute in many applications, such as where thermal resistance is essential to equipment performance and durability.

Global demand for graphite is forecast to nearly double by 203530. Canada has a unique opportunity to develop a full graphite value chain, a highly valuable proposition given China is 82% and 91% of global graphite production and refining, respectively31. Quebec is furthest along with Northern Graphite’s operating mine in Lac des Iles, northwest of Mt. Tremblant, and Nouveau Monde Graphite’s development projects underway for mining in Matawinie, north of Montreal, and refining in Bécancour, outside Trois-Rivieres. Ontario offers another potential graphite mine, Northern Graphite’s Bissett Creek, near the Ottawa River north of Algonquin Park, which is undergoing permitting.

3. Nickel


Nickel has high ductility (flexible), toughness and strength. The mineral is used in lithium-ion batteries and in the production of stainless steel. Global demand is forecast to grow 70% by 2035, largely on the back of demand for batteries, both within transport and stationary (utility)32.

The Dumont Nickel project (Nion Nickel) in Quebec’s Abitibi region is vertically integrated and under construction. Canada Nickel’s Crawford mine (world’s second largest nickel reserve) north of Timmins, Ontario, is undergoing permitting. Canadian nickel provides much needed diversification of supply, with Indonesia and the Philippines together alone accounting for two-thirds of global production33. Canadian nickel could exceed 100% of U.S. import needs if all projects come online34.

4. Tungsten


With the highest tensile strength (the maximum stress a material can bear without breaking) and melting point of all naturally occurring metals, tungsten-based alloys are key inputs for defence aircraft, naval vessels, and armour-piercing ammunition. Tungsten is also used within automobile x-ray machines, used in enhancing U.S. border security.

China produces 83% of the world’s tungsten and accounts for 52% of global reserves35. Canada is a past producer, with substantial reserves that include some of the world’s largest tungsten deposits. Northcliff Resources’ Sisson project, northwest of Fredericton, and Fireweed Metals’ Mactung mine, in eastern Yukon, are notable Canadian tungsten projects. In December 2024, the Canadian government and U.S. Department of Defense announced a joint investment of $35 million USD in the Mactung project, the world’s largest high-grade tungsten deposit36.

5. Germanium


The mineral has semiconducting characteristics comparable to those of silicon, but with superior optical and thermal properties. Its use is critical in night vision, space exploration, fiber optic cables, and semiconductors. The growing need for datacenters (fibre) has spurred demand in recent years.

Canada supplied 20% of U.S. germanium (oxide) imports in 202337. Canada’s Teck Resources holds an integrated germanium supply chain with zinc ores mined in Alaska and refined in Trail, B.C. The Trail facility has a proposed expansion to increase germanium production largely in response to China’s germanium export ban late last year.

Ensuring Canadian Competitiveness

Canada’s natural resource wealth has attracted natural resource investors and operators for over a century, backed by quality infrastructure, rule of law, robust environmental and labour standards, and deep trading relationships. Canada can build on those strengths, taking the following steps:

  • Leverage government capital. Critical mineral projects face capital shortages. Governments can help bridge this gap with either direct equity positions or by providing long-term offtake agreements. Defence procurement is a focal point, where Canadian, U.S. and allied nations defence departments can source future supply of critical minerals and stockpile reserve through “virtual inventories” or long-term purchase commitments. If Canada meets a commitment to spend 2% of GDP on defence, this could unlock as much as $17 billion of new capital, annually, for mine development.
  • Limit price distortions from China. The mining industry now requires a “China premium” to counteract market distortions – primarily to offset the risk of China oversupplying markets to suppress global pricing. A minimum price floor, supported by government purchase agreements and other intervenions, adds price transparency and establishes revenue certainty to buffer price fluctuations. Alternatively, restrictions on Chinese products could support domestic pricing. This includes restricting Chinese supply outright, or enacting price adjustments such as anti-dumping, countervailing duties, or border adjustments (environmental and human rights standards).
  • Expand tax credits. Canada’s Critical Mineral Investment Tax Credit (ITC) excludes key defence critical minerals such as tungsten, indium, and beryllium. Eligibility could be further expanded beyond the current list of 15 minerals. Other options: allow for the stacking of tax credits, introduce Production Tax Credits (PTC) to support operating expenses (buffering against Chinese dumping) and enhance various government programs to more explicitly support critical minerals, including the Strategic Innovation Fund and Canada Growth Fund.
  • Secure market access. Tariff threats and Buy America programs hinder capital flows into non-U.S. jurisdictions. Minimizing tariff barriers abroad and investing in domestic refining and processing capacity ultimately secures demand for our products. On the supply side, securing our own supply chain is also critically important. Gallium is a Canadian success story, but relies on imported electronics from Taiwan (via the U.S.).
  • Invest in human capital. The Toronto Stock Exchange and TSX Venture Exchange are home to more miners than any other major developed world index, and with them comes a deep bench of mining talent. This talent is at risk, however, as engineers and a tech-minded generation increasingly looks to software and AI for careers. One startling fact: China has 39 university degree programs to train engineers in critical minerals; Canada has none.
  • Reduce approval times. Canada needs to consolidate processes, where possible. Critical minerals are as strategic as transportation, and related projects can be declared to be in the national interest to accelerate their development. The same sort of pragmatism can be applied at the provincial level, where collaboration across departments, with local communities and with Ottawa can be improved. Lastly, and perhaps most importantly, we will need to find new ways to accelerate project approval processes while not undermining the duty to consult Indigenous communities. More Indigenous equity in these projects, including through the national and various provincial loan guarantee programs, can unlock greater Indigenous wealth and capital for re-investment in societal infrastructure and future resource projects.
  • Enabling infrastructure. Given the remote nature of many critical mineral deposits, the lack of existing infrastructure is problematic including rail, road, ports, power transmission, and cell towers. Increased collaboration by Federal and provincial governments to provide anticipatory, enabling infrastructure can support project economics and limit mine development times.

For more, go to rbc.com/thetradehub.

Download the Report

Download

Contributors:

Shaz Merwat, Energy Policy Lead, RBC Climate Action Institute

John Stackhouse, Senior Vice-President, Office of the CEO, RBC

Vivan Sorab, Senior Manager, Clean Technology, RBC Climate Action Institute

Caprice Biasoni, Graphic Design Specialist

Shiplu Talukder, Digital Publishing Specialist

  1. Natural Resources Canada
  2. Center for Strategic and International Studies, Critical Minerals and the Future of the U.S. Economy, February 2025; Natural Resources Canada
  3. Natural Resources Canada
  4. U.S. Geological Survey
  5. Deloitte, 2025 Global Semiconductor Industry Outlook
  6. Arrow Electronics, Silicon vs. gallium nitride (GaN) semiconductors: Comparing properties & applications, March 21, 2024
  7. IEA, Minerals used in electric cars compared to conventional cars, May 5, 2021
  8. Bloomberg New Energy Finance, RBC Thought Leadership
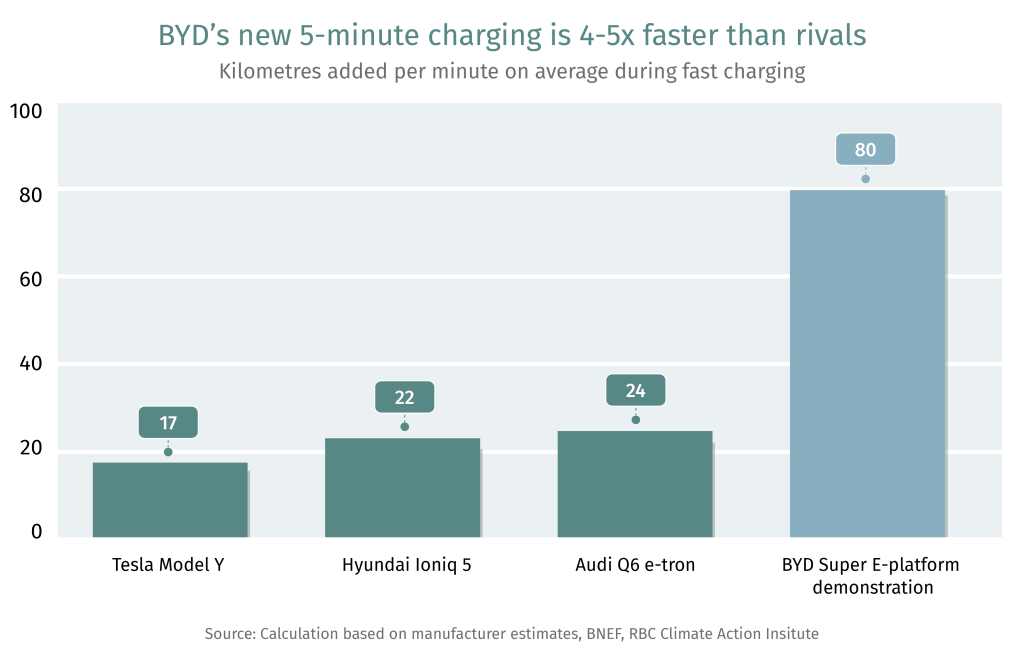
  9. IEA, Renewables 2024, October 2024
  10. Bloomberg New Energy Finance, RBC Thought Leadership
  11. Natural Resources Canada
  12. Science History Institute, Manufacturers Case Study, Using the Rare Earth Elements
  13. Wall Street Journal, What Scared Ford’s CEO in China, September 14, 2024
  14. Center for Strategic and International Studies, Critical Minerals and the Future of the U.S. Economy, February 2025
  15. Ibid
  16. Natural Resources Canada
  17. IEA, Global Critical Minerals Outlook 2024, May 2024
  18. Ibid
  19. Reuters, Chinese firms control around 75% of Indonesian nickel capacity, report finds, February 5, 2025
  20. Center for Strategic and International Studies, Critical Minerals and the Future of the U.S. Economy, February 2025
  21. AidData, Power Playbook: Beijing’s Bid to Secure Overseas Transition Minerals, January 28, 2025
  22. IEA, Energy Technology Perspectives 2024, October 30, 2024
  23. U.S. International Trade Commission, data accessed via DataWeb
  24. Ibid
  25. U.S. Geological Survey Mineral Commodities Survey; U.S. International Trade Commission, data accessed via DataWeb; USA Trade Online, U.S. Census Bureau
  26. U.S. Geological Survey
  27. Ibid
  28. U.S. International Trade Commission, data accessed via DataWeb; USA Trade Online, U.S. Census Bureau
  29. Company website
  30. Natural Resource Canada
  31. IEA, Global Critical Minerals Outlook 2024, May 2024
  32. Natural Resources Canada
  33. IEA, Global Critical Minerals Outlook 2024, May 2024
  34. Company website
  35. IEA, Global Critical Minerals Outlook 2024, May 2024
  36. Natural Resources Canada
  37. U.S. International Trade Commission, data accessed via DataWeb; USA Trade Online, U.S. Census Bureau