
The Producer Price Index (PPI) tells us what’s happening with prices for businesses before it reaches consumers, acting as an advance indicator for identifying inflation pressures.
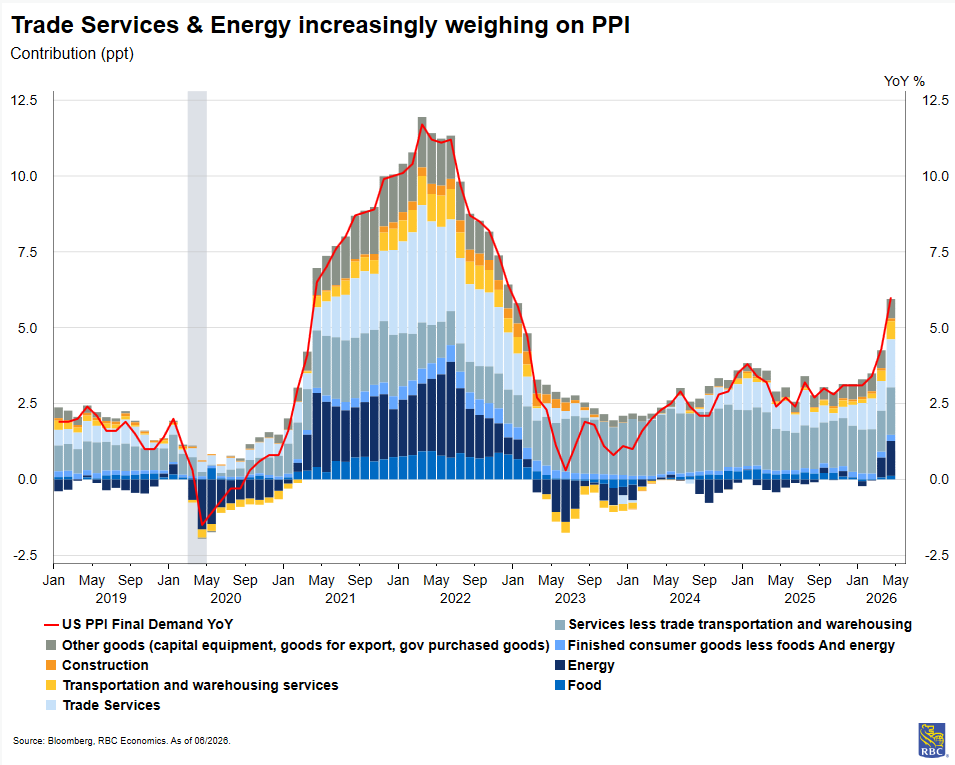
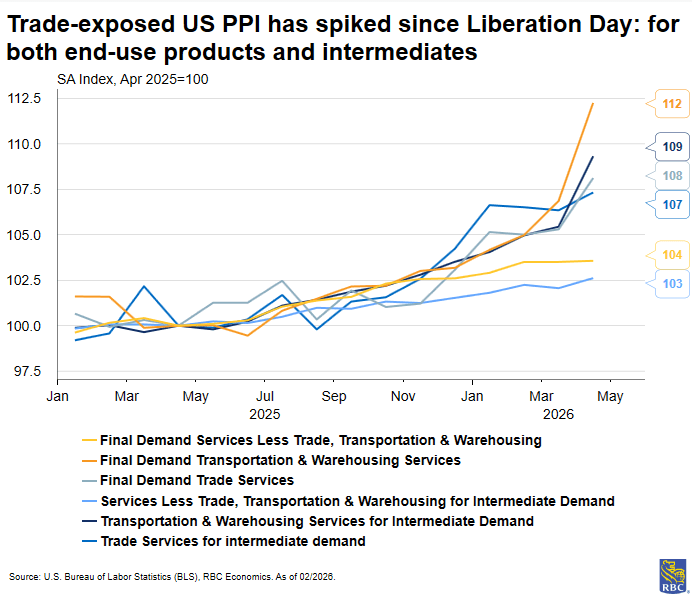
Currently, the signals are flashing red—business input costs are rising as a result of tariffs and energy prices.
These price pressures will likely show up in consumer prices in the months ahead, and we expect this dynamic will prevent the Federal Reserve from delivering any rate cuts in 2026.
Why are we focused on the PPI?
Against the current backdrop of compounding tariff pressures and an oil price shock, the US inflation picture is heating up again. The PPI measure of inflation re-accelerated to 6.0% year-over-year in April—the highest reading since 2022.
We’ re paying close attention to how businesses are handling rising input costs by monitoring PPI data, because it gives us important clues about costs flowing through supply chains. As we continue to monitor PPI for signs of price pass-through, we lay out what the changes mean for inflation.
Looking ahead, key PPI indicators to watch include intermediate demand processed materials (for commodity prices), final demand energy and transportation (for oil shock breadth), final demand finished consumer goods (for tariff pass-through), and trade services margins (for corporate profit direction).
What does PPI measure?
The focus of PPI is business costs. It measures the average change in prices received by domestic producers for their output.
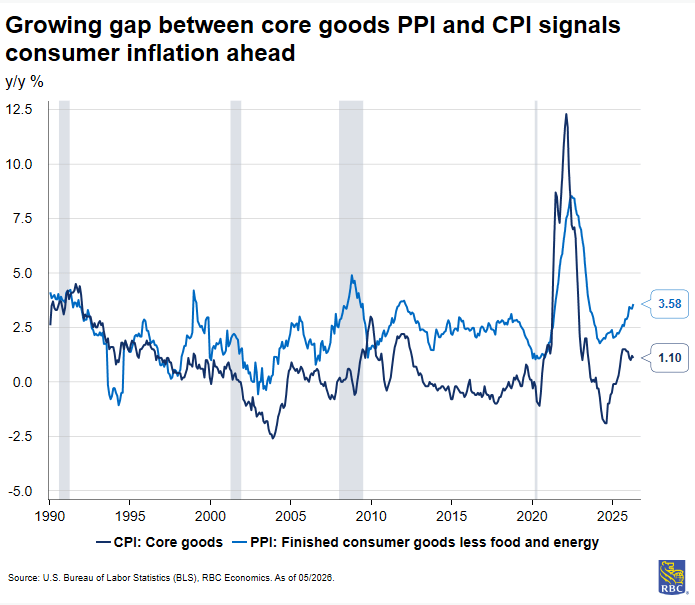
There is an exception to the conventional definition for PPI for wholesale and retail trade, which we address below. The difference between prices paid and prices received is a meaningful one. Price pressures show up at the producer level before reaching consumers, making PPI a leading indicator for the Consumer Price Index (CPI).
PPI includes output in all goods-producing sectors of the US economy, and roughly 70% of services sector output (among excluded services are education and residential real estate).
The program is large. As of January 2024, it publishes roughly 10,000 indexes spanning industry prices, commodity prices, and aggregate measures. Most prices reported to PPI are measured at the point when the product leaves the producer’s facility, so it does not include transportation, insurance, or delivery costs. The exception is transportation and warehousing services, which includes the price for transportation of goods.
After initial publication, PPI indexes can be revised over the following three months before a final index is posted in the fourth month.
Some PPI series feed into Personal Consumption Expenditures (PCE) deflators, accounting for about 20% of the total PCE basket. The most important inputs include health care services, domestic scheduled air transportation, and some finance and insurance series. To that end, the PPI release is something that is closely monitored by the Fed.
Retail and wholesale margins are critical to consumer prices
Wholesalers and retailers distribute products rather than transform them; therefore, their PPI calculation is different to other sectors.
For example, when an appliance wholesaler purchases washing machines from a manufacturer, the difference between what the wholesaler paid the manufacturer and how much they resell the appliance to the retailer is what is captured by PPI: The difference between the selling price and acquisition price of that good. The Bureau of Labor Statistics (BLS) defines this as the “gross margin price,” which reflects the value added by the business. In this case, the appliance wholesaler for services including bulk breaking, warehousing, and transporting the products.
The same logic applies to retail when the appliance retailer sells the washing machine to a consumer. Wholesalers’ and retailers’ PPIs are grouped together within the PPI and categorized as “Trade Services.” The margin price reflected in trade services PPI is equal to:
Current Selling Price – Current Acquisition Price = Margin Price
Since the margin is the difference between two independently moving prices, small shifts in either direction can produce swings in trade services PPI. A wholesaler absorbing higher input costs without raising selling prices compresses the margin. A retailer marking up prices while acquisition costs stay flat widens it.
It’s important to note that the trade services metric does not give us a clear read on whether acquisition prices or selling prices changed.
Why are input prices important?
The relationship between PPI and CPI is important, because it gives us clues about pricing decisions and margins. When PPI exceeds CPI, this suggests the cost of producing a good is rising faster than a firm’s ability to raise its selling price. We often see this in response to commodity price spikes.
For example, in the case of an appliance manufacturer, if prices for copper or aluminum spike, it becomes more expensive to produce appliances. In response, the manufacturer may opt to mark up prices to offset increased input costs, driving up the appliance-wholesaler’s cost of acquisition. The higher prices received by the appliance manufacturer would raise PPI for household appliances.
PPI as an indicator for corporate profits
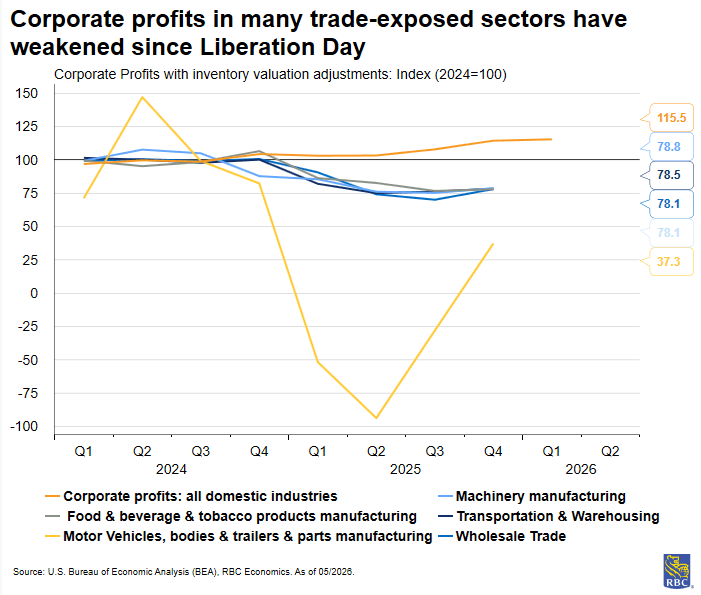
PPI can be helpful to gauge the direction of corporate profits, and acts as an indicator of firms’ pricing power in relation to CPI.
If PPI is rising faster than CPI, this suggests that producers’ prices are rising faster than consumer prices. For example, a commercial baker may charge more for bread if wheat prices rise, but a neighborhood café that purchases bread from the bakery may not adjust menus reflect higher prices.
If we see PPI exceed CPI for a prolonged period of time, then end-stage sellers are likely to raise prices; otherwise it could spell trouble for corporate profit margins.
Trade services PPI is the exception. When it rises, it suggests widening margins—selling prices are rising faster than acquisition costs (or acquisition costs are falling at a greater magnitude than selling prices). A falling trade services PPI signals the opposite: Compressed margins. If sustained, margin compression can lead to higher consumer prices down the road (if businesses have sufficient pricing power to pass on costs) or cost-cutting measures such as reductions in jobs.
The data collection process
PPI data is collected through a survey of private sector producers based in the US. The BLS collects samples from producer’s list of transactions, which are weighted based on the share of the producer’s total revenues (i.e., categories that generate more revenue are more likely to be selected). The sample gets refreshed periodically, and industries undergoing rapid change (such as semiconductors) get resampled more often to reflect new products entering the market.
Price determining characteristics matter as well. A PPI price is defined as “net revenue accruing to a specified producing establishment from a specified kind of buyer for a specified product shipped, or service provided, under specified transaction terms on a specified day of the month.” In practice, these characteristics include product specifications (in the case of vehicles—engine size, trim level, color) and transaction terms (buyer type, order volume, contract length).
For most price data that feeds into the PPI, prices are collected on the Tuesday of the week containing the 13th of the month with some exceptions. Farm products may be priced on a day of the week other than Tuesday, and some service industries report prices that reflect average changes for some portion of the month or entire month.
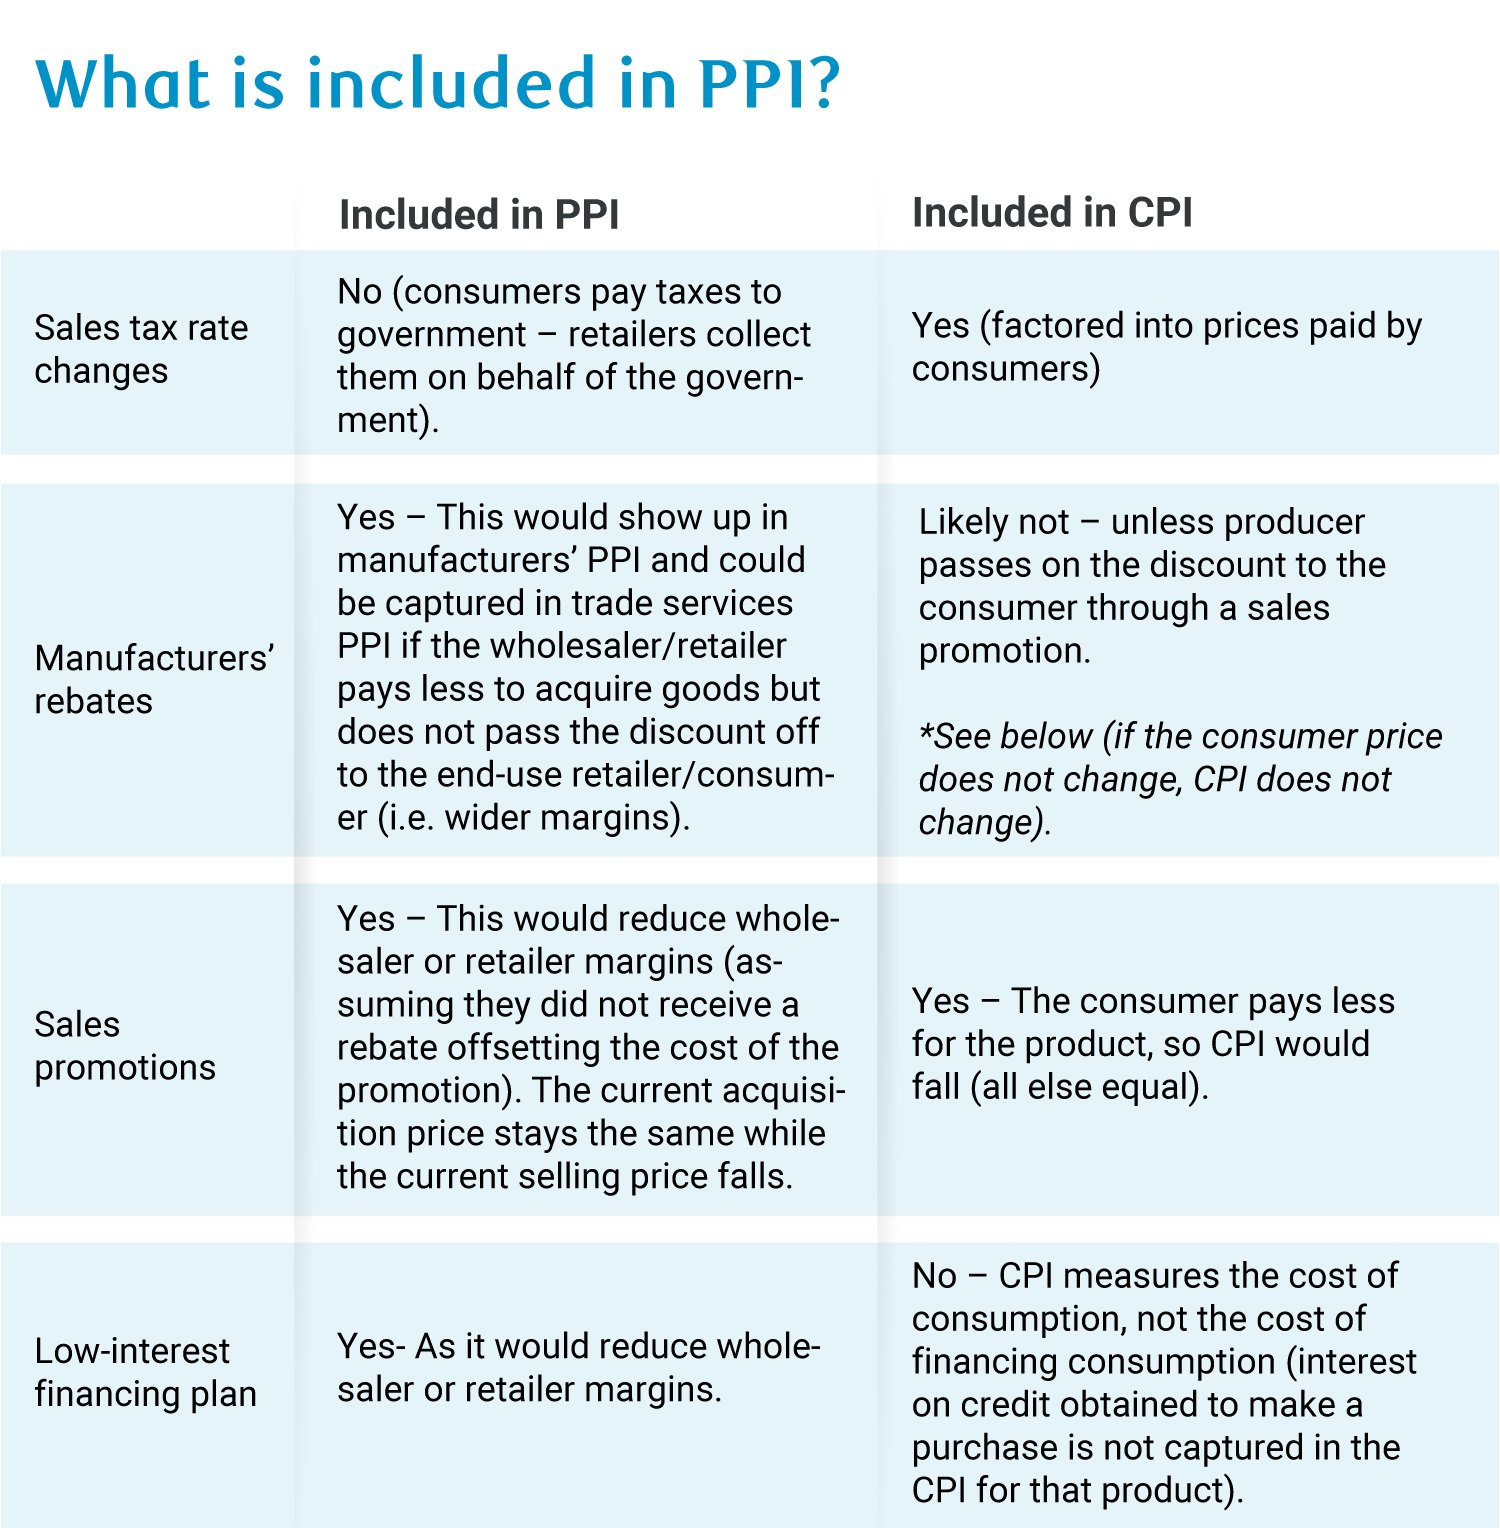
What’s included and what isn’t
PPI only includes products that are produced by domestic firms. So, imports, by definition, are excluded. PPI does, however, include goods shipped between establishments owned by the same company.
Another rule for PPI is it includes only components of personal consumption that are not paid for by the consumer. For example, a medical expense paid for by an employer-sponsored health insurance plan or the government would show up in PPI, but not CPI.
Here are some examples of what’s captured in PPI and what is not:
Calculating headline PPI and its subcomponents
The PPI uses a fixed-quantity framework to construct indexes: Prices change from month to month, but quantities remain fixed.
The goal is to isolate price movements from changes in the volume. The PPI uses multiple layers of weights to ensure products that have more economic significance have a proportionate impact on the index. These weights are updated once every five years, but the BLS releases relative importance figures once a year to provide more timely updates. Relative importance measures tell us how important a product is today, rather than at the time when the weight was originally set.
Classifying the stages of production
PPI is primarily organized by stage of production using the Final Demand–Intermediate Demand (FD-ID) system. The distinction is straightforward: If a product is sold to its end buyer (a consumer, business purchasing equipment, government, or foreign buyer), it’s final demand. If it’s sold to another business as an input for further production, it’s intermediate demand.
Steel sold to an auto manufacturer is intermediate demand. A finished car sold to a consumer is final demand. Within each stage, PPI breaks out trade services and transportation separately.
Transportation and warehousing capture the cost of moving and storing goods. At final demand, this includes cargo transportation to end buyers and passenger transportation. At intermediate demand, this includes business travel and freight—for example, an accountant’s flight to a client site for an audit, or a trucking company shipping engines to an assembly plant.
Construction is also captured separately. The final demand construction index tracks price changes for new construction and maintenance and repair sold to end buyers. For example, a manufacturer building a new factory or a municipality building a highway.
Since new construction is capital investment, it’s always included in final demand. The intermediate demand construction index only captures maintenance and repair purchased by firms as inputs to ongoing production. For example, a trucking company repaving its loading dock to keep operations running.
About the authors:
Mike Reid is Head of US Economics at RBC. He is responsible for generating RBC’s US economic outlook, providing commentary on macro indicators, and producing written analysis around the economic backdrop.
Carrie Freestone is a Senior US Economist at RBC. She is responsible for generating RBC’s US economic forecasts across GDP, employment, and inflation, and providing macro commentary through publications, presentations, and the media.
Imri Haggin is an US Economist at RBC, where he focuses on thematic research. His prior work has centered on consumer credit dynamics and treasury modeling, with an emphasis on leveraging data to understand behavior.
This article is intended as general information only and is not to be relied upon as constituting legal, financial or other professional advice. The reader is solely liable for any use of the information contained in this document and Royal Bank of Canada (“RBC”) nor any of its affiliates nor any of their respective directors, officers, employees or agents shall be held responsible for any direct or indirect damages arising from the use of this document by the reader. A professional advisor should be consulted regarding your specific situation. Information presented is believed to be factual and up-to-date but we do not guarantee its accuracy and it should not be regarded as a complete analysis of the subjects discussed. All expressions of opinion reflect the judgment of the authors as of the date of publication and are subject to change. No endorsement of any third parties or their advice, opinions, information, products or services is expressly given or implied by Royal Bank of Canada or any of its affiliates.
This document may contain forward-looking statements within the meaning of certain securities laws, which are subject to RBC’s caution regarding forward-looking statements. ESG (including climate) metrics, data and other information contained on this website are or may be based on assumptions, estimates and judgements. For cautionary statements relating to the information on this website, refer to the “Caution regarding forward-looking statements” and the “Important notice regarding this document” sections in our latest climate report or sustainability report, available at: https://www.rbc.com/community-social-impact/reporting-performance/index.html. Except as required by law, none of RBC nor any of its affiliates undertake to update any information in this document.
Get the latest forecasts and analysis from RBC Economics.
Subscribe Now
- Why are we focused on the PPI?
- What does PPI measure?
- Retail and wholesale margins are critical to consumer prices
- Why are input prices important?
- PPI as an indicator for corporate profits
- The data collection process
- What’s included and what isn’t
- Calculating headline PPI and its subcomponents
- Classifying the stages of production