

 EN
EN 


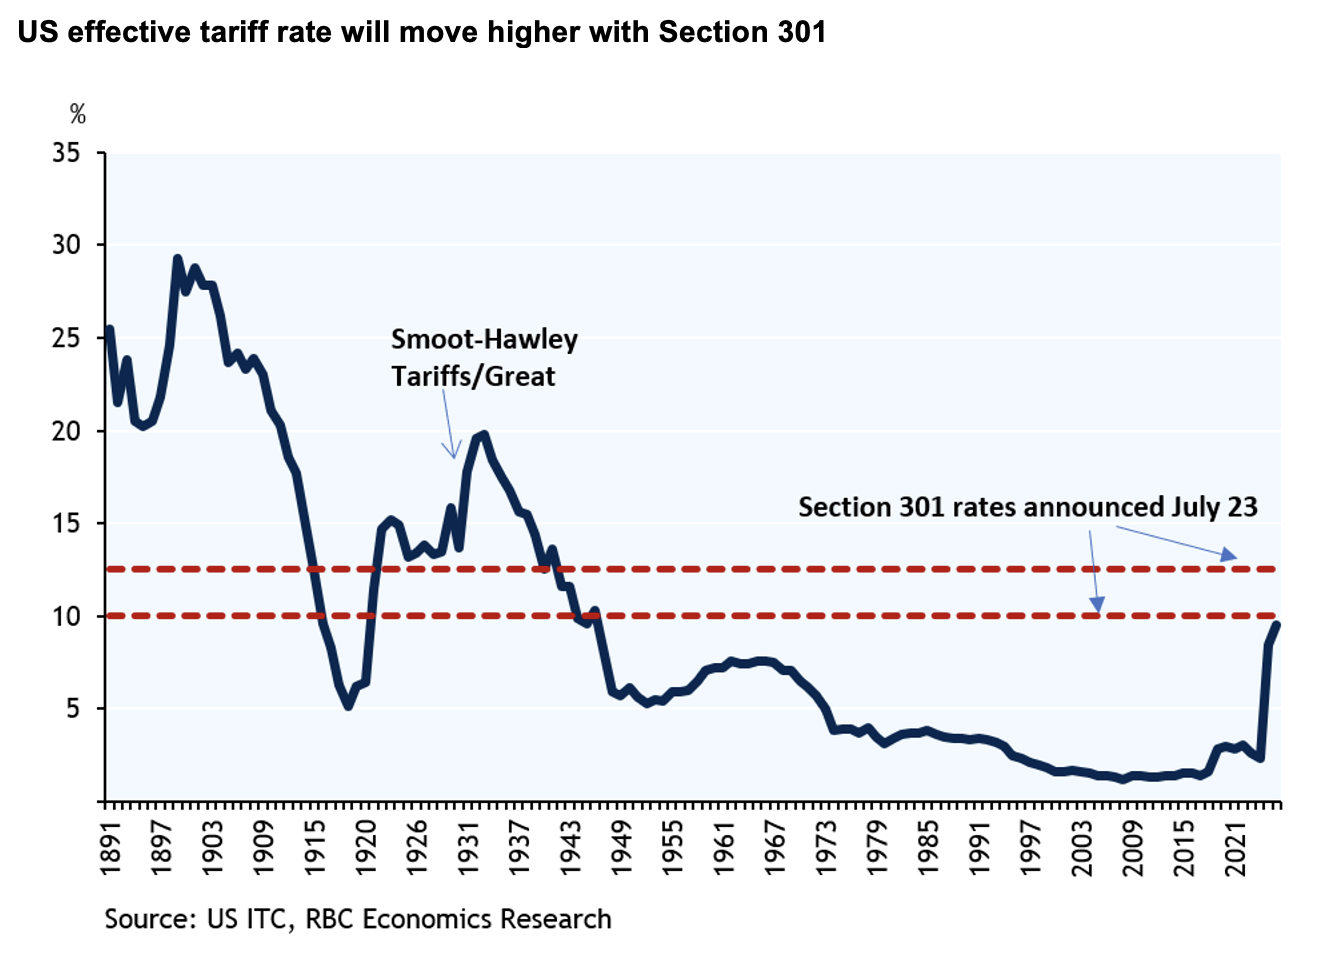
A July 23rd announcement from the Office of the United States Trade Representative (USTR) adds a new layer of tariffs to the US trade landscape. While the justification for the tariffs may be surprising – USTR is targeting 60 countries and the EU using Section 301 – the tariff rate should not be. Most countries will face a 10% to 12.5% duty rate that will cover approximately 99.4% of US imports, though varied exemptions will apply, lowering the amount of imports tariffed in practice. This brings the effective tariff rate back up to our previous estimates under the IEEPA tariffs. As we wrote back in February, it should be clear that tariffs are not going away. As we digest this next round, it’s worth reiterating our core tariff takeaways.
Tariffs are here to stay, and there’s no shortage of ways to impose them
Following the Supreme Court ruling on IEEPA, the administration moved quickly to impost Section 122. But with a 150-day statutory limit on Section 122 approaching this month, USTR moved forward with the new Section 301 forced-labor tariffs. Three days earlier, on July 20th, the administration invoked a provision dormant since the 1940s, with no prior record of ever being used to impose tariffs, to hit Canadian dairy, alcohol, and autos with an additional 50% duty. As we wrote in our one-year-retrospective, Section 122 was always the bridge and Section 232 was the sector-specific tool. Section 301 provides the ability to impose a blanket rate. It remains to be seen whether Section 201 or Section 338 will be applied more extensively, but for now the administration has found a way to impose its desired tariff rates.
Tariffs will put upward pressure on goods prices, again
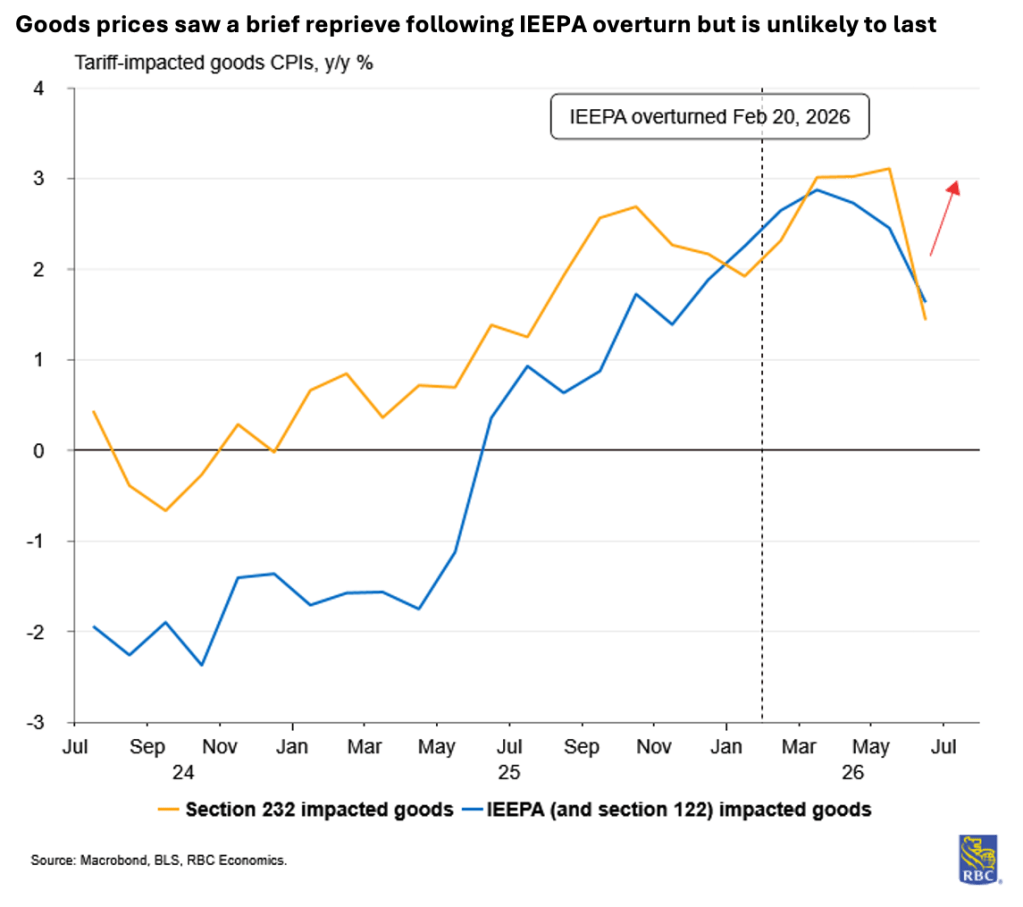
Following the announcement on Liberation Day in April 2025, core goods prices saw a sustained rise, with the y/y pace of inflation climbing from a flat reading to a peak of 1.2% in March 2026. The tariff-exposed sectors show it more clearly: apparel is up 3.9% y/y, household furnishings and operations 2.5% y/y, and recreation commodities 2.9% y/y, all well above where these categories have sat historically. Following the overturn of IEEPA, core goods prices have subsided, but pressures remain in the pipeline. Layering on new tariffs with the reality of higher energy prices means we expect to see a re-acceleration in goods prices. For broader inflation measures, it means we are unlikely to see material improvement in the path back to the Fed’s 2% target.
New tariffs will weigh on job creation in trade-exposed sectors
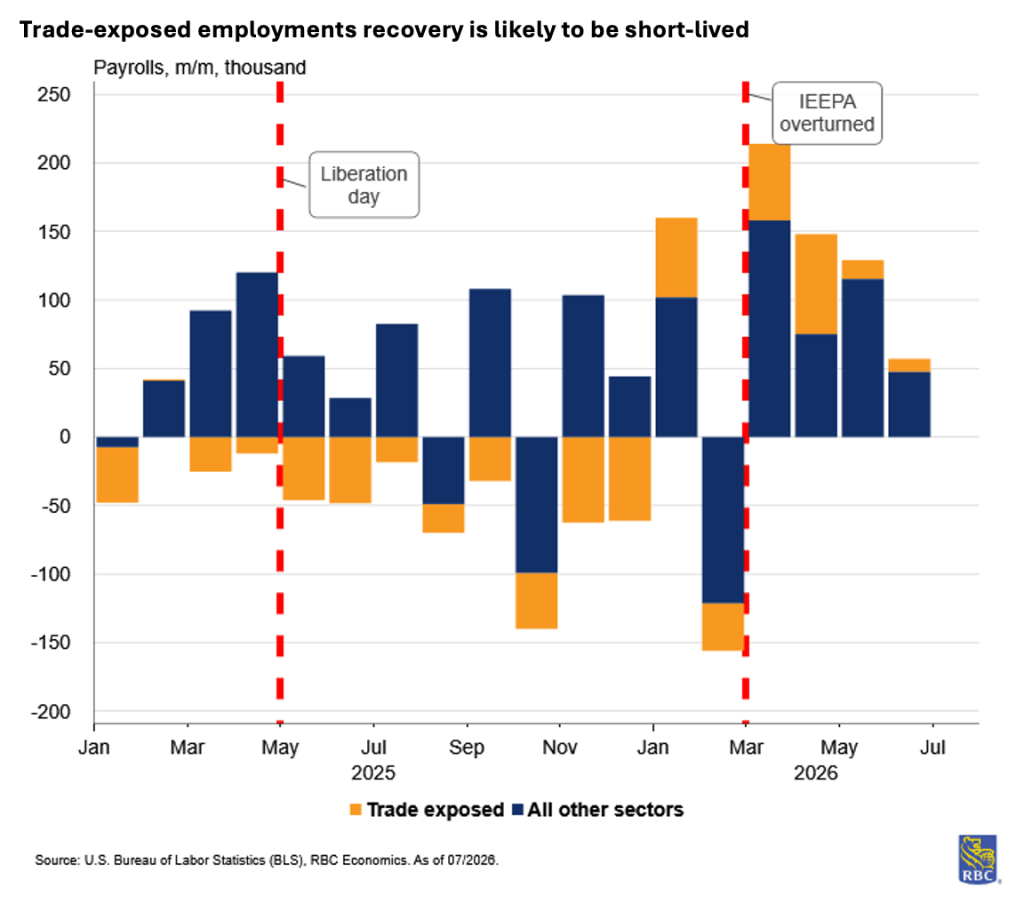
Following the announcement of IEEPA tariffs in April 2025, trade exposed jobs bore the brunt of the pain: manufacturing and transportation & warehousing had shed a combined roughly 180k jobs in 2025, while net job creation was essentially flat for the year. Payrolls have seen an acceleration in growth this year, an improvement that coincided with the overturn of IEEPA in February 2026. Since then, a significant share of job gains have been seen in trade exposed sectors. To be sure, however, they are far from being fully recovered. This announcement adds to the risk that the recovery will be short lived, and these trade exposed sectors could start to shed jobs again as cost pressures.
Tariffs have yet to deliver their stated goals
More than one year in, the goods trade deficit hasn’t narrowed, and manufacturing employment remains in decline. While tariff revenue ramped up in 2025, the overturn of IEEPA has resulted in refunds, largely negating the benefits to the deficit. Taken together, this is consistent with our broader view that the risks remain skewed to the upside for inflation and to the downside for the labor market – see our July Monthly Executive Briefing for the fuller picture.
Section 301 rates explained in more detail
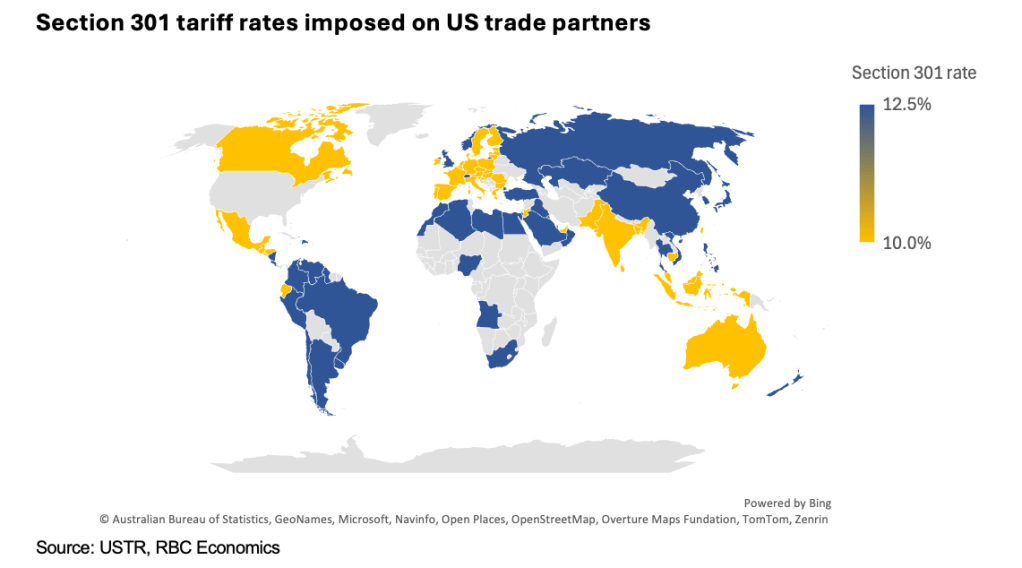
Section 301 tariffs of 10% or 12.5% have been placed on 60 trading partners for failing to adopt or effectively enforce a ban on imports made with forced labor. This is not a targeted policy, as the USTR notes that the action covers nearly all US imports, impacting every major trading parter. These duties sit on top of, not in place of, existing tariffs, with the exception of Section 232. But a long list of product exemptions means these tariff rates will apply to a minority of total US imports and do not constitute a significant change relative to the expiring section 122 tariff rate regime – they leave tariff rates still well-above levels in 2024 but also still below peak levels under the IEEPA tariff regime prior to the February Supreme Court ruling.
It is worth understanding the mechanism in place for rate differentiation. Seventeen economies that have imposed a forced labor trading ban or committed to one through an Agreement on Reciprocal Trade, or adopted a partial structure, get the lower 10% rate. As of writing, this includes Canada, Mexico, India, the UK, and several partners in Central America and South Asia. Those deemed without, 38 countries including China and Brazil, get a flat 12.5%.
A third grouping (the EU, Taiwan, Japan, Korea, and Switzerland) get their Section 301 duty capped net of the most-favored-nation rate (baseline tariff on a given product from any WTO member) rather than stacked on top. This is 10% for the EU and Taiwan and 12.5% for Japan, Korea, and Switzerland.
The distinction of this third grouping is not related to labor laws; these are the five partners that negotiated reciprocal trade frameworks in 2025 that set an all-inclusive tariff ceiling (hence, MFN plus any additional US duties combined, rather than layered). Canada, Mexico, and the UK also struck 2025 deals, but those weren’t built around a ceiling in the same way.
About the Authors:
Frances Donald is the Chief Economist at RBC and oversees a team of leading professionals, who deliver economic analyses and insights to inform RBC clients around the globe. Frances is a key expert on economic issues and is highly sought after by clients, government leaders, policy makers, and media in the US and Canada.
Mike Reid is Head of US Economics at RBC. He is responsible for generating RBC’s US economic outlook, providing commentary on macro indicators, and producing written analysis around the economic backdrop.
Carrie Freestone is a Senior US Economist at RBC. Carrie is responsible for projecting key US indicators including GDP, employment, consumer spending and inflation for the US. She also contributes to commentary surrounding the US economic backdrop which she delivers to clients through publications, presentations, and the media.
Imri Haggin is an US Economist at RBC, where he focuses on thematic research. His prior work has centered on consumer credit dynamics and treasury modeling, with an emphasis on leveraging data to understand behavior.
This article is intended as general information only and is not to be relied upon as constituting legal, financial or other professional advice. The reader is solely liable for any use of the information contained in this document and Royal Bank of Canada (“RBC”) nor any of its affiliates nor any of their respective directors, officers, employees or agents shall be held responsible for any direct or indirect damages arising from the use of this document by the reader. A professional advisor should be consulted regarding your specific situation. Information presented is believed to be factual and up-to-date but we do not guarantee its accuracy and it should not be regarded as a complete analysis of the subjects discussed. All expressions of opinion reflect the judgment of the authors as of the date of publication and are subject to change. No endorsement of any third parties or their advice, opinions, information, products or services is expressly given or implied by Royal Bank of Canada or any of its affiliates.
This document may contain forward-looking statements within the meaning of certain securities laws, which are subject to RBC’s caution regarding forward-looking statements. ESG (including climate) metrics, data and other information contained on this website are or may be based on assumptions, estimates and judgements. For cautionary statements relating to the information on this website, refer to the “Caution regarding forward-looking statements” and the “Important notice regarding this document” sections in our latest climate report or sustainability report, available at: https://www.rbc.com/community-social-impact/reporting-performance/index.html. Except as required by law, none of RBC nor any of its affiliates undertake to update any information in this document.

