
Bottom Line:
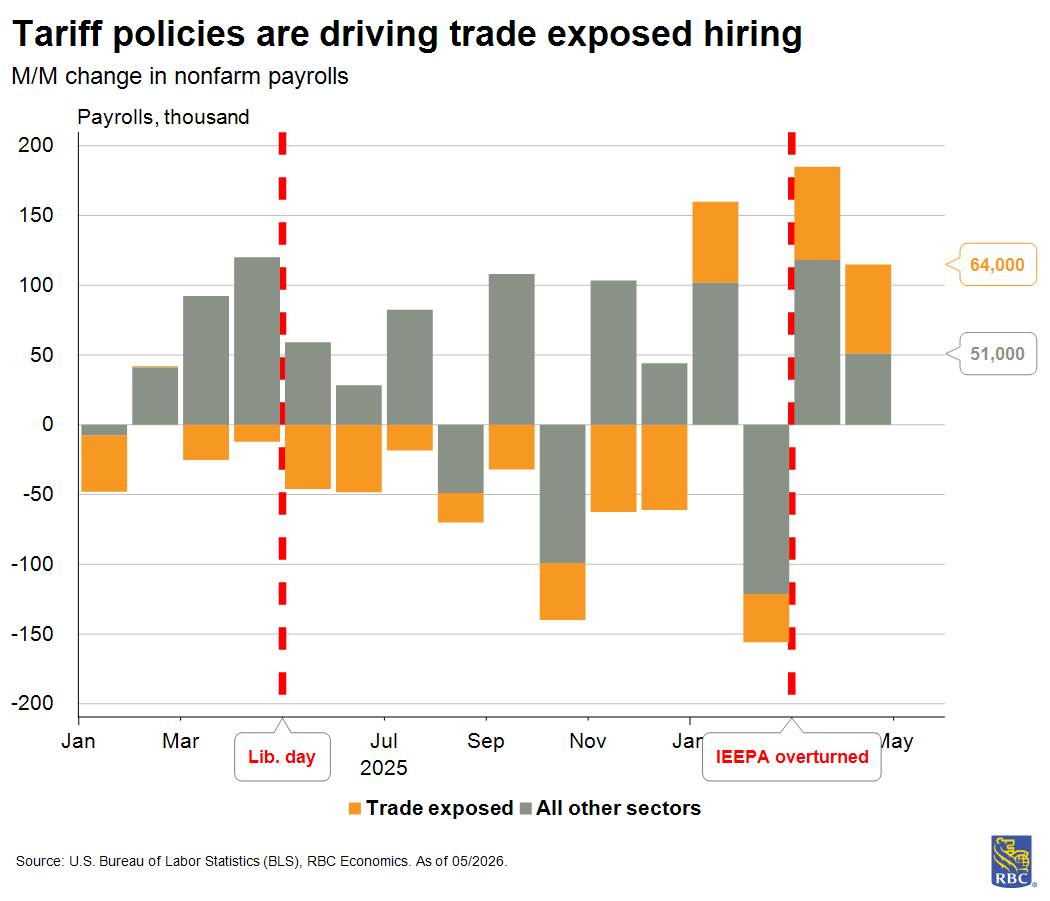
The April payroll print marked a massive upside for a second consecutive month (+115k vs +65k consensus) and the unemployment rate held steady at 4.3%. We have been operating under the assumption that structural tightness will limit net new hiring and keep the unemployment rate low. And two consecutive months of strong payrolls prints are still consistent with this narrative. It is too soon to say whether we have reached a turning point, but we know that last year’s exceptional weakness in trade-exposed sectors appears to be moderating, for now. Just as firms who over-hired during the aftermath of the pandemic had to reverse course, sectors that put off hiring during the peak of the Trade War have opted to add jobs over the last two months. The overturn of IEEPA created an opportunity for trade related sectors to increase activity without being subject to those tariffs (although some remain in force viz a viz section 232).
Still, the bulk of job growth was in health care, and we don’t expect that story to change. Encouragingly, consumer-reliant sectors reflect a consumer backdrop that is not succumbing to demand destruction as a result of higher gas prices – hiring in retail trade, leisure & hospitality, and other services was robust and is reminder that it’s hard to bet against the consumer and the US economy. it’s hard to bet against the consumer and the US economy.
The employment report this month supports our view that we will continue to see a stable unemployment rate and a sidelined Fed through the remainder of 2026.
Here are key takeaways from the April employment report:
1) Cyclically-exposed services sector hiring is improving after months of weakness – but it’s too soon to say if this is a trend
-
A total of 65K jobs were added in the cyclically-exposed services sector (which excludes private education, health and government hiring). While this looks exceptionally strong, over the last year, this sector is still down 84k from year-ago. While the gains over the past two months help offset the broader decline, the question remains: is this a turning point? With some uncertainty surrounding future trade policy, we don’t think these sectors are out of the woods yet.
-
The wholesale trade (+6k), retail trade (+22k), transportation and warehousing (+30k), and leisure and hospitality (+14k) sectors all added jobs in April. Both the information and finance sectors shed jobs over the last two months, despite the strong headline gains. These sectors both reported to have the highest rates of AI adoption across the economy.
-
The health sector is still the only sector that added jobs over the past year. Demographic forces (i.e., the aging of the population) will help support job growth in this sector over the next several years.
2) The unemployment rate is holding steady despite all of the layoff headlines
-
The unemployment rate held steady at 4.3% for two consecutive months. Beneath the surface, we saw the number of unemployed new entrants and re-entrants rise (+119k), reflecting a mismatch of skills between those workers and the job openings.
-
The unemployment rate rose slightly for workers aged 20 to 24 (i.e., recent college grads). And the rise in the underemployment rate to 8.2% from 8.0% suggests younger workers with college degrees are settling for jobs that don’t require those degrees. The continued uptick in delinquent student loans reflects a tough job market for recent grads.
-
We also saw a slight uptick in marginally attached workers working part-time for economic reasons, a sign that some firms are cutting back on hours to reduce costs. However, the notable rise Aggregate Weekly Hours Index for private sectors (+0.4ppt) signals that overall labor demand remains strong.
3) Workers are seeing strong growth in take home pay
-
In a tight labor market, we are closely monitoring both hours worked and average hourly earnings. Combining those measures to get average weekly earnings (i.e., the take home pay for workers) is a better gauge of consumer health – one that shows consumers can maintain their ability to spend.
-
Wages are sticky, meaning it’s difficult for businesses to reduce wage rates as a cost cutting measure. Instead, a reduction of hours is the mechanism by which firms can lower employment costs when other input costs rise. That was not the case in April, despite the rise in energy prices.
-
Looking at the industry level, trade-exposed sectors (wholesale, transportation and warehousing) show employees working fewer weekly hours since Liberation Day – likely a strategy to partially offset tariff costs. But white-collar service sectors, namely, finance and information, are also showing weakness in hours against a backdrop of accelerating AI adoption.
About the Authors:
Mike Reid is Head of US Economics at RBC. He is responsible for generating RBC’s U.S. economic outlook, providing commentary on macro indicators, and producing written analysis around the economic backdrop.
Carrie Freestone is a Senior US Economist at RBC. Carrie is responsible for projecting key US indicators including GDP, employment, consumer spending and inflation for the US. She also contributes to commentary surrounding the US economic backdrop which she delivers to clients through publications, presentations, and the media.
Imri Haggin is an US Economist at RBC, where he focuses on thematic research. His prior work has centered on consumer credit dynamics and treasury modeling, with an emphasis on leveraging data to understand behavior.
This article is intended as general information only and is not to be relied upon as constituting legal, financial or other professional advice. The reader is solely liable for any use of the information contained in this document and Royal Bank of Canada (“RBC”) nor any of its affiliates nor any of their respective directors, officers, employees or agents shall be held responsible for any direct or indirect damages arising from the use of this document by the reader. A professional advisor should be consulted regarding your specific situation. Information presented is believed to be factual and up-to-date but we do not guarantee its accuracy and it should not be regarded as a complete analysis of the subjects discussed. All expressions of opinion reflect the judgment of the authors as of the date of publication and are subject to change. No endorsement of any third parties or their advice, opinions, information, products or services is expressly given or implied by Royal Bank of Canada or any of its affiliates.
This document may contain forward-looking statements within the meaning of certain securities laws, which are subject to RBC’s caution regarding forward-looking statements. ESG (including climate) metrics, data and other information contained on this website are or may be based on assumptions, estimates and judgements. For cautionary statements relating to the information on this website, refer to the “Caution regarding forward-looking statements” and the “Important notice regarding this document” sections in our latest climate report or sustainability report, available at: https://www.rbc.com/community-social-impact/reporting-performance/index.html. Except as required by law, none of RBC nor any of its affiliates undertake to update any information in this document.
