
Bottom Line:
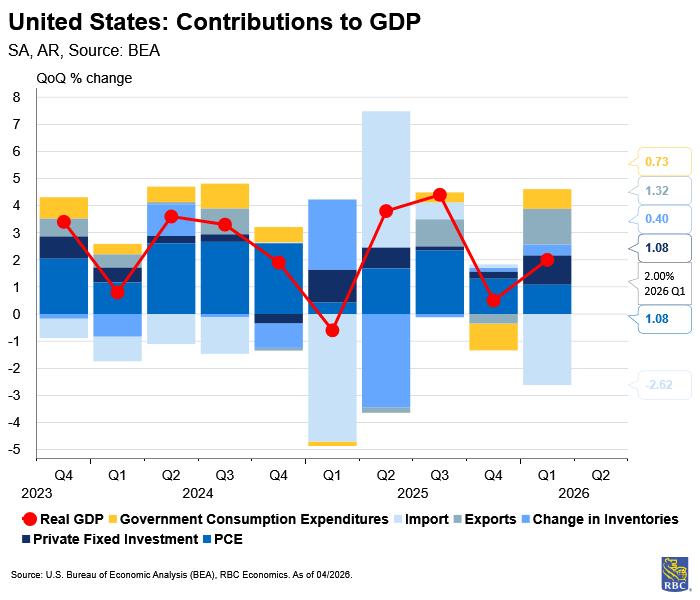
The Q1 GDP release shows us that the US economy remains resilient in the face of compounding shocks – BEA reported GDP increased at an annual rate of 2.0% in the advance report. Consumer spending remained positive despite concerns about demand destruction due to higher gas prices. But the growth came at the expense of savings – the personal saving rate (3.6% in March) fell to its lowest level since 2022. Nonresidential investment contributed equally to growth in Q1 – this remains a story of AI infrastructure buildout which is propping up otherwise-weak nonresidential investment. And headline GDP growth was distorted by the government shutdown payback and trade policy gyrations.
Four key themes stood out in the release:
-
March data shows the consumer remains resilient – but the strong spending comes at the expense of savings. The personal saving rate dipped to 3.6%, as consumers absorbed higher gas prices through dissaving rather than demand destruction. But with the saving rate at historically low levels, there is not much room for further savings decline, and the alternatives (i.e., increase credit usage or demand destruction) will become increasingly likely the longer the Conflict in the Middle East lasts. For now, the low layoffs and strong income gains suggest the consumer will continue to hang in there for April.
-
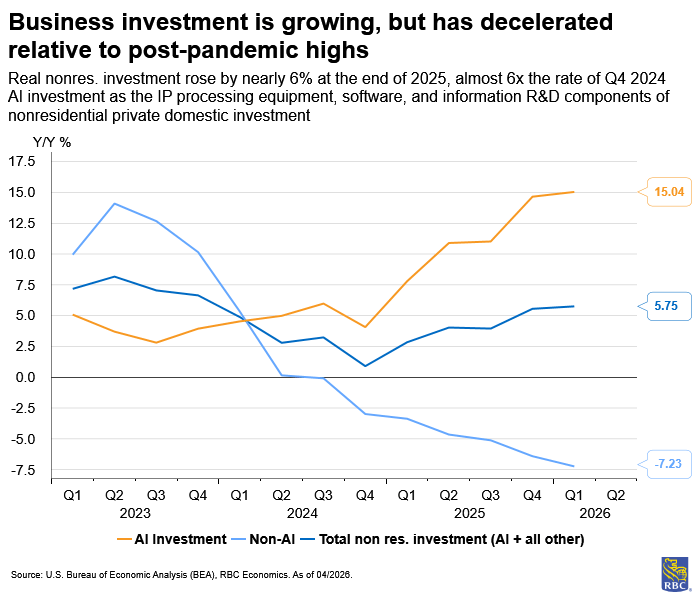
AI investment remains a driving force of growth. The growth, however, is shifting from data center construction (i.e., nonresidential structures) and into equipment and software, reflecting the work being done inside of the completed structures. We expect this will provide a tailwind throughout 2026, especially with the added OBBBA benefit of accelerated depreciation for capex.
-
Trade distortions are still at play. Imports surged 21% in Q1, likely in response to the opening created by the overturn of IEEPA. This SCOTUS ruling opened a window for businesses to import goods without tariffs, mirroring the jump in Q1 2025. At the same time, we saw a 4th consecutive drawdown of inventories – a strategy we see businesses using to delay tariff passthrough. The import spike this quarter should help to restock inventories, although the data may not reflect this immediately, as the use of bonded warehouses can distort the timing.
-
The government shutdown ended, providing some payback for growth in Q1. But don’t expect to see strong growth in the government sector next quarter. And without that boost, we expect GDP growth is set to slow below 2% in Q2.
Looking at the details within the Q1 GDP Advance:
-
Consumer spending remained positive in Q1 (+1.6% QoQ annualized) but this was primarily a services sector story as durable goods spending was flat, and nondurables pulled back slightly (-0.2%).
-
AI investment is still strong. While non-residential structures continue to slow, data centers are being outfitted with both equipment (+17.2%) and software (+13.0%).
-
As expected, we saw a rebound in government consumption in Q1 (+4.4%) that was a reversal of a mechanical pullback in federal government spending because of the October government shutdown.
-
Trade distortions are still at play – imports surged (+21.4%) as the IEEPA overturn likely created a window for tariff-free imports. Importantly, we saw a fourth consecutive quarter of inventory drawdowns.
-
We have been closely watching final sales to private domestic purchasers (FPDP) – a measure of growth that strips out government consumption, exports, and inventories (i.e., removing the volatile distortions). Encouragingly, it rose 2.5% in Q1, up from +1.8% in Q4, suggesting accelerating momentum beneath the veil of distortions.
And concurrent with the Q1 release was March income and spending data:
-
Goods-sector spending spiked in March, but this was predominantly a price effect as nondurables spending rose +1.4% m/m. Gasoline accounted for 41% of the increase in personal consumption in the month of March.
-
Services spending rose +0.4% m/m in March, with strength in health care, financial services, transportation (despite higher fuel prices) and recreation services.
-
Personal income growth exceeded expectations (+0.6% m/m) in March. Private sector wage and salary growth exceeded expectations (+0.4% m/m). Social Security (+0.6% m/m) and Medicare receipts (+0.8% m/m) rose meaningfully, partially offset by a retracement in unemployment insurance.
-
Despite strong income growth, spending outpaced causing the personal savings rate to fall to 3.6%, the lowest level since 2022 (. This was in line with our expectations that consumers would absorb higher gas prices through decreased savings rather than resorting to demand destruction.
About the Authors:
Mike Reid is Head of US Economics at RBC. He is responsible for generating RBC’s US economic outlook, providing commentary on macro indicators, and producing written analysis around the economic backdrop.
Carrie Freestone is a Senior US Economist at RBC. Carrie is responsible for projecting key US indicators including GDP, employment, consumer spending and inflation for the US. She also contributes to commentary surrounding the US economic backdrop which she delivers to clients through publications, presentations, and the media.
Imri Haggin is an US Economist at RBC, where he focuses on thematic research. His prior work has centered on consumer credit dynamics and treasury modeling, with an emphasis on leveraging data to understand behavior.
This article is intended as general information only and is not to be relied upon as constituting legal, financial or other professional advice. The reader is solely liable for any use of the information contained in this document and Royal Bank of Canada (“RBC”) nor any of its affiliates nor any of their respective directors, officers, employees or agents shall be held responsible for any direct or indirect damages arising from the use of this document by the reader. A professional advisor should be consulted regarding your specific situation. Information presented is believed to be factual and up-to-date but we do not guarantee its accuracy and it should not be regarded as a complete analysis of the subjects discussed. All expressions of opinion reflect the judgment of the authors as of the date of publication and are subject to change. No endorsement of any third parties or their advice, opinions, information, products or services is expressly given or implied by Royal Bank of Canada or any of its affiliates.
This document may contain forward-looking statements within the meaning of certain securities laws, which are subject to RBC’s caution regarding forward-looking statements. ESG (including climate) metrics, data and other information contained on this website are or may be based on assumptions, estimates and judgements. For cautionary statements relating to the information on this website, refer to the “Caution regarding forward-looking statements” and the “Important notice regarding this document” sections in our latest climate report or sustainability report, available at: https://www.rbc.com/community-social-impact/reporting-performance/index.html. Except as required by law, none of RBC nor any of its affiliates undertake to update any information in this document.
