

 EN
EN 


The US labor market has improved in 2026, adding an average 80,000 new jobs a month compared to less than 10,000 a month in 2025— highlighting our view on why it’s hard to bet against the US economy.
We continue to expect the job market will remain tight even as the Federal Reserve hikes interest rates. But importantly, that tightness shouldn’t be measured by net job creation (i.e., payroll growth) as before, because this indicator’s signal has diminished. Instead, we lay out a selection of key of indicators to monitor for any unexpected slowdown before it materializes in the headline labor market data.
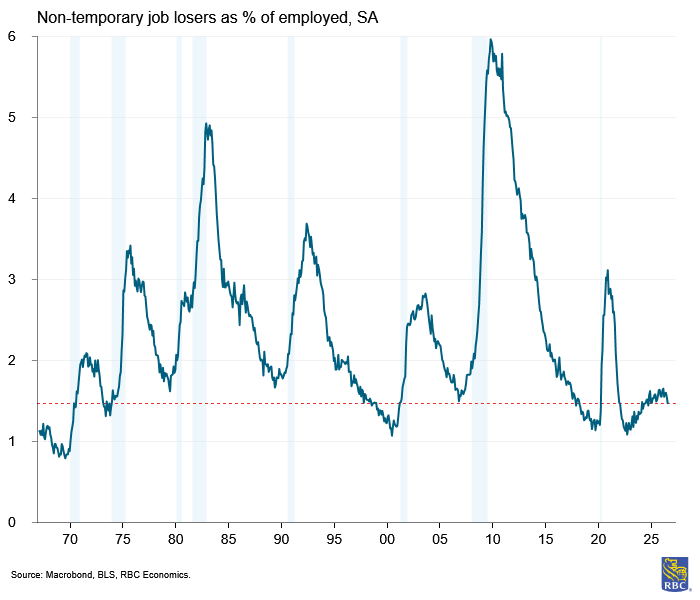
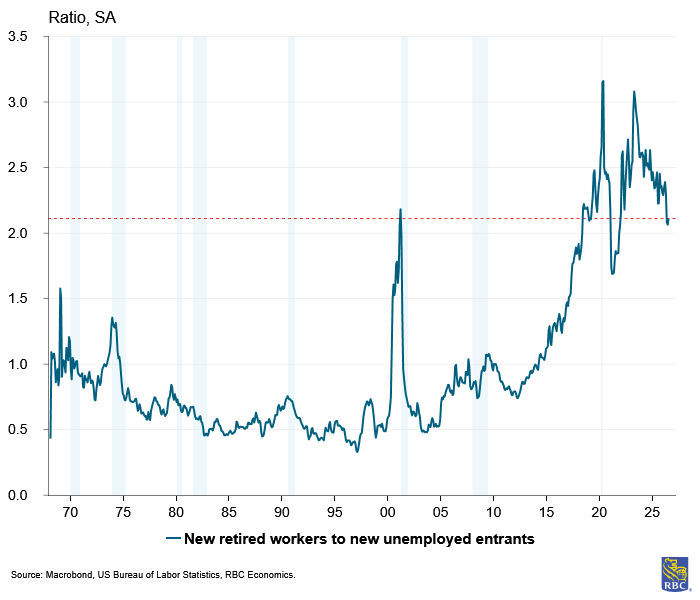
The core reason for a shift away from net payroll growth as a strong cyclical indicator is the ongoing decline in the break-even pace of employment—the number of jobs the economy needs to add every month to hold the unemployment rate steady. While the range can be quite wide, (15,000 to 87,000, according to the Federal Reserve Bank of St. Louis’ estimates), we think it’s around 20,000 jobs per month in 2026, driven by a historic move higher in retirements coupled with a slowdown of immigration. This leaves a native population structure that is top heavy—more older workers than new entrants. The result is the level of layoffs remains near an all-time low, which we see both in the household survey, and more importantly, administrative jobless claims data.
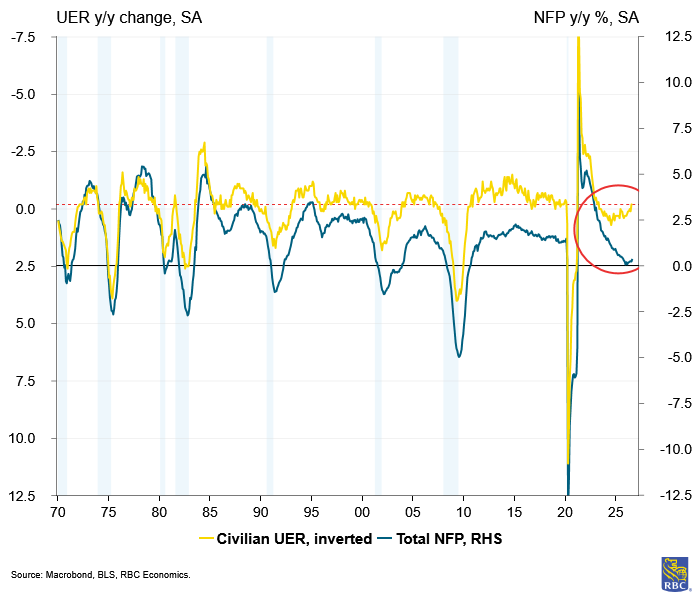
Unemployment rate ticked lower despite payroll slowdown
Permanent job losses remain near all-time lows
Record retirements push replacement demand up
Continuing claims as % of labor force near all-time low
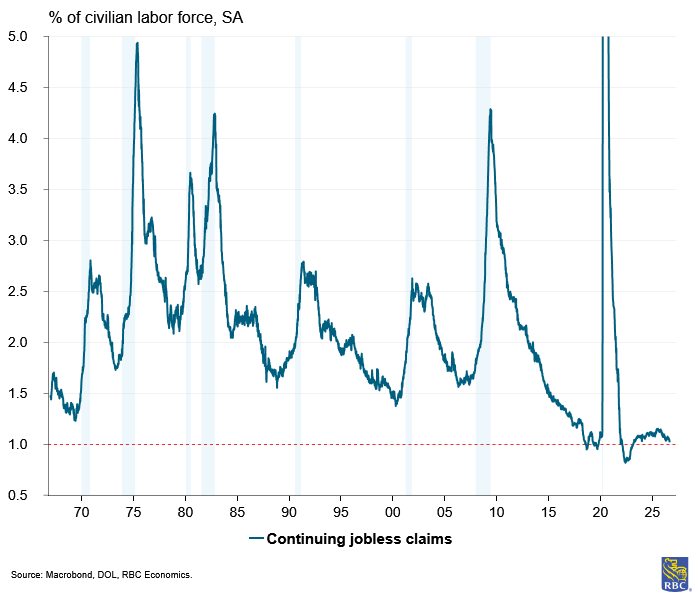
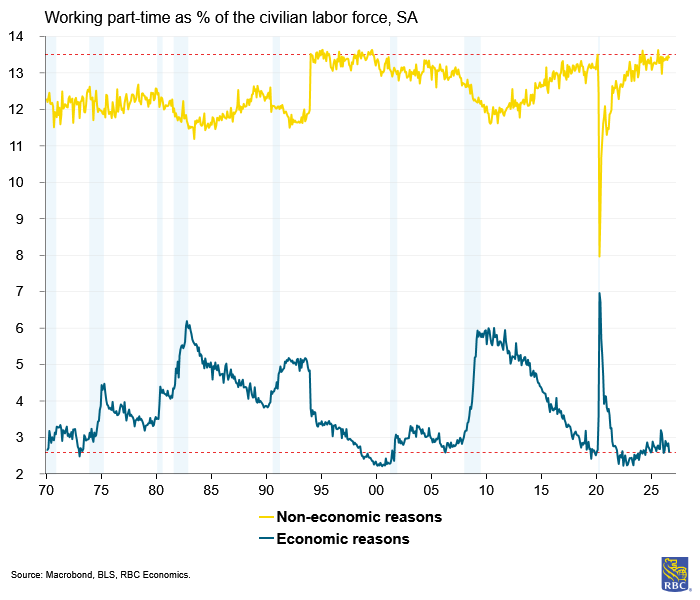
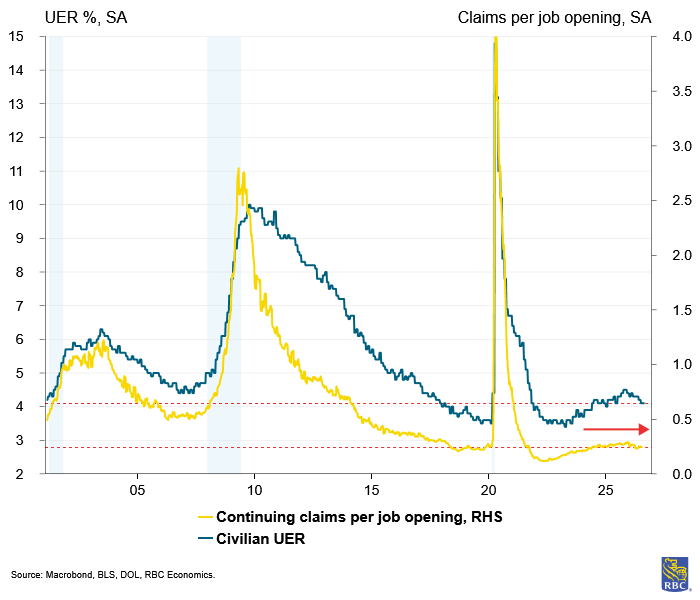
We also continue to see tightness in the part-time workforce. In particular, we tend to see a fairly steady share of workers who choose to work part-time for non-economic reasons – it accounts for about 12% and 14% of the labor force. On the other hand, part-time workers for economic reasons (i.e., those who want full-time work, but cannot find full-time jobs or see reduced hours) tend to fluctuate with the business cycle. Part-time work can act as a safety net for workers by reducing hours, rather than resorting to outright layoffs. In that context, we still see room for the labor market to ease without a significant rise in the unemployment rate. This view is further supported by the trend in continuing claims, which tends to lead the unemployment rate.
Reasons for part-time work suggest minimal slack
Claims-to-opening ratio suggests unemployment rate flattening
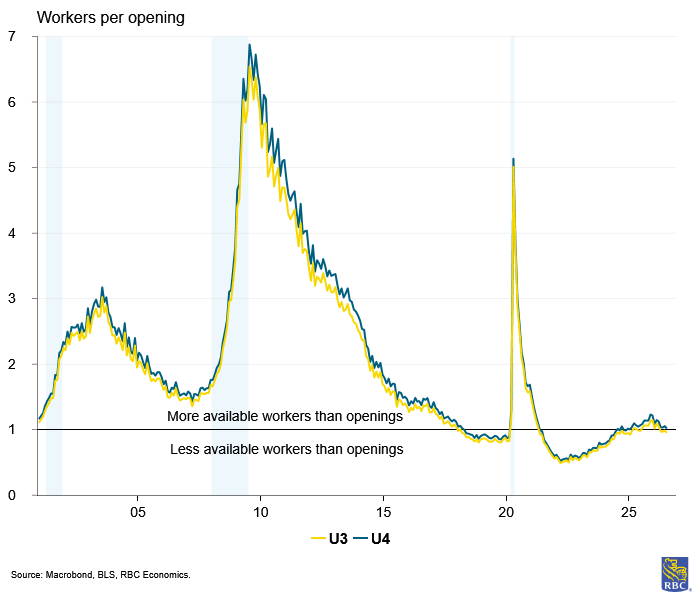
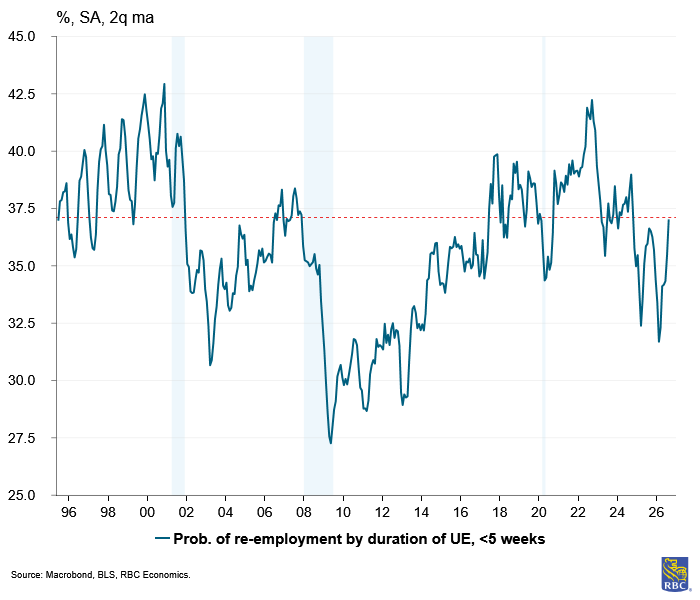
Job openings are growing faster than the civilian labor force. Indeed, job openings have historically been volatile, but recent data indicates a positive growth trajectory this year. Conversely, the civilian labor force is shrinking, suggesting much of that labor demand (i.e., job openings) is being driven by labor force exits (i.e., retirements). Looking at the level of unemployed workers (i.e., those workers classified in the headline U3 measurement) relative to the level of job openings, there are still not enough available workers to fill all job openings. Even when we expand the unemployment number to broader groups, (e.g., U4 includes total unemployed plus discouraged workers—those who want work, but aren’t looking, and therefore aren’t counted in the labor force), there are still enough job openings to employ nearly all “available” workers. Importantly, the limited supply of workers means workers who are laid off don’t struggle to find new jobs. In fact, the probability for reemployment for workers laid off within five weeks is nearly 40%.
Openings still show undersupply of available workers
Recent job losers seeing high re-employment rates
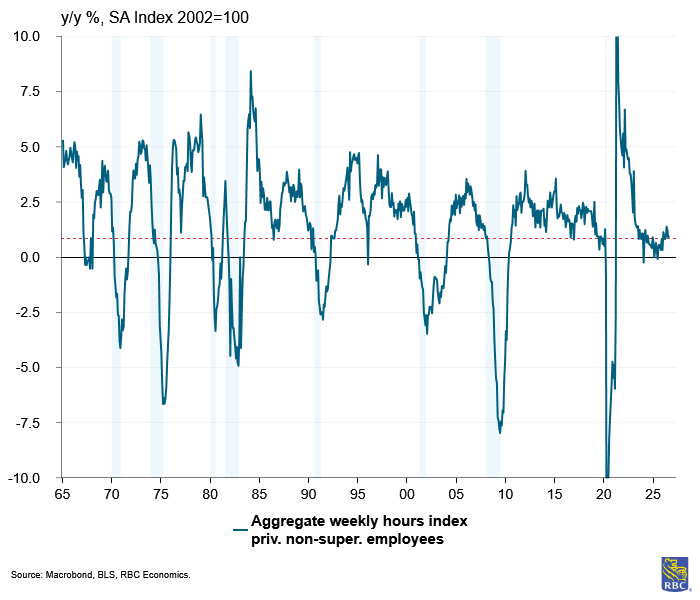
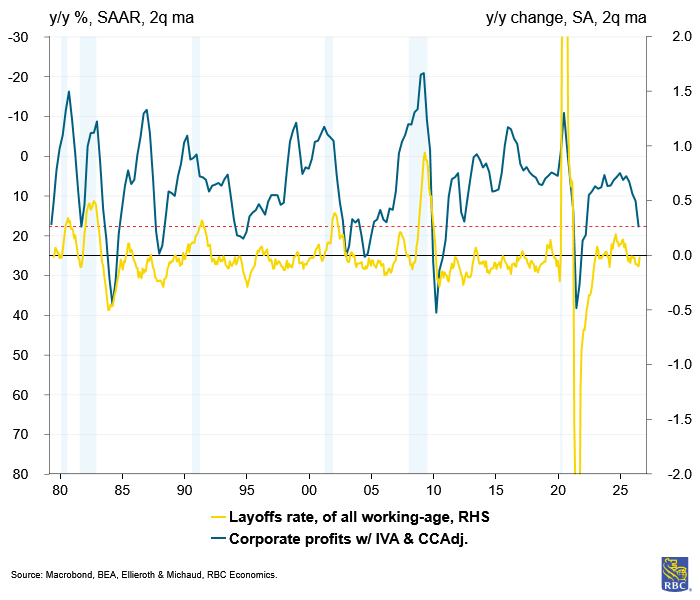
Risks of corporate profit squeeze-driven labor cuts are low. A squeeze on corporate profits would put labor under scrutiny, and layoffs are a quick cost savings measure. However, corporate profits continue to grow amid the strong consumer backdrop. Businesses can reduce labor demand without layoffs by reducing hours. But aggregate weekly hours is up 1.2% year-over-year, and the nonsupervisory private index is up 1.0%—another signal that labor demand is growing.
Avg weekly hours shows labor demand still positive
Strong corporate profits unlikely to result to layoffs
About the authors:
Mike Reid is Head of US Economics at RBC. He is responsible for generating RBC’s US economic outlook, providing commentary on macro indicators, and producing written analysis around the economic backdrop.
Carrie Freestone is a Senior US Economist at RBC. She is responsible for generating RBC’s US economic forecasts across GDP, employment, and inflation, and providing macro commentary through publications, presentations, and the media.
Imri Haggin is an US Economist at RBC, where he focuses on thematic research. His prior work has centered on consumer credit dynamics and treasury modeling, with an emphasis on leveraging data to understand behavior.
This article is intended as general information only and is not to be relied upon as constituting legal, financial or other professional advice. The reader is solely liable for any use of the information contained in this document and Royal Bank of Canada (“RBC”) nor any of its affiliates nor any of their respective directors, officers, employees or agents shall be held responsible for any direct or indirect damages arising from the use of this document by the reader. A professional advisor should be consulted regarding your specific situation. Information presented is believed to be factual and up-to-date but we do not guarantee its accuracy and it should not be regarded as a complete analysis of the subjects discussed. All expressions of opinion reflect the judgment of the authors as of the date of publication and are subject to change. No endorsement of any third parties or their advice, opinions, information, products or services is expressly given or implied by Royal Bank of Canada or any of its affiliates.
This document may contain forward-looking statements within the meaning of certain securities laws, which are subject to RBC’s caution regarding forward-looking statements. ESG (including climate) metrics, data and other information contained on this website are or may be based on assumptions, estimates and judgements. For cautionary statements relating to the information on this website, refer to the “Caution regarding forward-looking statements” and the “Important notice regarding this document” sections in our latest climate report or sustainability report, available at: https://www.rbc.com/community-social-impact/reporting-performance/index.html. Except as required by law, none of RBC nor any of its affiliates undertake to update any information in this document.

