

 EN
EN 


Significant new trade developments have emerged since U.S. Section 338 tariffs took effect on Aug. 22—including the introduction of Canadian government support measures, counter-tariffs, and fresh U.S. threats against Canada’s auto sector.
This report builds on our earlier analysis to address the most pressing questions we’re receiving amid an evolving trade environment that impacts both economies.
1. Has intensification of the trade war altered your growth outlook for Canada this year?
Our base case outlook hasn’t changed—we remain cautiously optimistic about Canada’s near term growth.
But, recent measures have taken some shine off signs of building economic momentum, and tilted the balance of risks around that forecast towards the downside.
Those risks are largely tied to the potential of further escalation in the U.S.-Canada trade war rather than current measures.
New tariffs imposed in August will be significant for specific sectors and industries. Individual businesses unlucky to be caught in tariff crosshairs will be heavily impacted in Canada and the U.S.
But ultimately, they impact a small share of the total economy. U.S. tariffs impact about 5% of Canadian exports to the United States, and about 0.4% of Canadian gross domestic product and jobs. Canada’s retaliatory tariffs announced account for about 3% of Canadian imports and the list has already been modified (removing seafood products, adding some from other product groups like stone and copper products,) reportedly based on feedback from businesses.
And, fiscal policy will help to offset some tariff costs. The federal government announced a new support package of $7.5 billion for workers and businesses directly affected (about 0.2% of nominal GDP). That should help limit immediate job losses and contain the bleed to the broader economy.
More recent Canadian developments at home have been positive. Growth was showing signs of strengthening, and the unemployment rate has edged down half a percent from a year ago as of July despite ongoing trade uncertainty.
We have also seen trade tensions ebb and flow significantly in the past, but the broader direction of U.S. tariff rates globally has been edging lower rather than higher in 2026.
2. Has the path of inflation in Canada been altered? How will the Bank of Canada view these developments?
Yes, but not significantly. The latest counter-tariffs will complicate the road for inflation returning sustainably to the 2% target, but it will likely take further escalation to significantly impact broader inflation trends. New tariffs in August will cause hardship for businesses impacted, but it effects a small share of cross-border trade overall.
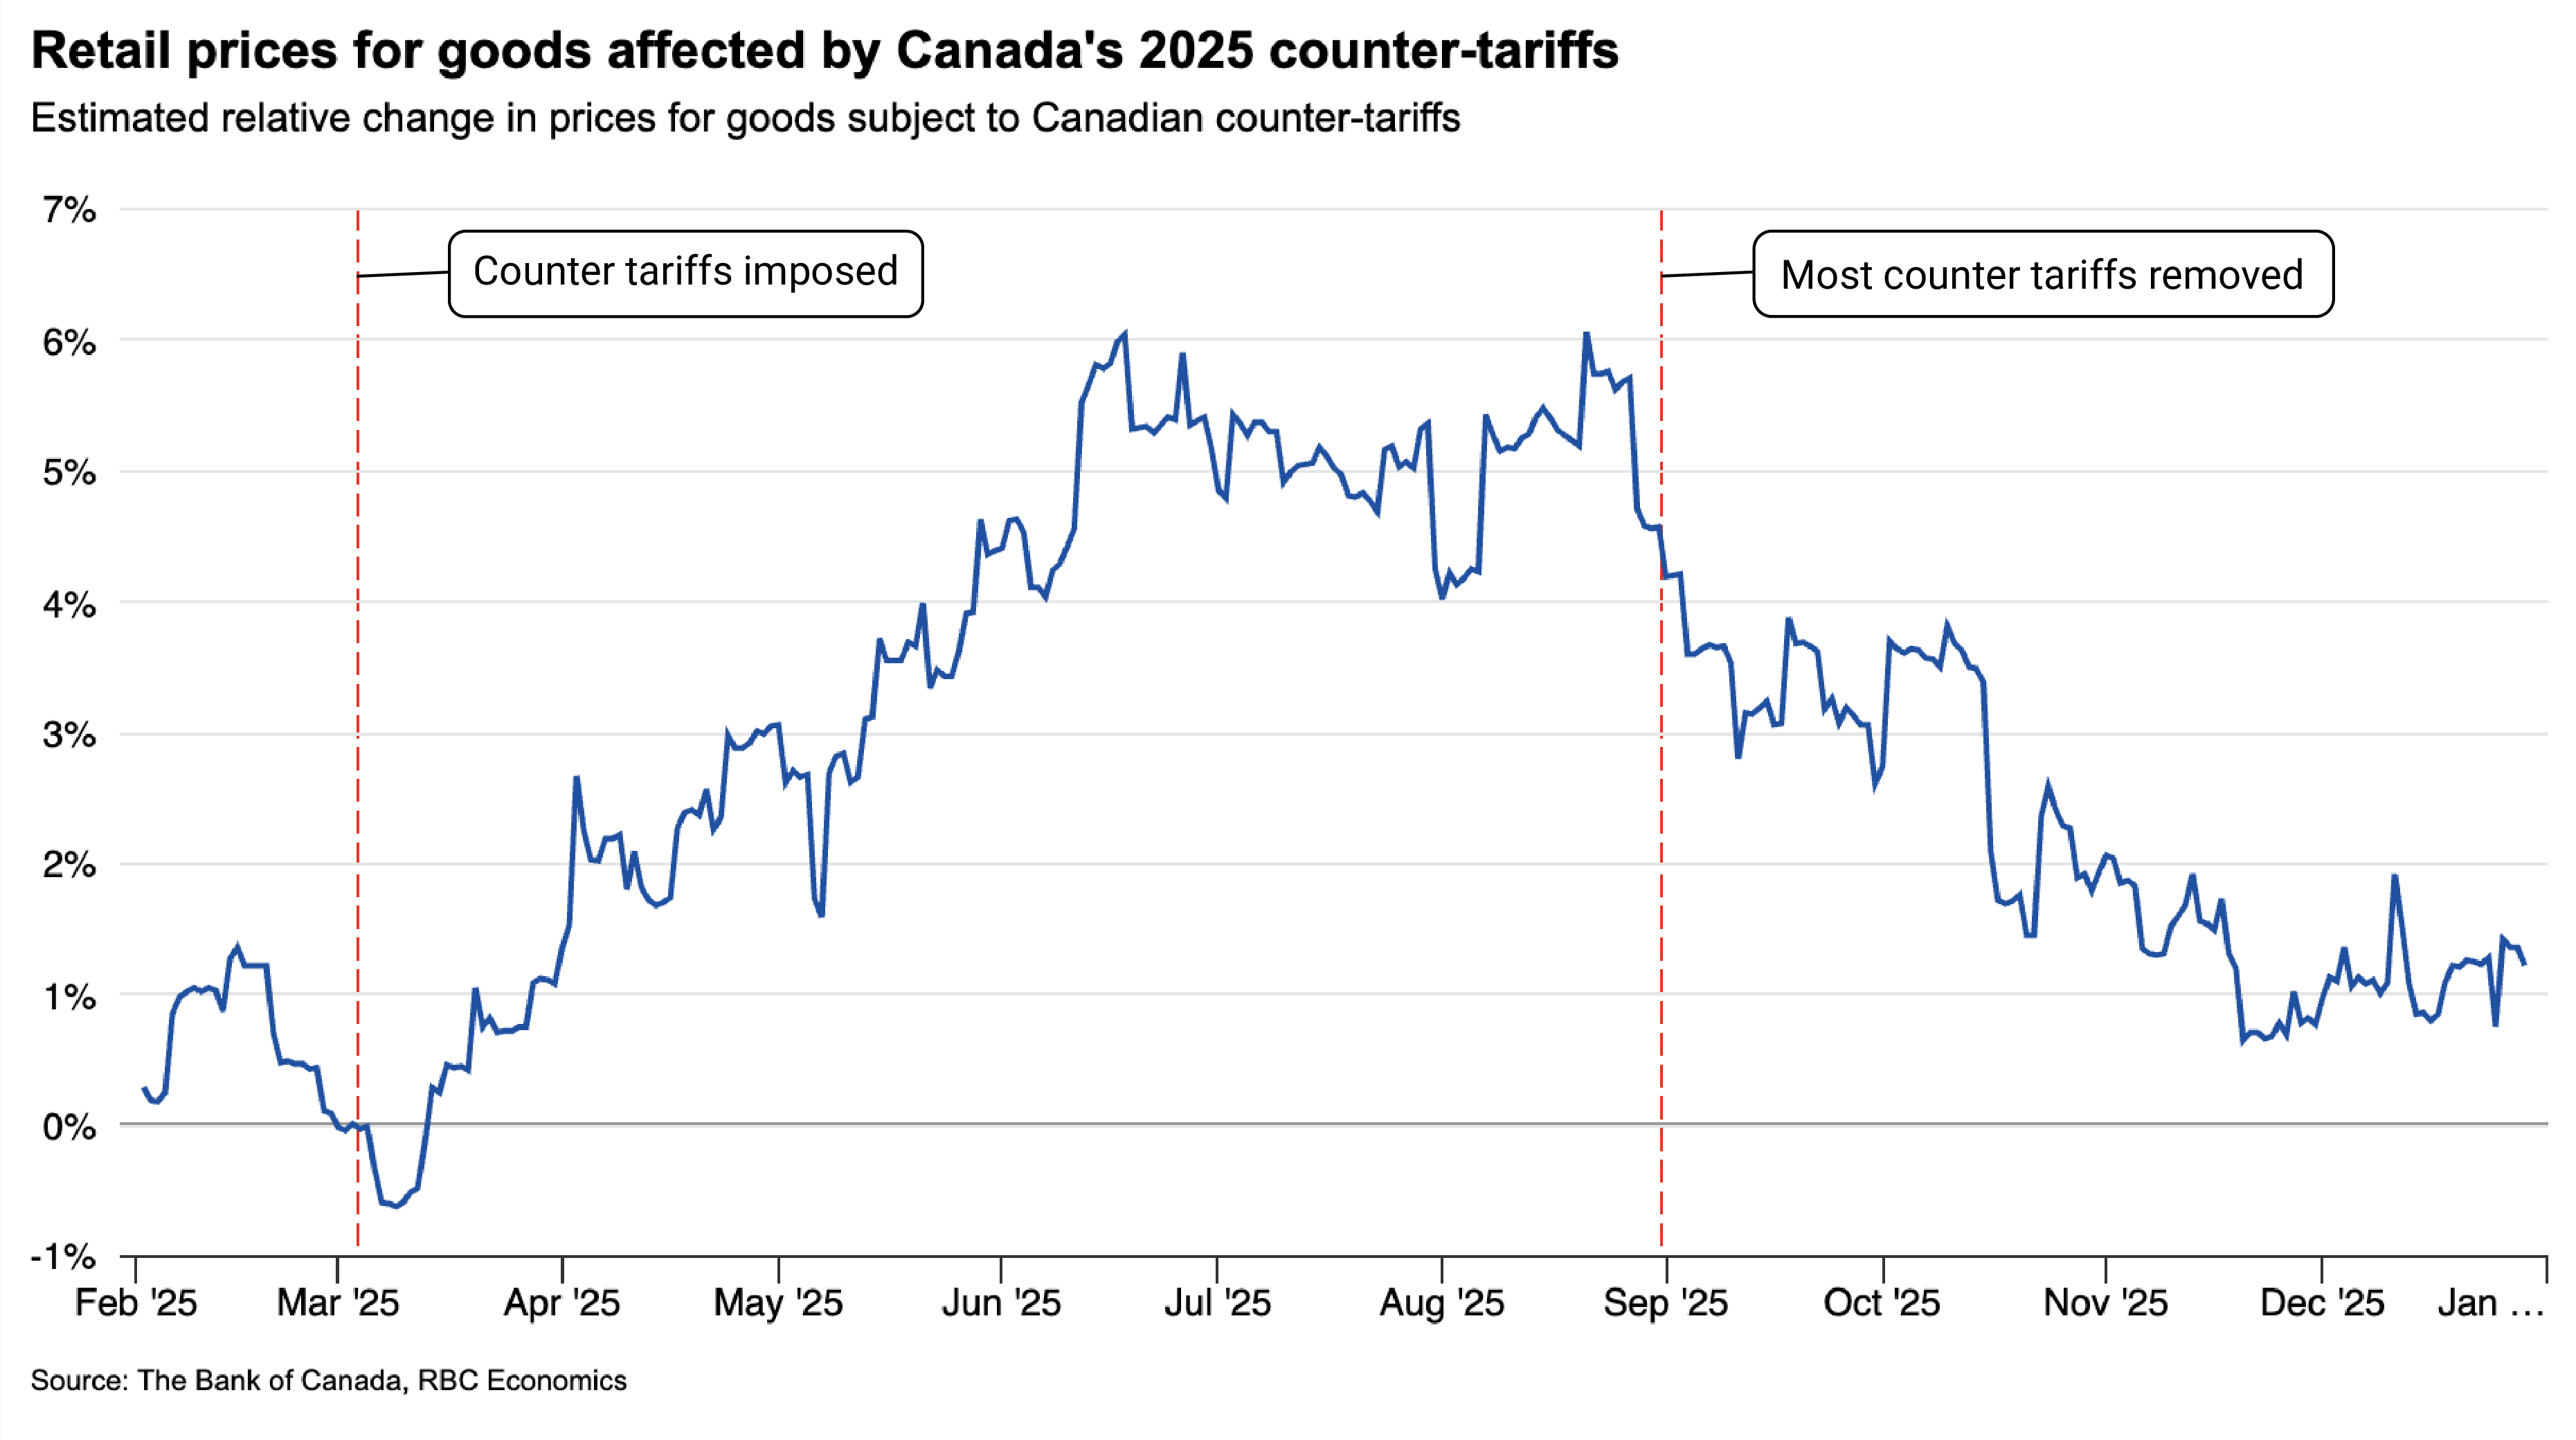
Crucially, as the Bank of Canada found here, the passthrough to inflation depends on the size of the tariffs, retailer’s expectations for how long the measures will be in place, and the level of visibility of price changes to consumers. Importantly, price increases due to counter tariff measures imposed in 2025 were promptly reversed once they were dropped.
This suggests that domestic counter tariff measures could have a significant, but partial and ultimately, a temporary pass through to consumer prices in Canada. Also important here is the healthy starting point for inflation trends before the latest trade rift. The BoC’s preferred core Consumer Price Index measures have remained around 2% since April.
The risk, of course, is the trade war escalates—but a significant escalation would also be negative for the economy, and that would likely offset inflation concerns and could prompt the central bank to respond with interest rate cuts. For now, though, we expect the combination of lower inflation readings recently, and rising international trade risks but firmer backward looking growth data will balance out to leave the BoC on hold for the rest of 2026.
3. What would be the impact of new auto tariffs if imposed on Jan. 1?
Threat of auto tariffs is clearly concerning for the sector. The number of vehicles produced in Canada has been shrinking for decades, but 120,000 jobs still depend directly on vehicle and parts production—representing 0.7% of Canada’s employment and GDP.
But broader auto sector tariffs would be unique in that if imposed they would also function as a larger levy on U.S. exporters than Canadians.
Consider that more than half the value of Canadian vehicle exports to the U.S. comes from imported U.S. parts purchased during assembly. Less than a third reflects Canadian value-added production with the remainder sourced from foreign markets like Mexico.
Deep integration means tariffs on any partner in the North American free trade block would raise costs across the entire North American auto sector, eroding competitiveness against offshore manufacturers like China.
This likely explains why comprehensive auto tariffs haven’t been fully implemented so far. Tariffs on U.S. auto imports from Canada and Mexico have been limited to non-U.S. value added, and most vehicle parts are exempt if compliant with CUSMA.
Additional tariffs on the auto sector are still a risk, but more than any other industry, it would negatively impact the U.S. along with Canadian exporters.
4. How will Canada’s retaliatory tariffs impact Canada and the U.S.?
The purpose of retaliatory trade measures, typically, is to cause as visible of a disruption to foreign exporters as possible, while limiting the impact on domestic importers.
In essence, ideally nobody pays retaliatory tariffs. The idea is they create an incentive for Canadian businesses to import from non-U.S. destinations or purchase from domestic suppliers, and/or substitute to alternative products.
Canada’s new retaliatory tariff list of 25% to 50% tariffs imposed on about 3% of imports overall focus heavily on products like machinery, paper products, and plastics. But, on average, those products have a smaller share of current imports from the U.S.—leaving more options than the average product for substitution to alternative import markets. It’s also where shipments to Canada make up a disproportionately large share of U.S. exports.
The U.S. accounts for on average about 26% of products on the Canadian retaliatory list. Canada accounts for about 20% of total U.S. exports of those products, above the all-product average of about 15% (2025). For some specific industries/products, the Canadian share is substantially higher. Canada accounts for 80% or higher of total U.S. export share for about 10% of the dollar value of products in Canadian retaliatory measures, according to our calculations.
5. Can Canada compensate for lost U.S. demand with domestic or international demand?
Yes, there is scope for domestic substitution, although it will likely be partial and happen gradually over time.
About 80% of Canada’s exports of products on the Section 338 tariff lists went to the U.S. in 2025, by our count, suggesting high levels of export concentration. The good news for these products is foreign demand generally accounts for a smaller share of total domestic production, compared to products targeted in earlier rounds of Section 232 tariffs including autos and parts, metals and derivatives and lumber.
And, Canada is actually a net importer of products on the Section 338 list, so there is scope for domestic buyers to shift to sources at home, and displace at least a portion of lost export sales. That means additional scope for domestic consumption to rise, and offset reduced U.S. demand.
6. Have Canadians shifted their behaviour during this trade conflict?
Yes, and we’re seeing a clear “Buy Canadian” shift, particularly in tourism. The U.S. remains Canada’s largest source of imports for physical goods, but Canadians have clearly signalled a preference to avoid travel and spending in the U.S.
That doesn’t mean Canadians aren’t traveling. Tourism spending through Q1 2026 stayed resilient overall, but the composition changed. Canadians are keeping more tourism dollars at home with domestic travel picking up, alongside spending on destinations outside of the U.S. abroad. The number of Canadians travelling to the U.S. for overnight trips has been running 25% below 2024 levels since trade tensions ratcheted up in early 2025.
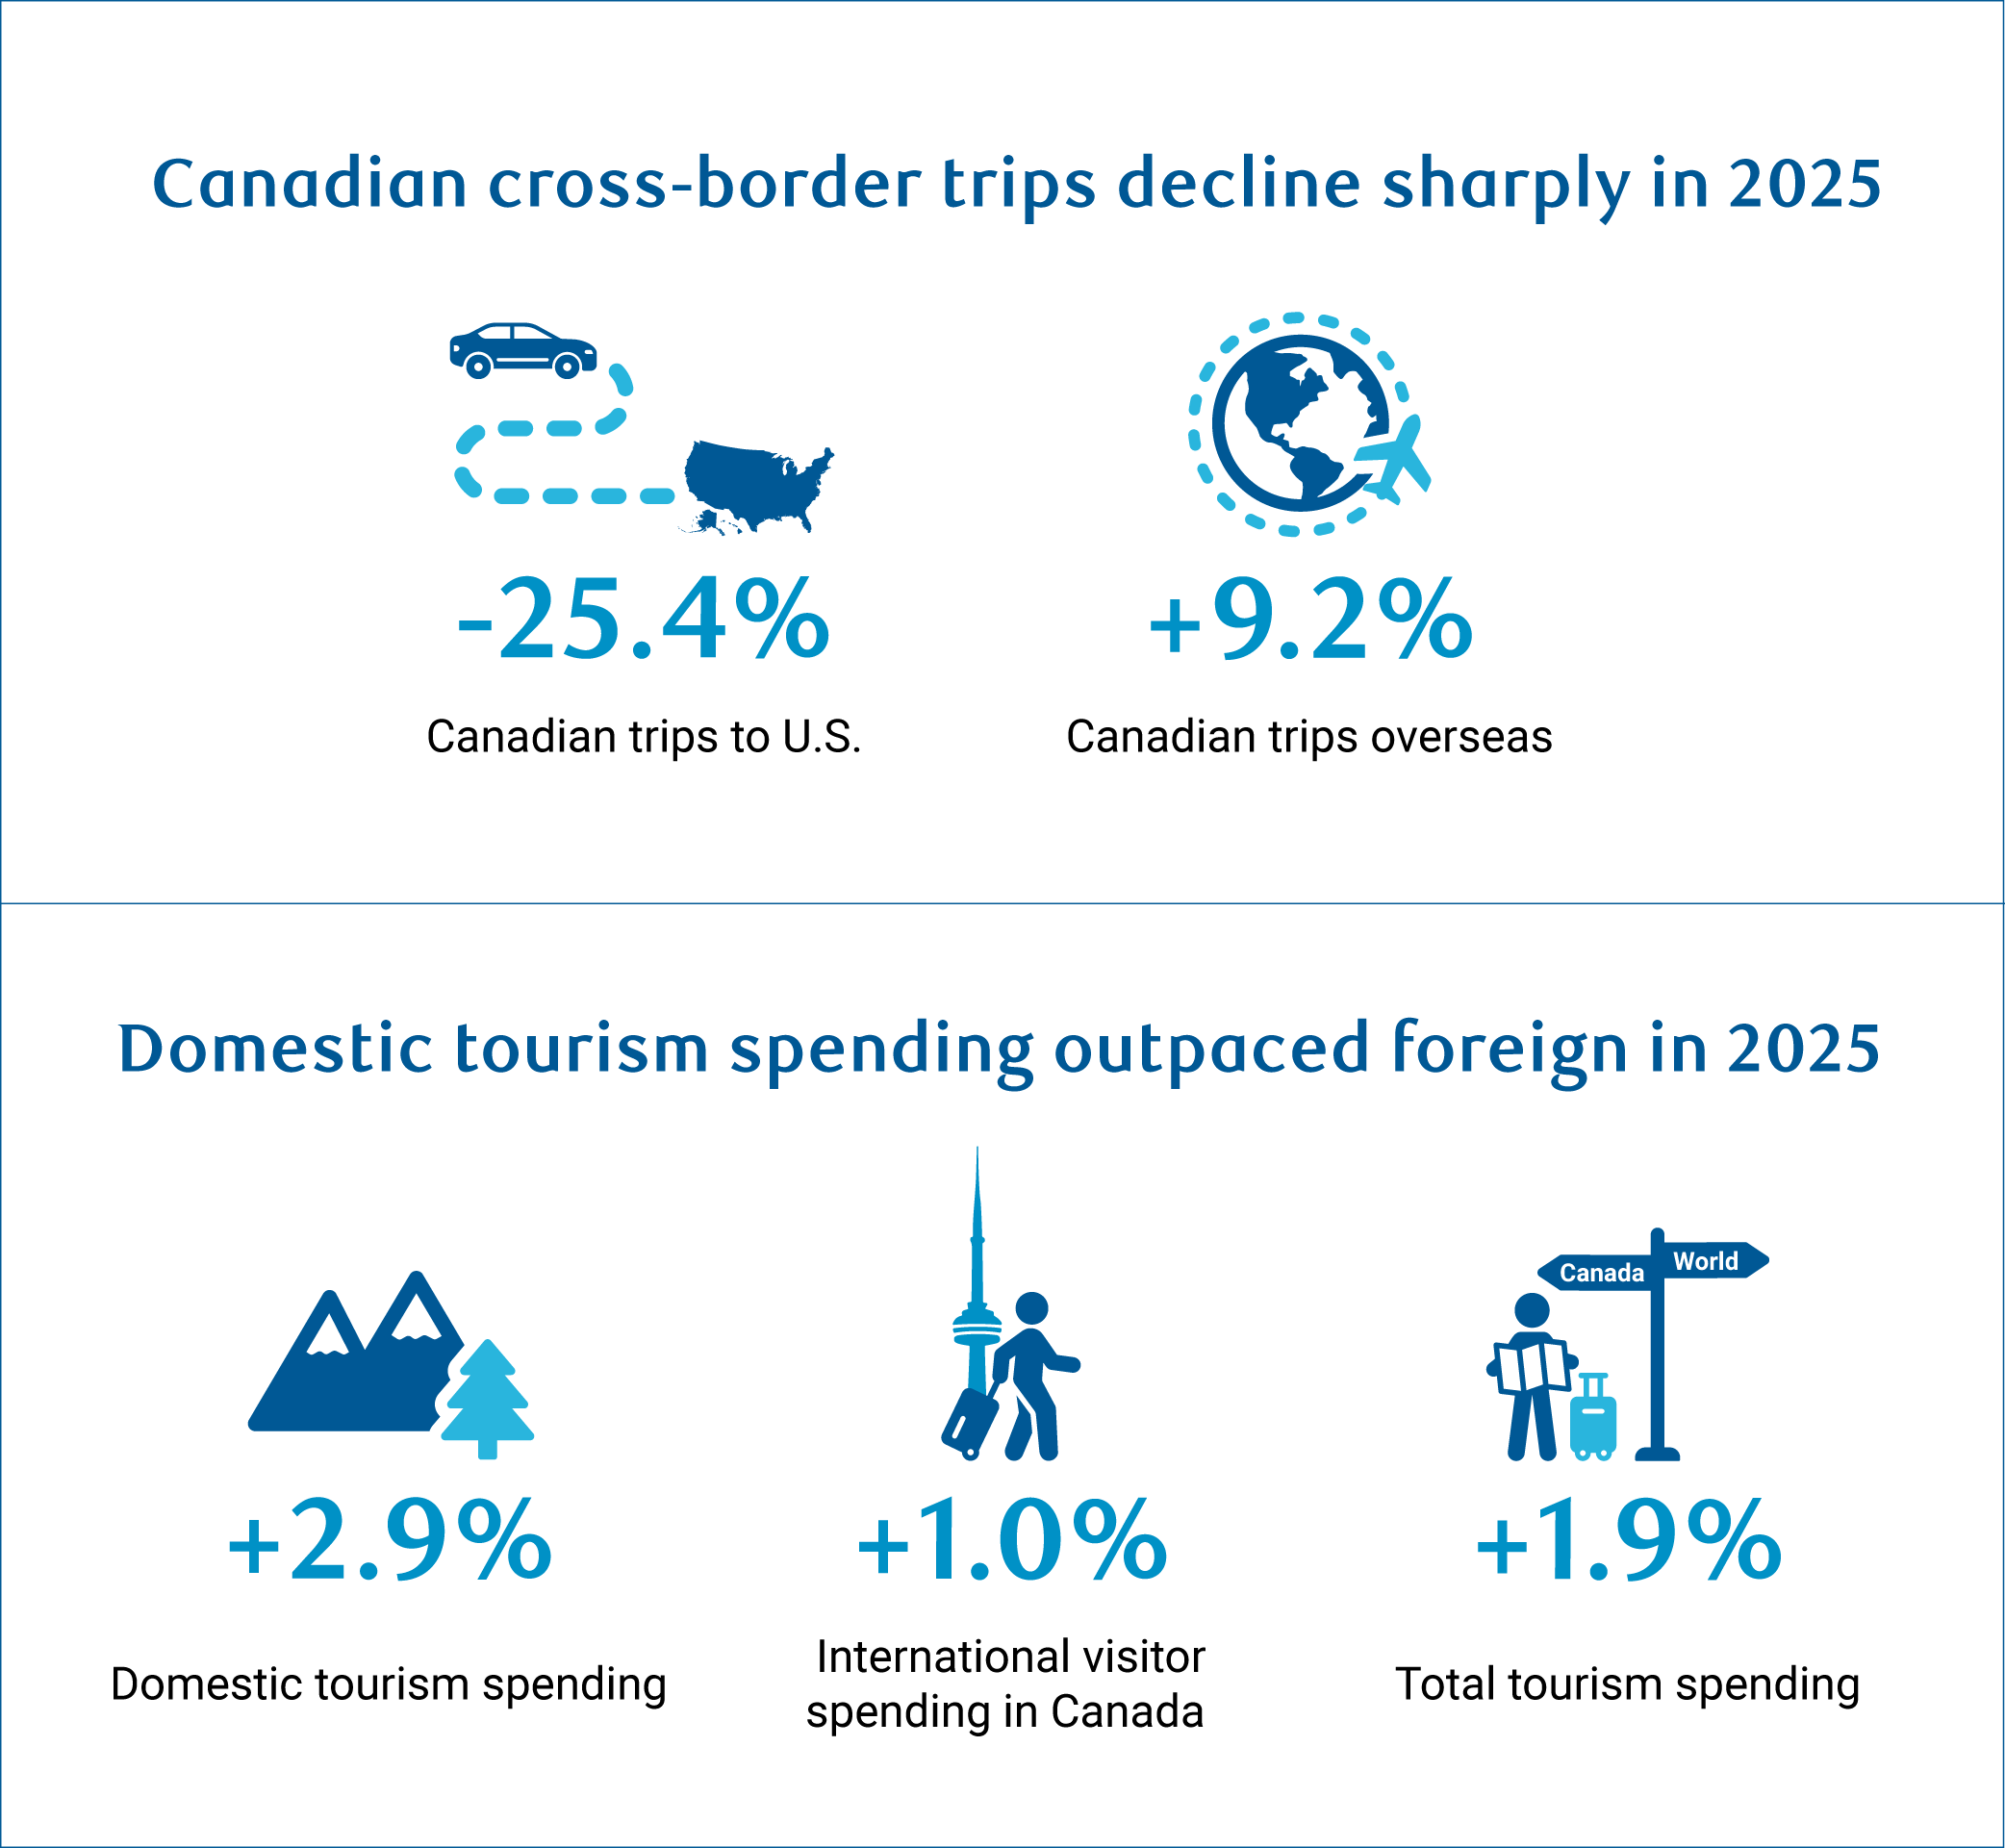
Looking ahead, it could get interesting. Trade uncertainty spiked back up in Q2 and Q3 with geopolitical conflicts and Section 232 tariffs, so we’ll be closely watching to see if spending patterns shift again. Consumers may pull back further on cross-border travel as volatility picks up.
7. Are there regional concerns for existing and new tariffs in Canada?
Yes. Plastic products, electrical machinery, furniture and wood product sectors are among the most significantly affected by new Section 338 measures—creating a higher concentration of impact in Quebec, British Columbia, and Ontario.
For these provinces, new measures compound existing pressures on products like autos, steel, and lumber. They target around 10% of Quebec and B.C. exports, and roughly 8% of Ontario’s exports to the U.S.1 They could materially raise the average effective tariff rate these provincial exports face—well above the national average of about 6%.
If sustained, Section 338 tariffs could further exacerbate regional growth divergence between heavily exposed provinces, and those less affected by U.S. measures such as Alberta, Saskatchewan and parts of Atlantic Canada.
Challenges could also arise from Canada’s own counter measures updated on Aug. 26.
By our count, reciprocal Canadian tariffs (as announced at time of writing) would affect a larger share of targeted goods’ imports in Prince Edward Island (78%), Saskatchewan (74%), New Brunswick (70%), and Manitoba (65%), likely making it harder for importers to find lower cost alternatives.
8. How have these new tariffs impacted your outlook for the U.S.?
Like our view on Canada, our baseline outlook for the U.S. of 2% growth in 2026 and 2027 and slightly improving (but still high) inflation is unchanged in the face of new trade developments.
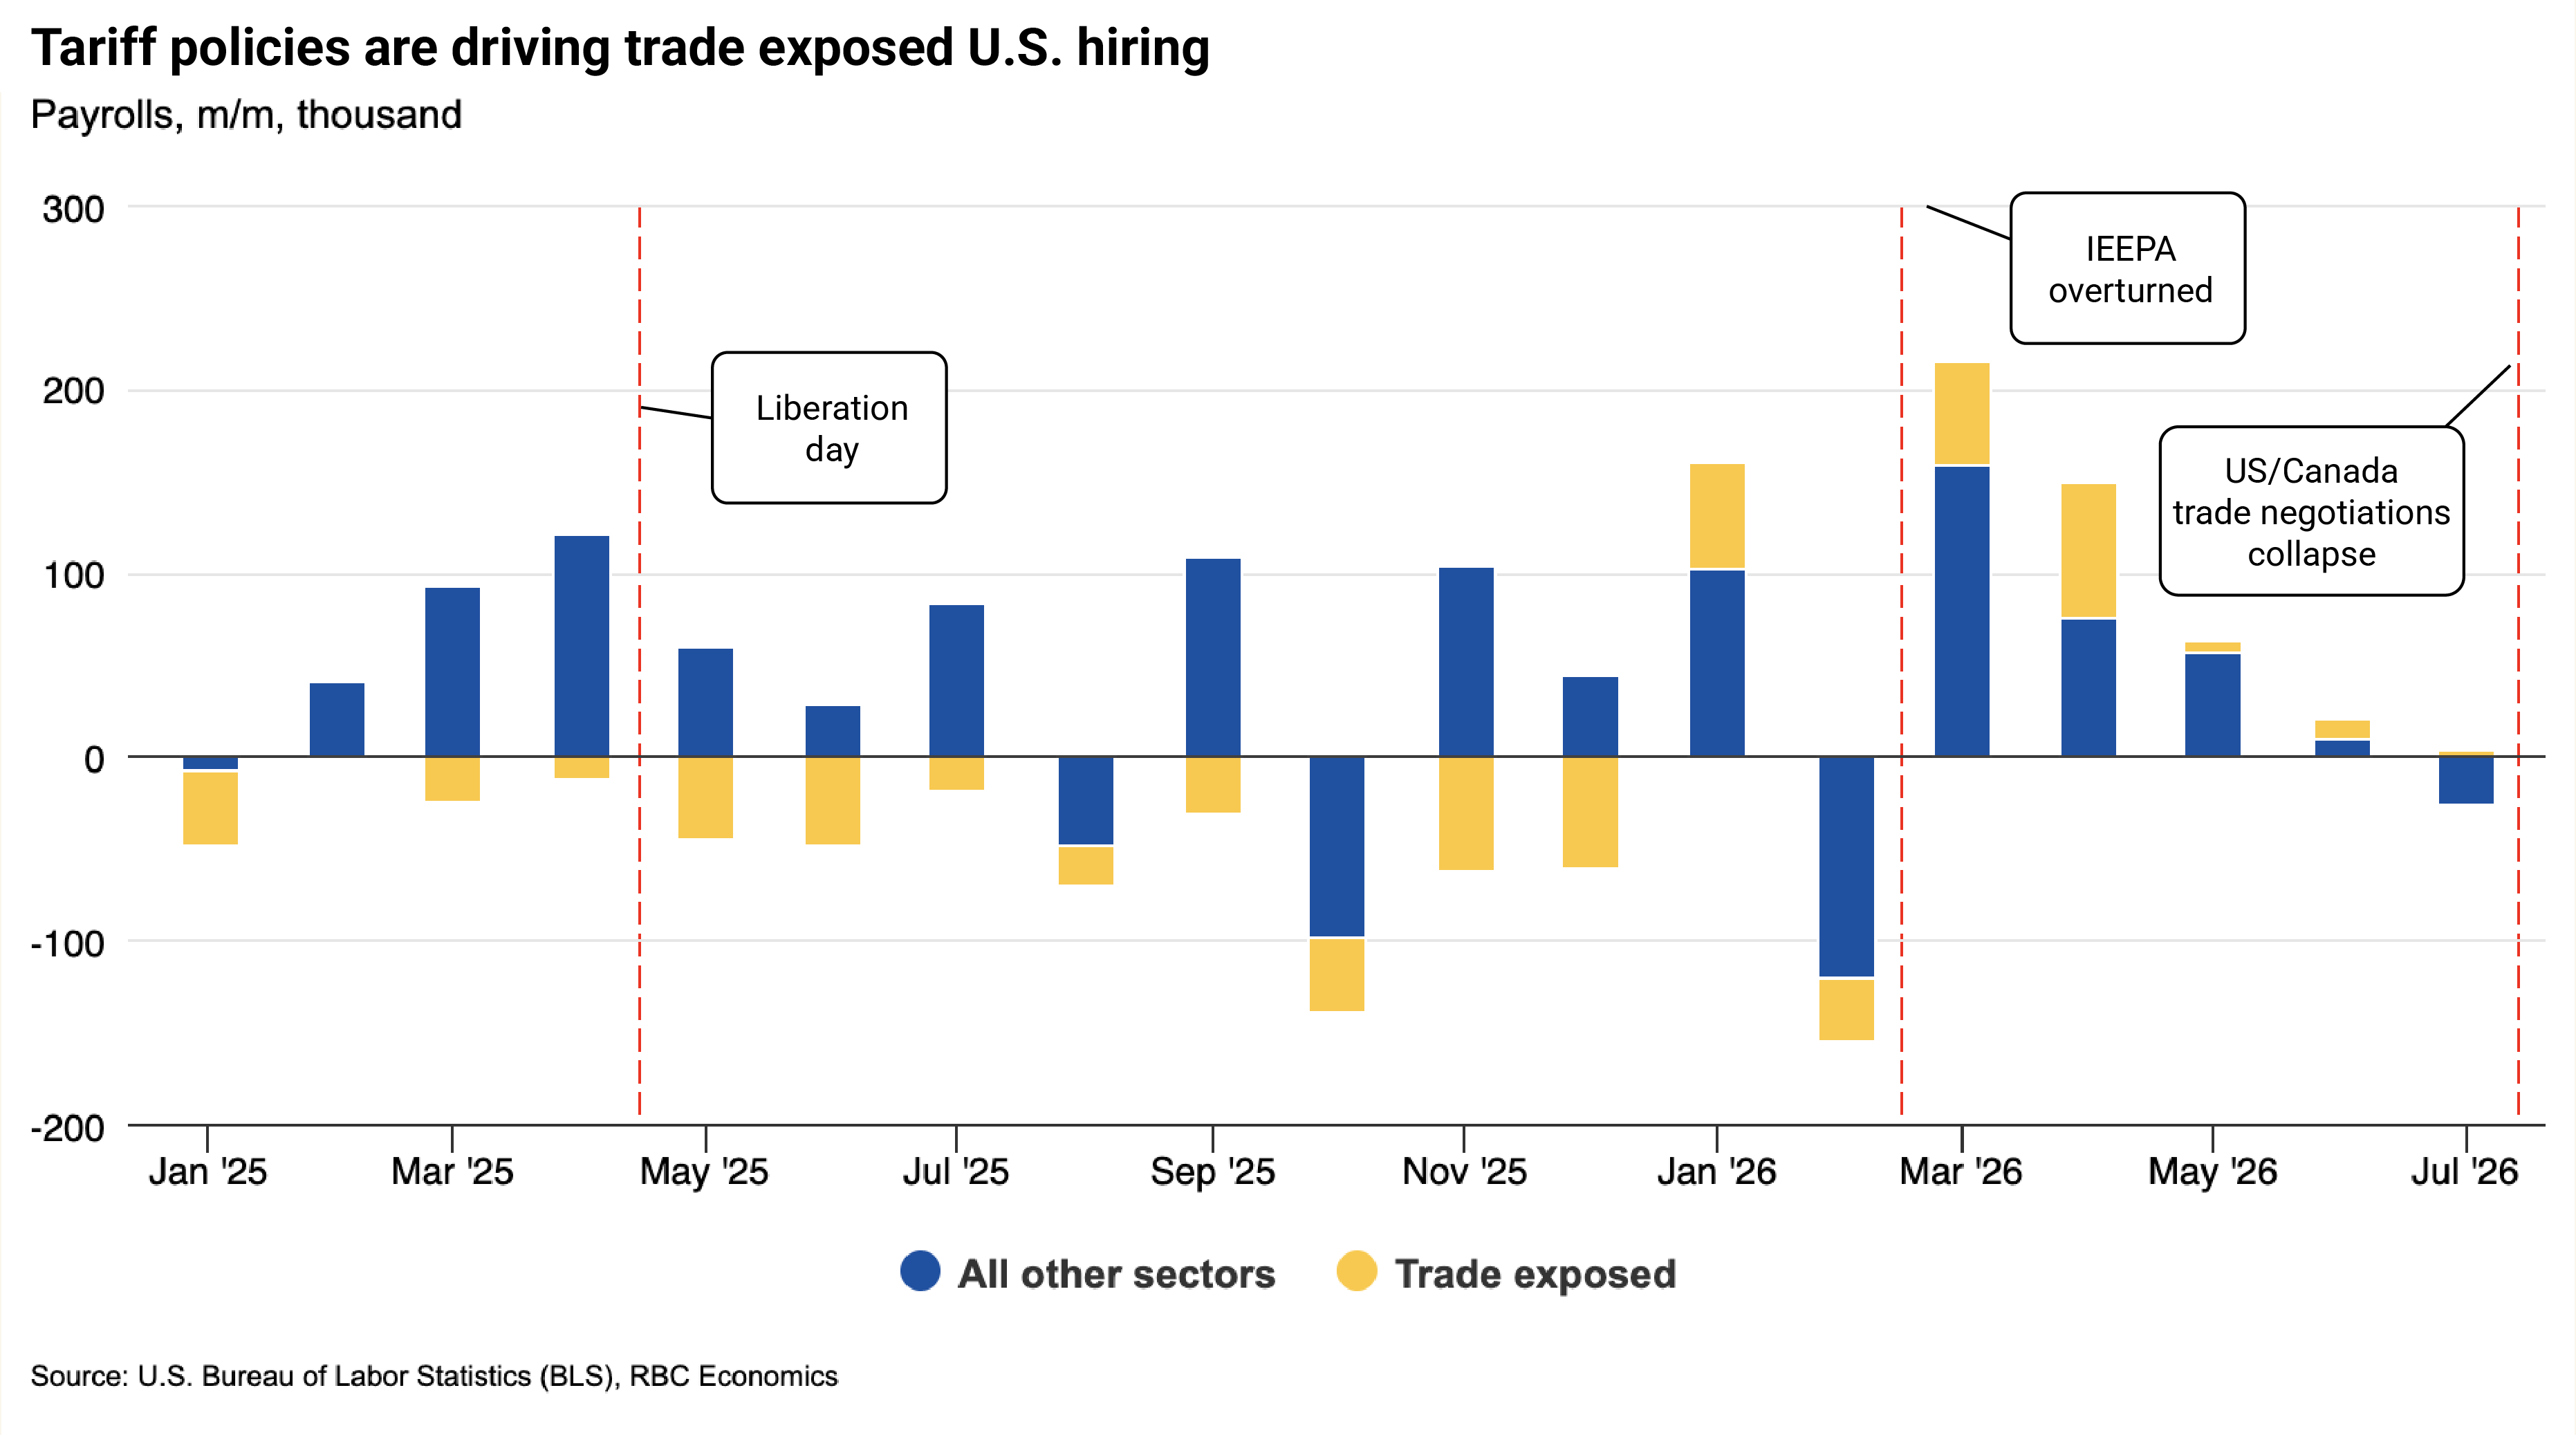
However, also like in Canada, risks around our outlook are shifting. The U.S. had been seeing some helpful reprieve from the overturn of IEEPA tariffs by the U.S. Supreme Court in February. In the following months, some pressure has come off goods inflation, and jobs in trade related sectors were beginning to recover.
New tariffs threaten those improvements. Inflation is particularly problematic given price pressures are a persistent issue, and in contrast to Canada where inflation has been better contained.
9. Which U.S. states are most exposed to new tariffs?
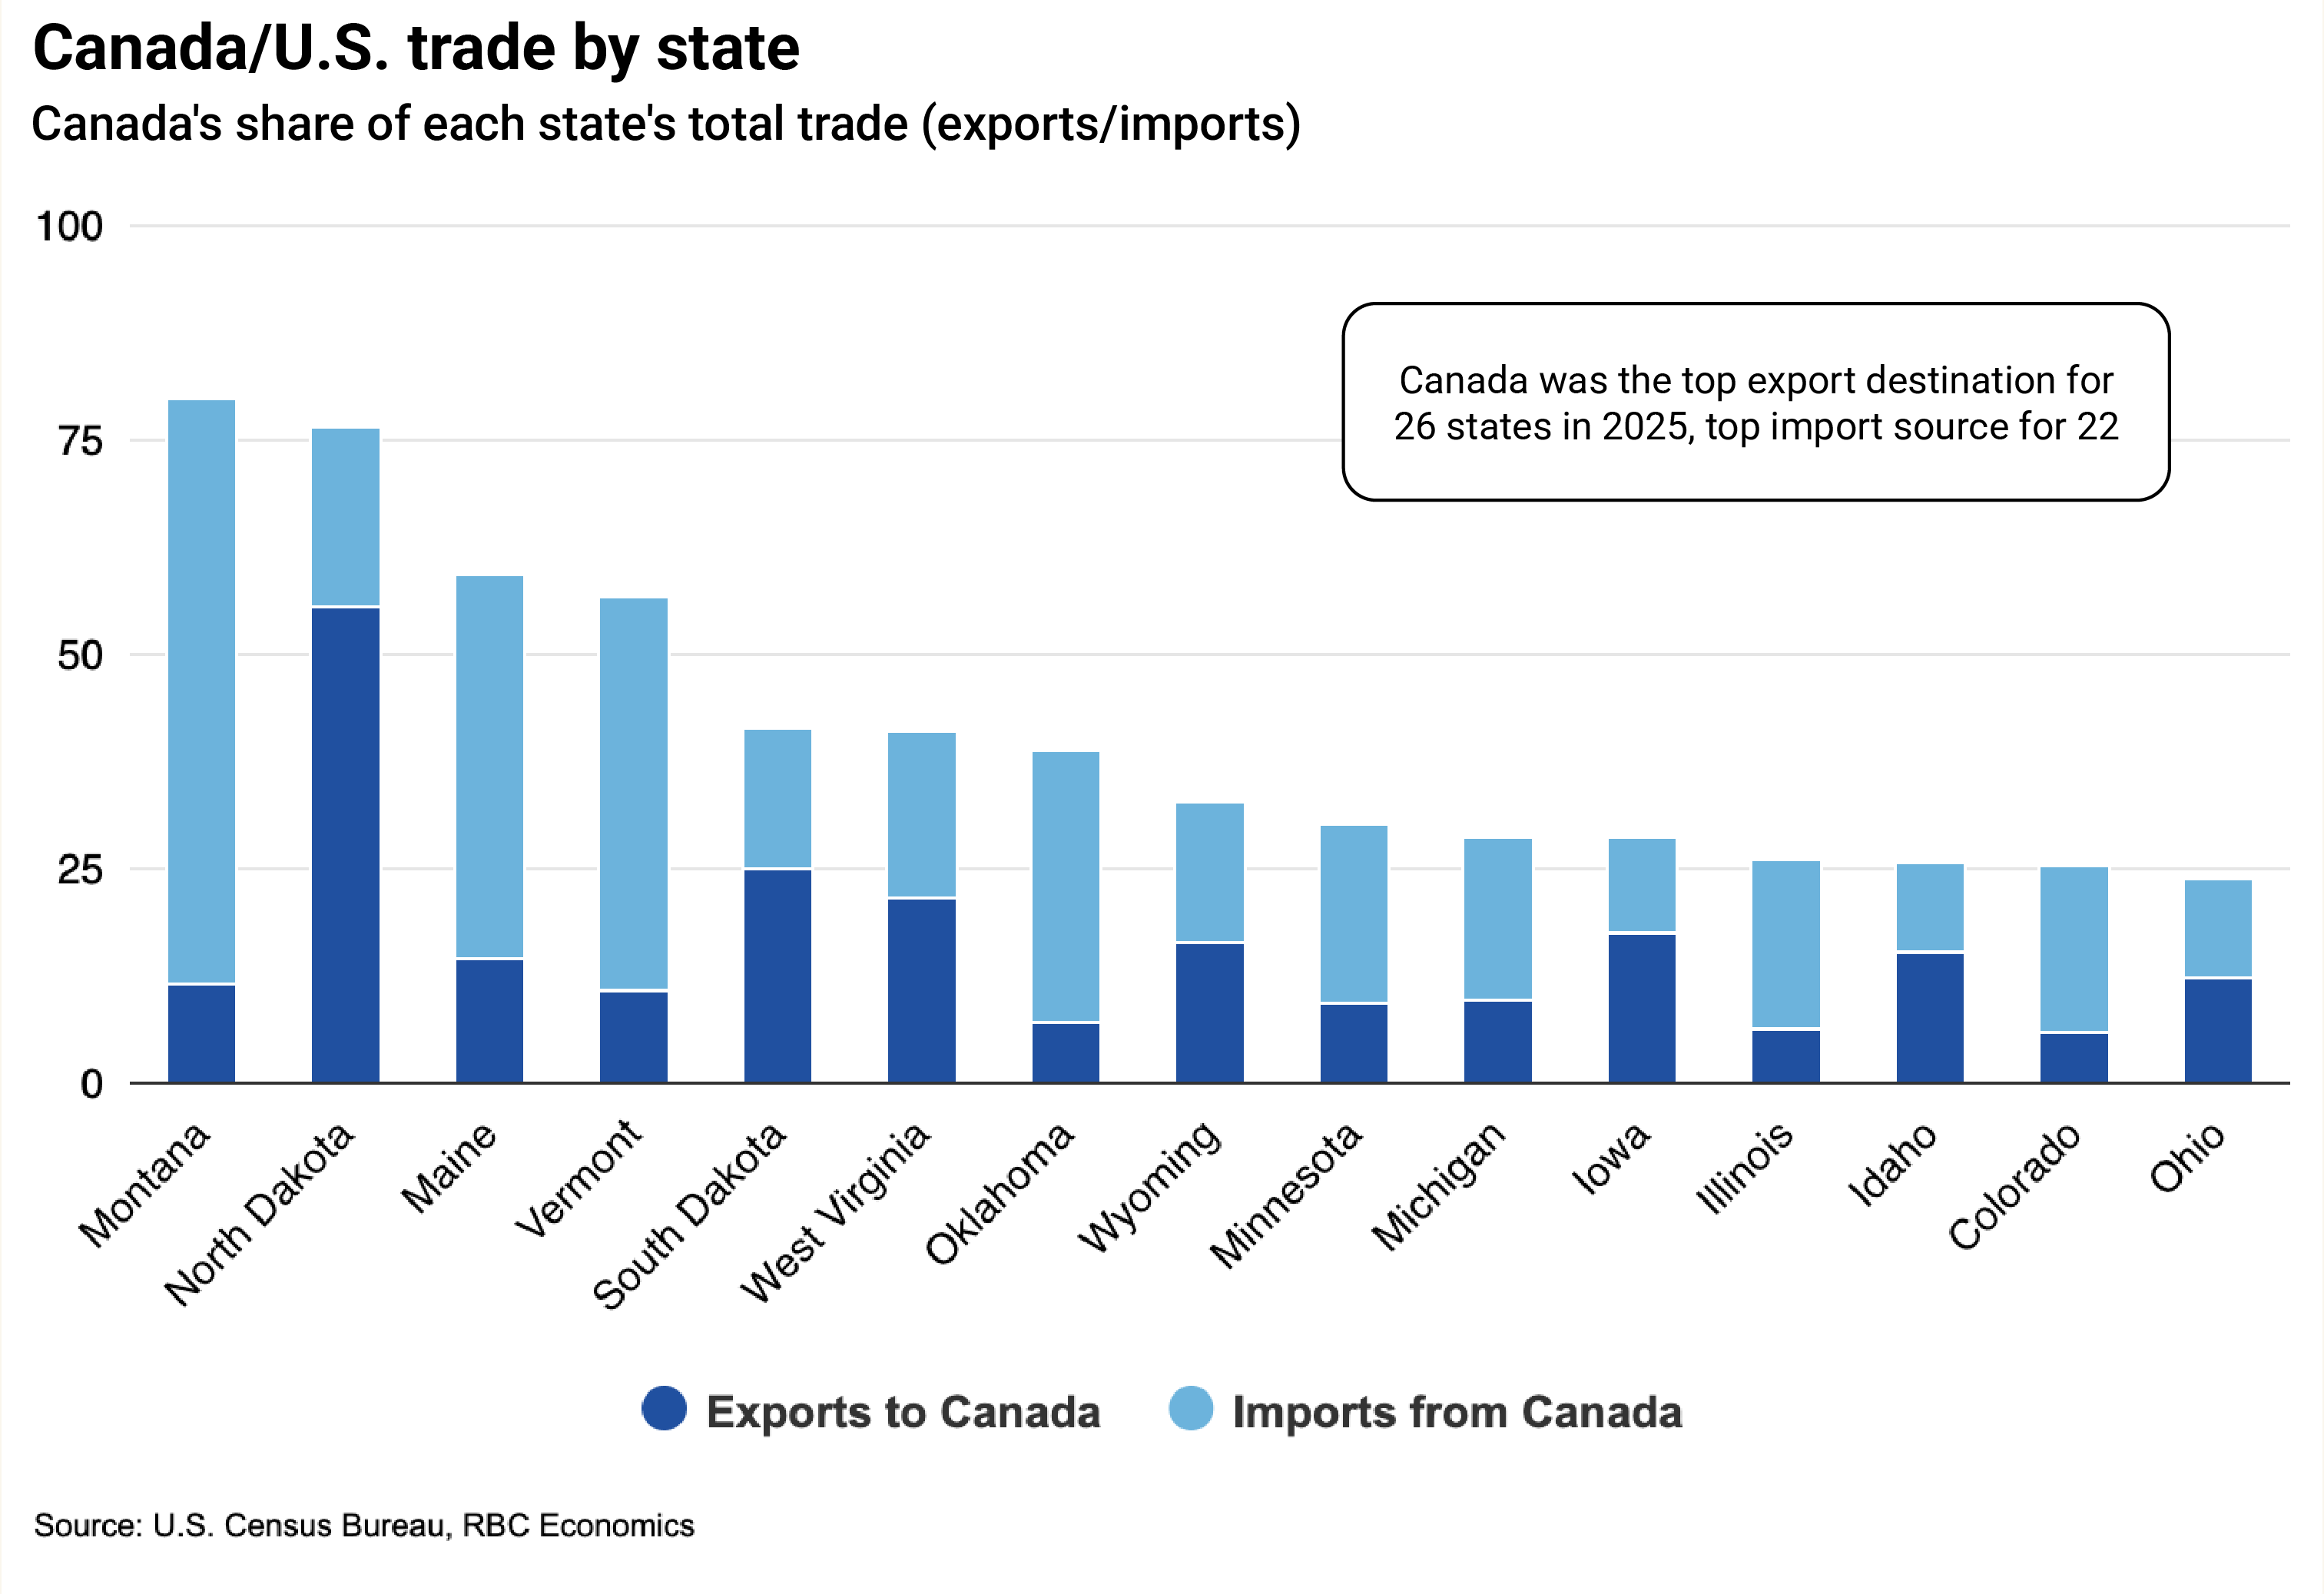
Tariffs in place from both the U.S. and Canada are most impactful to states along the northern U.S. border. Montana, North Dakota, Maine and Vermont look particularly exposed, given geographic proximity and mix of sectors targeted by both sides. Each of those states do a majority of their international trade with Canada (i.e., more than 50% of combined imports and exports).
- Excluding goods cross listed under section 232, at the HS6 level, based on 2025 trade. ↩︎
This article is intended as general information only and is not to be relied upon as constituting legal, financial or other professional advice. The reader is solely liable for any use of the information contained in this document and Royal Bank of Canada (“RBC”) nor any of its affiliates nor any of their respective directors, officers, employees or agents shall be held responsible for any direct or indirect damages arising from the use of this document by the reader. A professional advisor should be consulted regarding your specific situation. Information presented is believed to be factual and up-to-date but we do not guarantee its accuracy and it should not be regarded as a complete analysis of the subjects discussed. All expressions of opinion reflect the judgment of the authors as of the date of publication and are subject to change. No endorsement of any third parties or their advice, opinions, information, products or services is expressly given or implied by Royal Bank of Canada or any of its affiliates.
This document may contain forward-looking statements within the meaning of certain securities laws, which are subject to RBC’s caution regarding forward-looking statements. ESG (including climate) metrics, data and other information contained on this website are or may be based on assumptions, estimates and judgements. For cautionary statements relating to the information on this website, refer to the “Caution regarding forward-looking statements” and the “Important notice regarding this document” sections in our latest climate report or sustainability report, available at: https://www.rbc.com/community-social-impact/reporting-performance/index.html. Except as required by law, none of RBC nor any of its affiliates undertake to update any information in this document.
Get the latest forecasts and analysis from RBC Economics.
Subscribe Now
- 1. Has intensification of the trade war altered your growth outlook for Canada this year?
- 2. Has the path of inflation in Canada been altered? How will the Bank of Canada view these developments?
- 3. What would be the impact of new auto tariffs if imposed on Jan. 1?
- 4. How will Canada’s retaliatory tariffs impact Canada and the U.S.?
- 5. Can Canada compensate for lost U.S. demand with domestic or international demand?
- 6. Have Canadians shifted their behaviour during this trade conflict?
- 7. Are there regional concerns for existing and new tariffs in Canada?
- 8. How have these new tariffs impacted your outlook for the U.S.?
- 9. Which U.S. states are most exposed to new tariffs?
