

 EN
EN 


We remain cautiously optimistic the Canadian economy will improve on a per-person basis despite re-escalated trade risks and persistently high energy prices.
Trade tensions with the United States have ramped up again, and energy prices have climbed higher as conflict in the Middle East drags on, but Canada’s economy has also continued to show resilience through the first half of 2026.
Canadian gross domestic product growth rebounded in Q2 after a winter slowdown, and labour market conditions have improved.
We expect 1% growth in 2026—low historically—but substantially better when adjusted for significant demographic headwinds including a population decline for the first time on record in Canada.
Per-capita growth paints a more encouraging picture of how Canadians are experiencing the economy. The unemployment rate, while still elevated, dropped to a two-year-low over July and August, and is down nearly three-quarters of a percentage point from a year ago.
Resilience amid renewed trade tensions
Trade tensions between Canada and the U.S. rose dramatically over the summer with the U.S. imposition of 50% tariffs on another subset of about 5% of Canadian imports, and Canada’s retaliatory measures on a similar dollar amount of imports from the U.S.
While these measures will significantly impact targeted sectors, we expect limited broader economic implications with fiscal support providing some cushioning.
The greater risk lies in potential further escalation. And, unpredictability about which products might face tariffs next is increasing uncertainty across exporters and importers on both sides of the border.
So far, however, the escalation has been contained. The Canadian economy has proven more resilient than initially feared to trade shocks over the last year and a half with significant impact in targeted subsectors, but not yet spreading to other parts of the economy.
Business investment has also shown signs of recovery, partly reflecting the global buildout of data centers to support AI capabilities beginning to spill more significantly into Canada.
The Canadian economy remains closely tied to the U.S. and vulnerable to broader trade shocks, but it’s substantially firmer than in spring 2025 when tariffs first increased significantly.
Consumer spending holds firm despite energy costs
Higher energy prices as the Middle East conflict limits oil flows through the Strait of Hormuz is cutting into household purchasing power, particularly for lower-income earners.
Still, the household saving rate actually rose in Q2, reflecting, in part, a jump in government transfers, but also the largest rise in wage and salary growth (1.4%) in nearly two years.
Hourly wage growth has slowed with the unemployment rate still elevated, but employment growth bounced back after a soft start to the year.
Housing markets have shown further signs of stabilizing, and our tracking of RBC card transactions points to further resilience in consumer spending growth in the summer.
Higher oil prices also mean much higher revenues flowing into oil producing parts of the country as a net energy exporter.
Odds of earlier BoC rate hike increasing
The Bank of Canada has signalled greater concern about higher energy costs feeding into broader inflation than about trade risks, viewing targeted government spending as better suited to address sector-specific impact from trade than blanket rate changes.
To date, there’s little evidence of significant passthrough from higher energy prices beyond a mechanical jump in gasoline prices. We continue to expect limited passthrough to end consumer prices outside of very heavily energy intensive products like gas and airfares.
However, a consequence of a gradually improving economy and lower unemployment rate is also that the argument for leaving the overnight interest rate at the lower end of the BoC’s estimated 2.25% to 3.25% neutral range will continue to weaken over time.
We expect the central bank will continue to make policy decisions based on the broader health of the Canadian economy, and forward inflation risks rather than directly responding to global oil prices.
But, we continue to anticipate the economy will support gradual interest rate hikes beginning in Q1 2027, and there are growing risks that first hike could come earlier.
Canada’s provincial economies diverge on multiple fronts
2026 is playing out largely as expected with all provinces on track for growth for a third consecutive year.
Resilience in the household sector, improving labour markets and stimulative fiscal policy provide widespread support across the country.
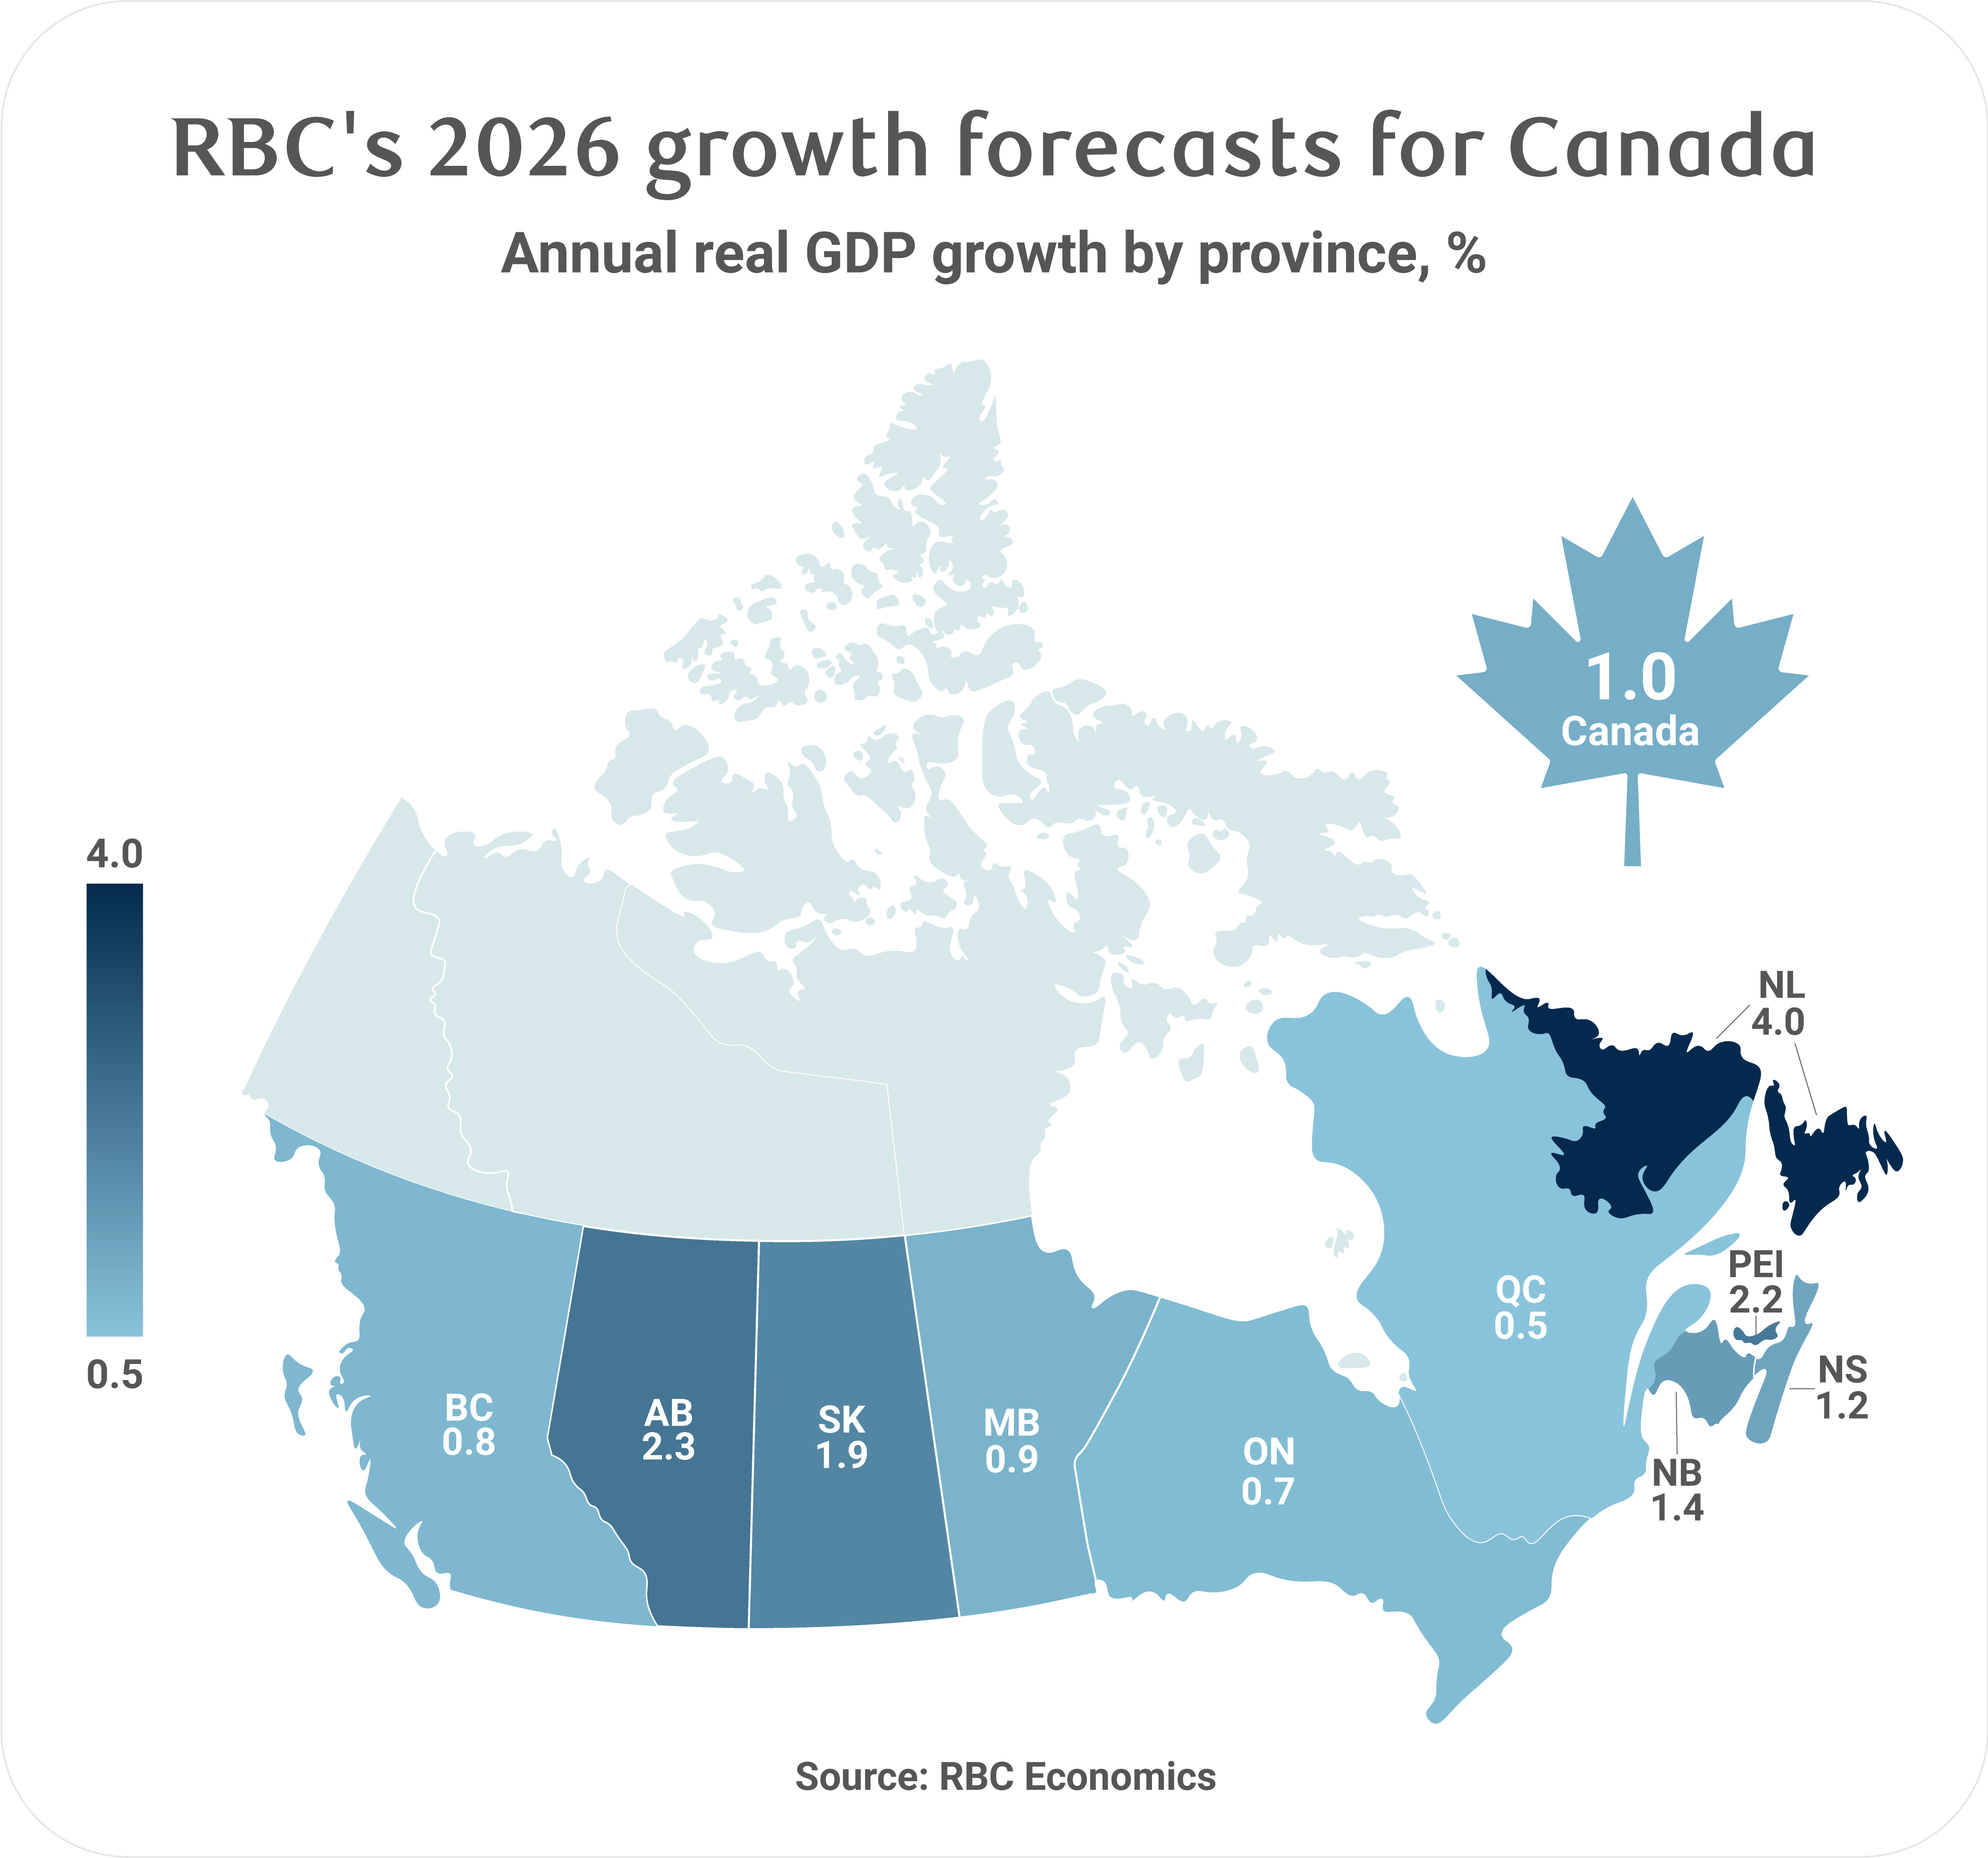
Still, the pace of growth varies widely. U.S. tariffs, high commodity prices, declining populations, and shifting housing investment dynamics keep a wedge between regions, putting a 3.5 percentage-point spread between the fastest (Newfoundland and Labrador) and slowest (Quebec) growing provinces.
Commodity-rich Newfoundland and Labrador (4%), Alberta (2.3%), and Saskatchewan (1.9%) lead the pack alongside Prince Edward Island (2.2%). They’re followed by New Brunswick (1.4%), Nova Scotia (1.2%) and Manitoba (0.9%).
British Columbia (0.8%), Ontario (0.7%), and Quebec (0.5%) anchor the bottom of our growth ranking, held back by tariff exposure and population growth slowdowns.
Our forecast has minor upward revisions from the June Quarterly Canadian Outlook for Ontario and Quebec despite them bearing the brunt of new Section 338 tariffs. Strong Q2 performance in Ontario and better-than-expected Q1 growth in Quebec put them on better footing for the second half of 2026 than previously anticipated.
We’ve also upgraded Newfoundland and Labrador and Alberta slightly on sustained high commodity prices, and enhanced capacity (in some cases) driving greater production.
New tariffs compound pressures in trade-exposed provinces
U.S. tariff damage has landed harder in some regions. Ontario, Quebec, and B.C. are weathering the worst of it with key exports like vehicles, steel, transport equipment, and forestry product weakening, and impacting jobs in affected industries. New U.S. Section 338 tariffs pose further downside risk. Plastic products, electrical machinery, furniture, and wood products are among the most significantly impacted sectors and could materially slow—or even halt—some exports to the U.S. from these provinces.
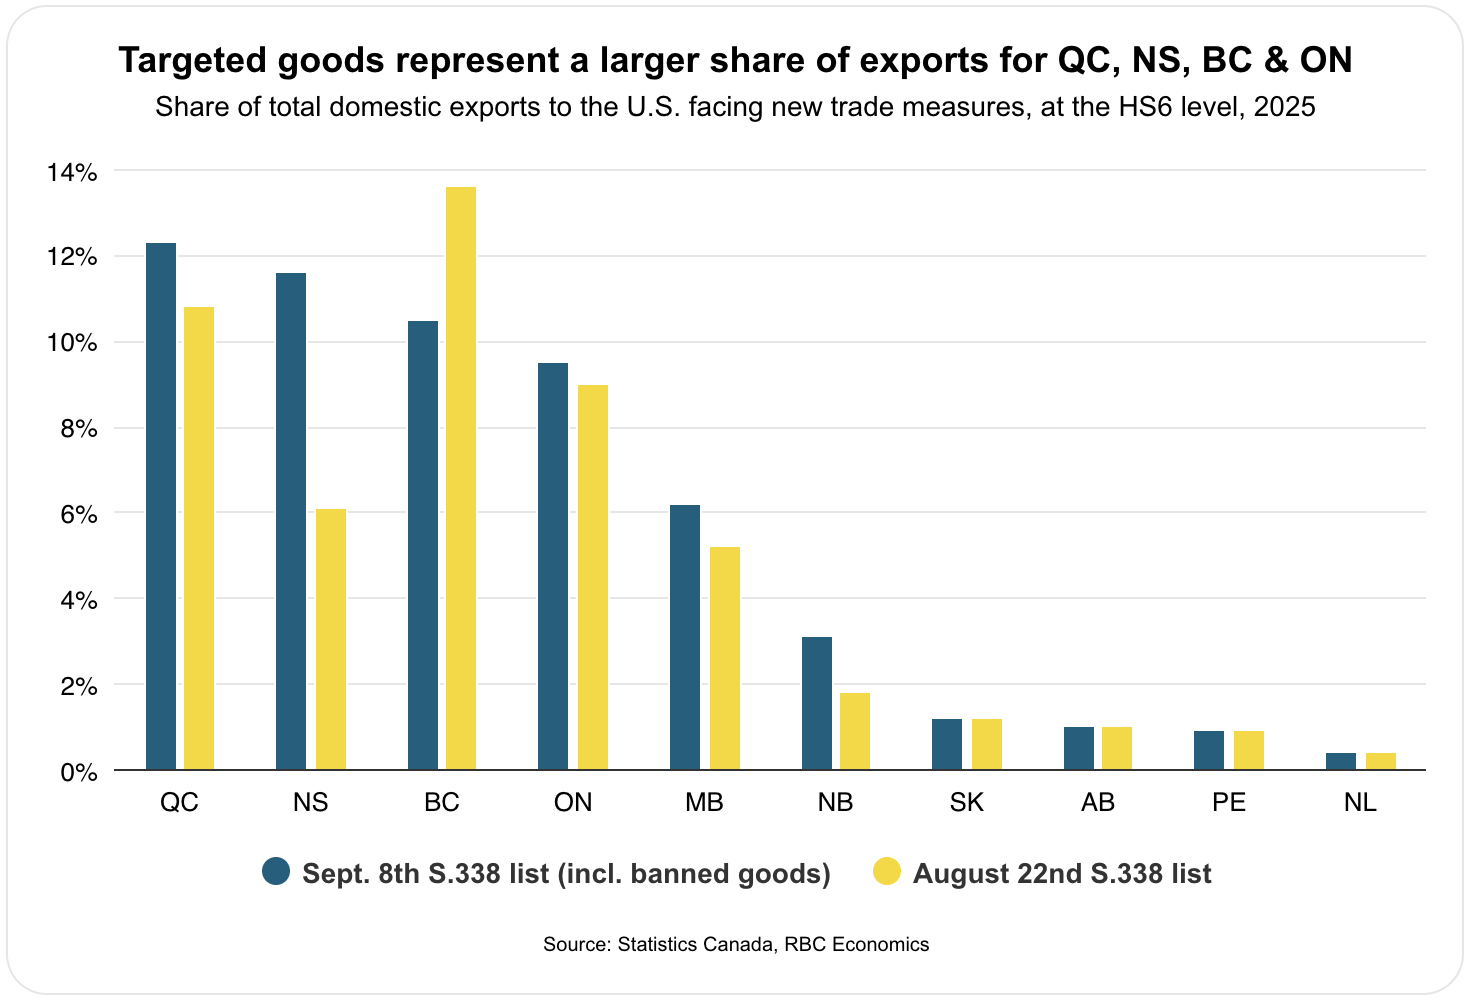
The September tariff adjustments shuffle exposure among some provinces, but leave the underlying pecking order largely intact. Some paper products were added to the tariff list, hitting Nova Scotia disproportionately and placing it among the most exposed provinces. Exports of paper products represent roughly 0.4% of nominal provincial GDP—a meaningful blow for the sector, but unlikely to add a material drag to headline growth.
By contrast, the removal of control boards and panels1 from the tariff list should provide modest relief to B.C.’s export base.
New tariffs (including Section 338) could affect roughly 12% of Quebec and Nova Scotia’s domestic exports to the U.S. and 10% for B.C. and Ontario—about double the national average.
While material, U.S. tariffs still represent a sectoral rather than economy-wide shock. Fiscal support combined with offsetting growth from other sectors should prevent a deeper slowdown in real GDP growth.
Natural resource upswing promotes growth in commodity-rich provinces
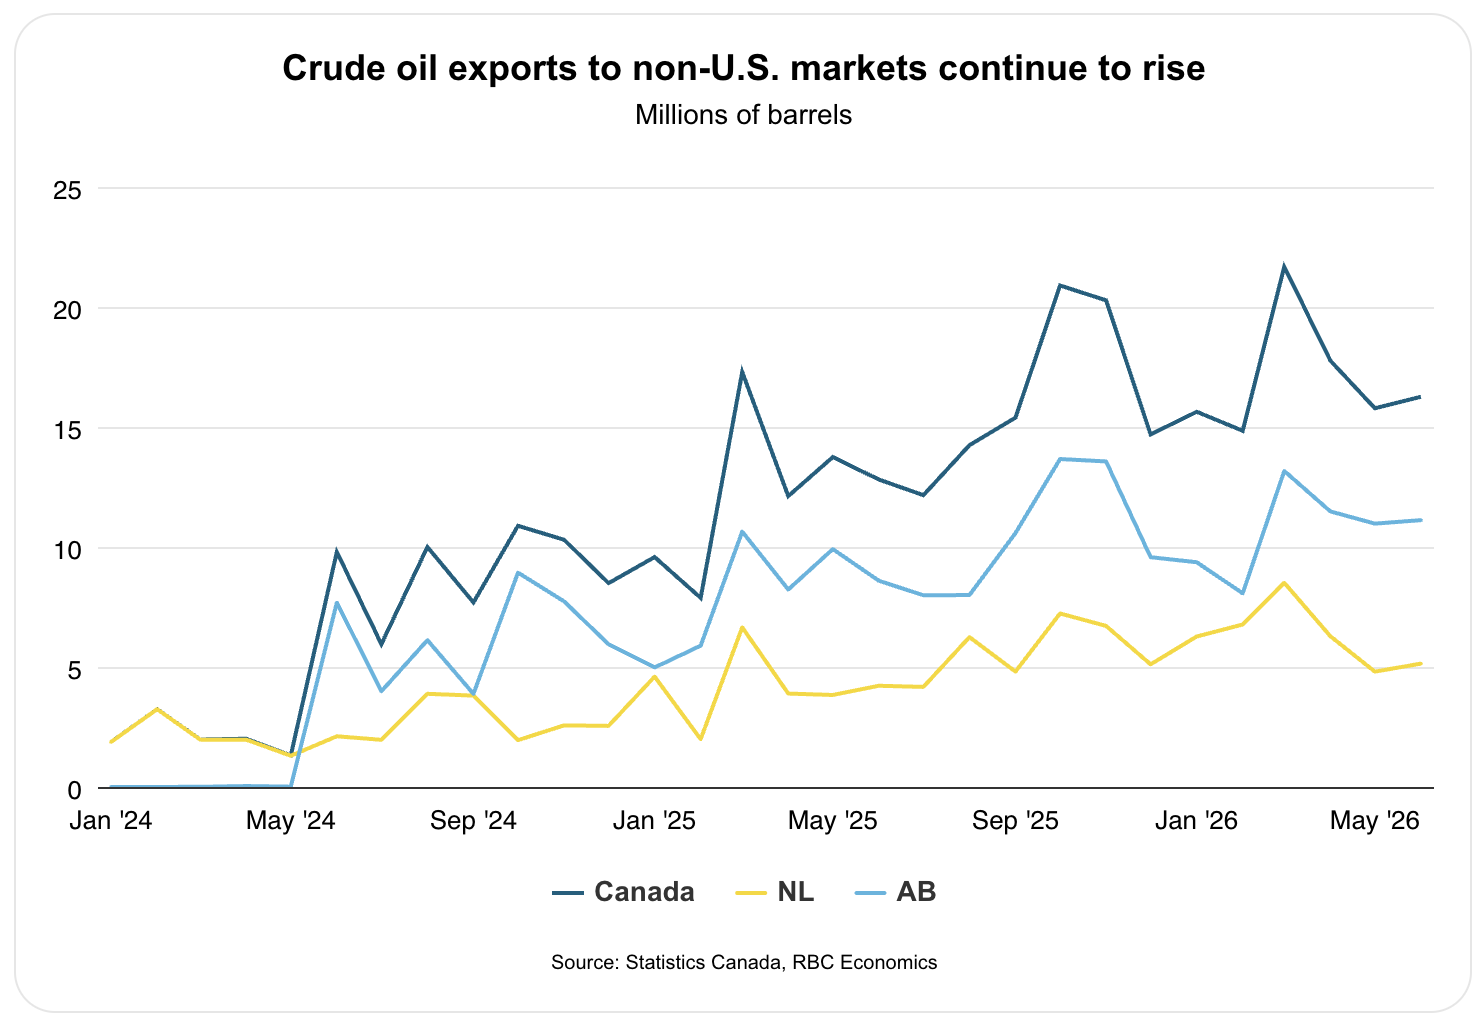
The convergence of elevated commodity prices and expanding production capacity is driving outsized growth in resource-producing regions, which benefit from production royalties while staying largely sheltered from U.S. tariffs.
Newfoundland and Labrador and Alberta are benefiting from increased capacity from TMX and the production ramp up of all four of Newfoundland and Labrador’s offshore fields after extended downtime.
Among other commodities, higher canola prices—driven by strong domestic canola seed crush and Chinese demand—have spurred record planting in Saskatchewan.
Consumer spending holds across most provinces
Consumer spending resilience holds across most provinces—even after controlling for inflated spending on gas.
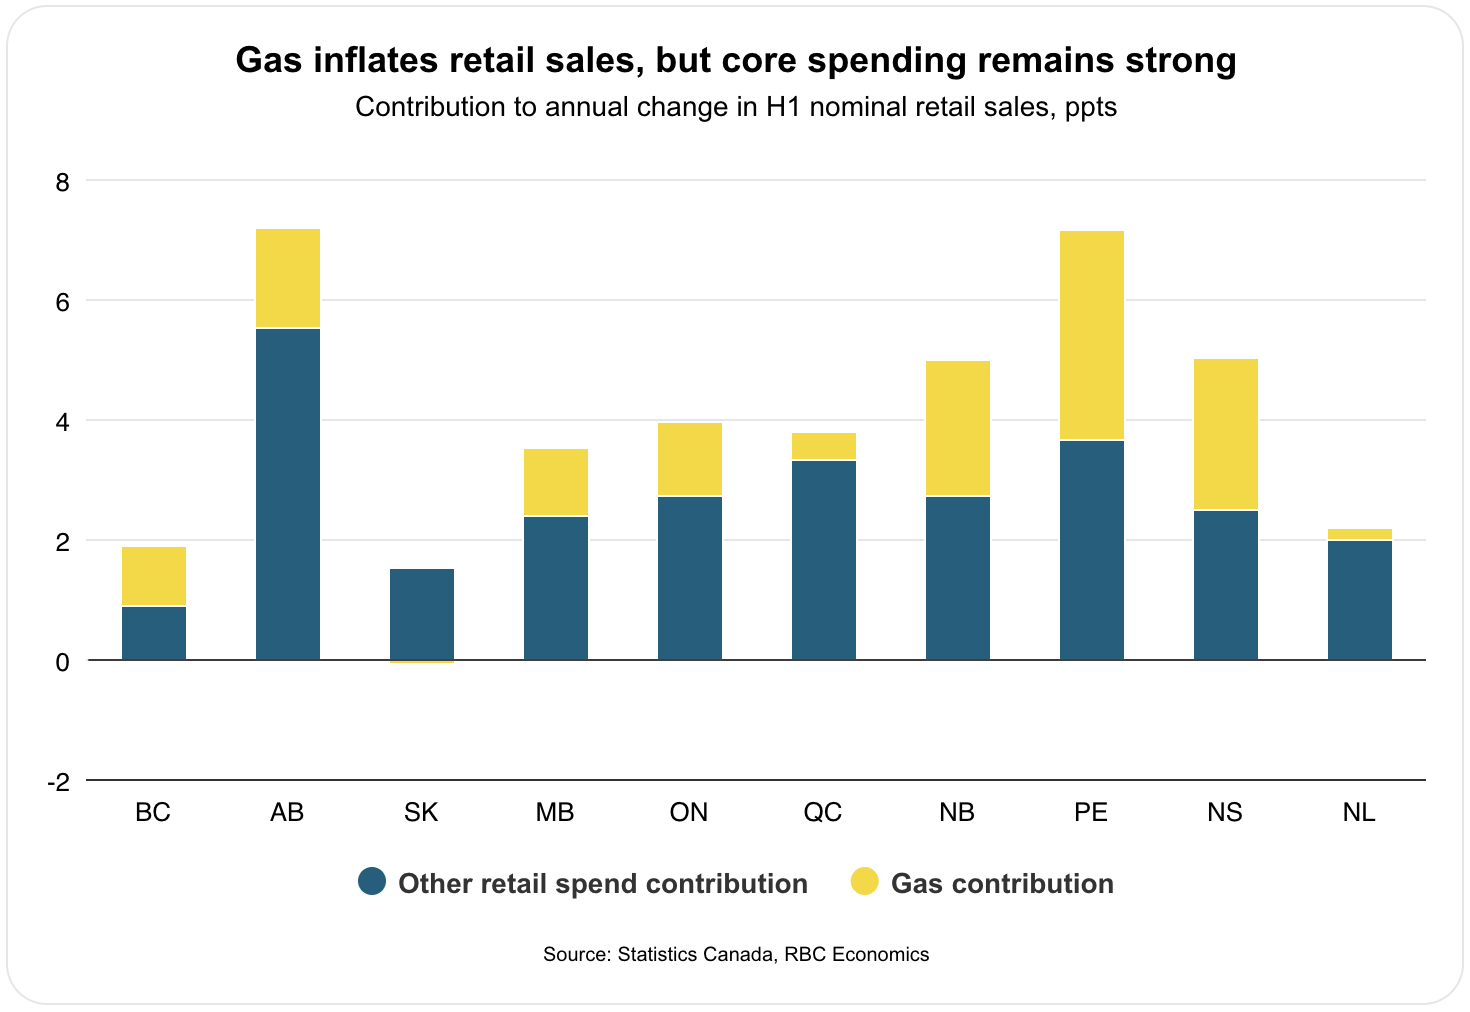
Alberta leads the country in retail sales growth thus far, supported by above-average population gains and broader economic outperformance. P.E.I., New Brunswick, and Nova Scotia aren’t far behind, though. Gas prices are providing outsized support to those figures—accounting for 1.5 to two times the average budget share—with underlying consumer spending remaining solid.
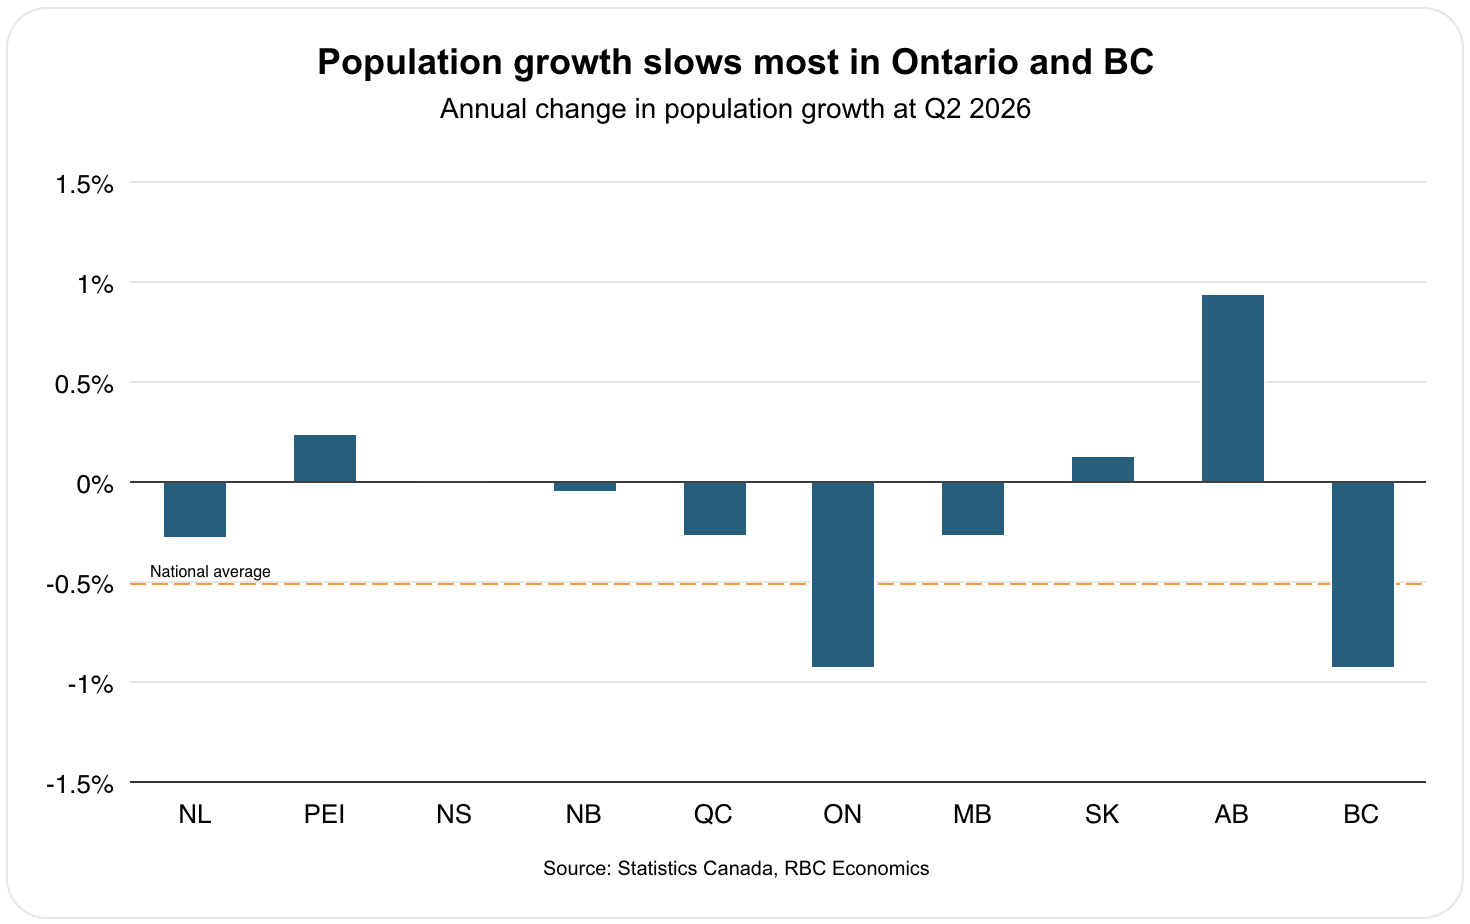
We’ve highlighted before early signs of savings drawdowns to cover higher bills, but we’re not seeing material signs of financial stress at the aggregate level in any province yet. This should support consumer spending over the rest of the year and into 2027, albeit at varying rates across the country.
Detailed forecast tables
Macroeconomic forecast details
Interest rates and Key FX rates
About the authors:
Frances Donald is the Chief Economist at RBC and oversees a team of leading professionals, who deliver economic analyses and insights to inform RBC clients around the globe. Frances is a key expert on economic issues and is highly sought after by clients, government leaders, policy makers, and media in the U.S. and Canada.
Robert Hogue is an Assistant Chief Economist, responsible for providing analysis and forecasts on the Canadian housing market and provincial economies.
Nathan Janzen is an Assistant Chief Economist, leading the macroeconomic analysis group. His focus is on analysis and forecasting macroeconomic developments in Canada and the United States.
Rachel Battaglia is an Economist at RBC, providing forecasts for the Canadian provincial economies and analysing key trends in housing and consumer spending.
Salim Zanzana is an economist at RBC. He focuses on emerging macroeconomic issues, ranging from trends in the labour market to shifts in the longer-term structural growth of Canada and other global economies.
- Based on exports under HS 8537.10 ↩︎
This article is intended as general information only and is not to be relied upon as constituting legal, financial or other professional advice. The reader is solely liable for any use of the information contained in this document and Royal Bank of Canada (“RBC”) nor any of its affiliates nor any of their respective directors, officers, employees or agents shall be held responsible for any direct or indirect damages arising from the use of this document by the reader. A professional advisor should be consulted regarding your specific situation. Information presented is believed to be factual and up-to-date but we do not guarantee its accuracy and it should not be regarded as a complete analysis of the subjects discussed. All expressions of opinion reflect the judgment of the authors as of the date of publication and are subject to change. No endorsement of any third parties or their advice, opinions, information, products or services is expressly given or implied by Royal Bank of Canada or any of its affiliates.
This document may contain forward-looking statements within the meaning of certain securities laws, which are subject to RBC’s caution regarding forward-looking statements. ESG (including climate) metrics, data and other information contained on this website are or may be based on assumptions, estimates and judgements. For cautionary statements relating to the information on this website, refer to the “Caution regarding forward-looking statements” and the “Important notice regarding this document” sections in our latest climate report or sustainability report, available at: https://www.rbc.com/community-social-impact/reporting-performance/index.html. Except as required by law, none of RBC nor any of its affiliates undertake to update any information in this document.
Get the latest forecasts and analysis from RBC Economics.
Subscribe Now
- Resilience amid renewed trade tensions
- Consumer spending holds firm despite energy costs
- Odds of earlier BoC rate hike increasing
- Canada’s provincial economies diverge on multiple fronts
- New tariffs compound pressures in trade-exposed provinces
- Natural resource upswing promotes growth in commodity-rich provinces
- Consumer spending holds across most provinces
- Detailed forecast tables
