

 EN
EN 

Key Takeaways
Canada’s immigration strategy has lost its edge. Population shocks—including the admission of a decade’s worth of immigration in just three years—policy volatility, a diminished focus on skills and experience, and a lack of real time data and transparency are to blame. The result: public sentiment has turned negative for the first time in more than 20 years.
Without immigration, Canada’s population will be cut in half by the turn of the century. Our population is aging, deaths are outpacing births, and workforce participation is shrinking at a time when international competition for highly skilled working-age talent is growing.
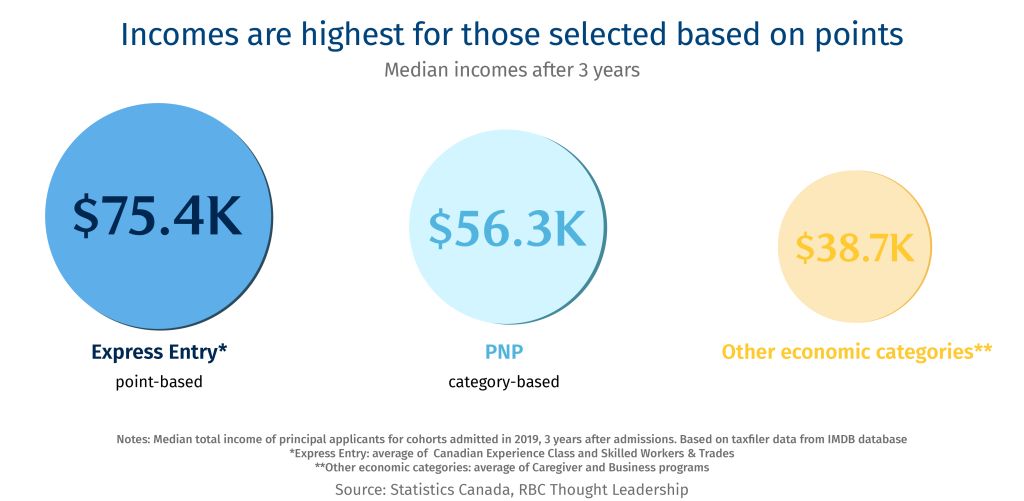
Express Entry is not working as intended. The goal of the flagship system is to select applicants with the highest earning potential, and it has; 30% higher median earnings after three years than those coming through the Provincial Nominee Program (the next biggest economic stream)a. But sub-categories are now undermining the program, allowing lower scorers to leapfrog people ahead in line.
Categories need to be reined in and more closely aligned with regional talent shortages. Canada needs some immigration categories to address talent shortages (e.g., blue-collar workers), which vary by region. But 80 provincial streams and duplicative federal categories add unnecessary complexity to the system.
Temporary pathways prioritized volume over skill, undermining a core two-step advantage. The focus on attracting workers and students to fill low-wage labour gaps and prop up underfunded colleges undermined a strategy that had seen former temporary residents gain an earnings advantage over direct permanent residents for more than two decades.
Canada could restore its advantage in the global competition for talent by:
-
Stabilizing with a population growth target (e.g., 1%)
-
Restoring the points system; going back to basics and removing Express Entry sub-categories
-
Concentrating most categories at the provincial and territorial level to address regional skills shortages
-
Recovering the two-step strategy with highly skilled temporary admissions and Express Entry points for Canadian experience
-
Closing the data gap with near real time and more complete information about outcomes, including exits and earnings.
We’re at a unique moment in Canadian history. The country’s economic ambitions have captured the world’s attention, with global capital and talent increasingly looking here as a place to build and invest. Whether Canada capitalizes on this momentum depends heavily on having the people, skills and ambition to drive it. That means includes a strong, stable immigration strategy, something Canada has relied on through our entire modern history.
This report was developed to help Canada get that strategy back on track, knowing the decade ahead will be unlike any other. Our country is undergoing a demographic shift. Meanwhile, advanced technologies including AI and robotics are changing the way we live and work. And the values and ambitions of our country and its communities continue to evolve.
For RBC, this is much more than a macroeconomic challenge. It cuts to the core of our purpose, in helping clients thrive and communities prosper. Since RBC’s founding, immigrants have played a critical role. Newcomers to Canada were among the group in 1864 who started the Merchants’ Bank of Halifax, which was the bank’s original name. RBC grew with the country, setting up tent branches beside railway construction to serve the people literally building Canada. More recently, we pioneered dedicated Newcomer Centres offering one-on-one advice, low-interest loans for internationally trained physicians, and currently offer our services in 200 languages.
The stakes are high. And now is the time to restore our advantage in the global competition for talent with a smarter strategy.
—John Stackhouse, Senior-Vice President, Office of the CEO, Royal Bank of Canada
Canada’s immigration strategy needs a reset.
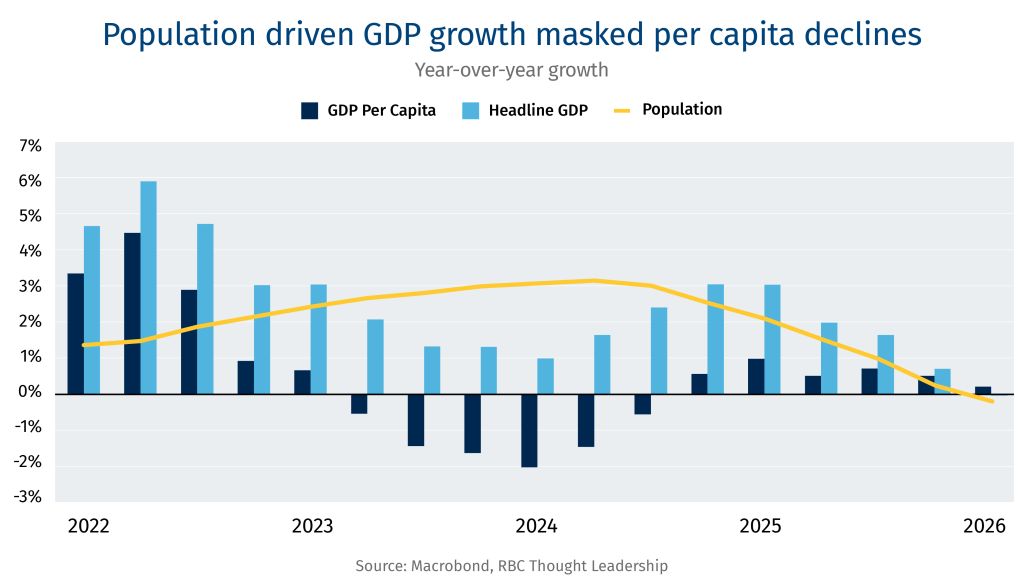
The country added three million migrants, roughly the equivalent of a decade’s worth of immigration, between 2022 and 2024. The historic spike, driven by a surge of lower-skilled temporary resident admissions, overwhelmed infrastructure and services and masked a softening economy; per capita GDP fell for two consecutive years. A subsequent pullback on immigration resulted in Canada’s first population decline in modern history.
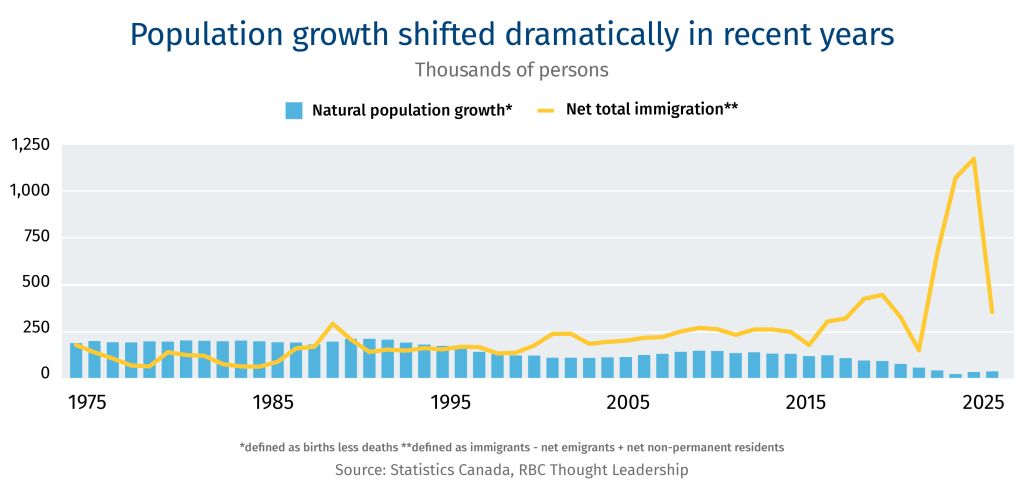
These population shocks are emblematic of how Canada’s once renowned immigration system has lost its edge. Policy volatility, a weakened points system, and a diminished focus on skills and experience also share the blame.
This loss of efficacy comes as demographic pressures rise and the global race to attract world-class talent intensifies. Deaths are outpacing births in Canada. Without immigration, the country’s population would shrink to half its size by the turn of the century.
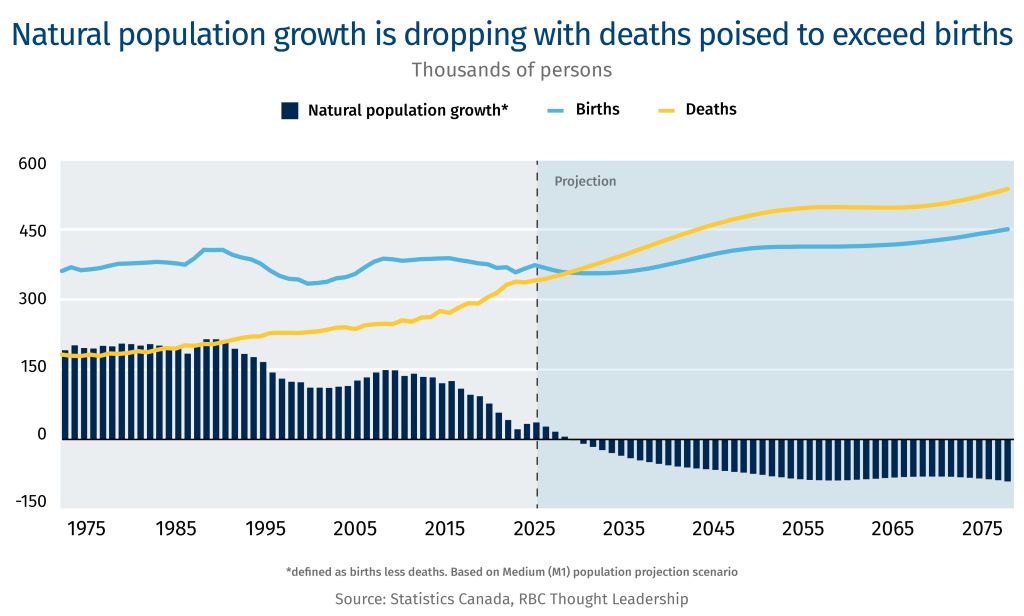
Plus, more than 25,000 Canadians retire every month; that’s nearly double two decades ago,1 and the elderly to working-age ratio will put intense strain on pensions and healthcare models.
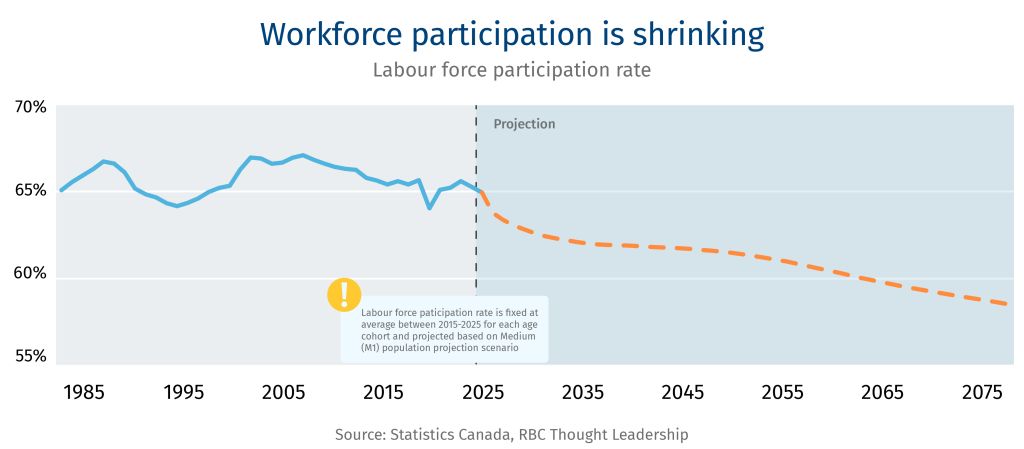
Canada is not alone in facing these demographic challenges. The population of those under 25 across the globe has likely peaked,2 signalling an impending labour force decline worldwide. As these trends continue, competition for highly skilled working-age talent will grow.
Despite these pressures, 71% of Canadians think there is too much immigration.3 Polls indicate most of those surveyed are not anti-immigrant but concerned with government management of the immigration file.4 Having a constructive conversation about Canada’s immigration policy could get admissions back on track and avoid slipping into the kind of politically charged, counter-productive discourse taking hold in places like the U.S. and Europe.
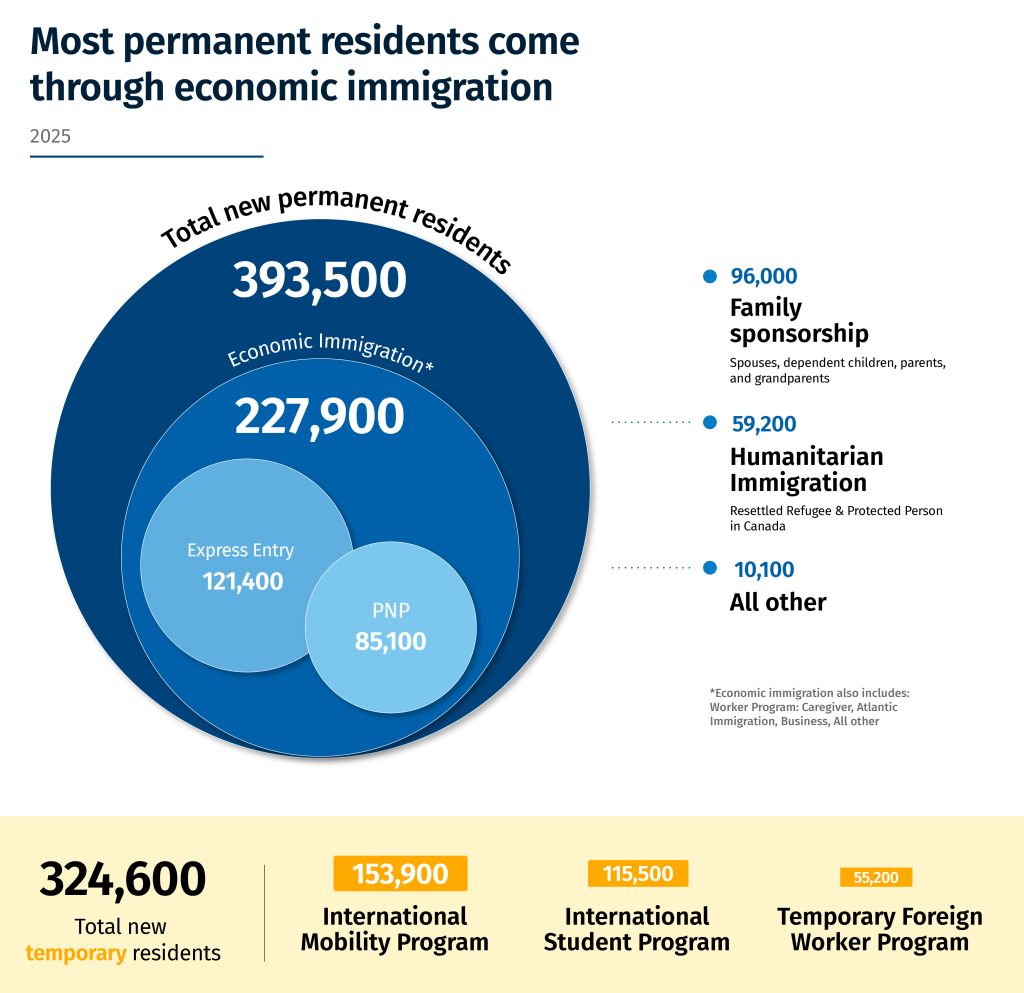
Five critical questions for Canada
Over the past six months, we consulted more than 60 experts—economists, demographers, pollsters, industry representatives and policy makers—to understand what went wrong with Canada’s economic immigration policy in recent years, and to capture ideas and insights for a better path forward. These interviews and roundtable discussions, along with our own research and data analysis, have surfaced five questions Canadian policymakers must grapple with, urgently and transparently, as part of reimagining a smarter strategic path for immigration.
1. Is there a magic number?
In the decades leading up to the pandemic, Canada’s population growth was relatively steady, averaging 1.1% and ramping up gradually to 1.5% in 2019 (above the 0.6% OECD average at the time, but our population density is lower). This stability allowed Canada to add people without overwhelming infrastructure or services.
Post-pandemic population shocks, by contrast, created strain and uncertainty. Canada added a decade worth of immigration (about three million migrants) in just three years post-lockdown. The rapid population growth, driven by low-skilled temporary migration, overwhelmed infrastructure and services and masked a softening economy; temporary residents grew from less than 3% of the total population leading up to the pandemic to 7.6% in 2024;5 rental prices in major cities like Vancouver and Toronto soared; and per capita GDP fell for two consecutive years.6 In 2023, public sentiment toward immigration turned negative for the first time in 20-plus years.7
Recognizing the need to rebalance, Canada instituted a cap on the temporary resident population (working toward 5% of total population) and added guardrails to prevent abuse of temporary programs by employers and education providers. But these measures generated shockwaves, too. For example, there were more than 25 rule changes affecting international students in roughly two years,8 and more than 20,000 job losses in the postsecondary sector.9 And last year, Canada’s population declined for the first time since the 1950s.
Canadian communities, businesses, and prospective skilled immigrants need more stability and predictability to make realistic plans.
What’s the Levels Plan?
Canada’s Levels Plan is released annually by the Minister of Immigration. It sets out how many permanent and (since 2024) temporary residents the country will admit across different categories in the upcoming year, and notional targets for the following two years. It’s essentially the government’s rolling three-year blueprint for immigration volume and composition.
Key considerations
-
Canada could consider reaching and maintaining a stable population growthb target of about 1%, which has worked well historically, and situates immigration policy decisions in the context of other population dynamics, including fertility and longevity.
-
The target could operate within a control range, allowing for modest (e.g., +/- 0.2%) annual adjustments that account for factors such as shifts in economic and labour market trends, to ensure newcomers are set up for success.
-
-
The balance of admissions—about 60% economic immigration, 15% humanitarian, and 25% family reunification—has been consistent for the past decade. Canada could consider maintaining this balance moving forward.
-
Policy changes and ministerial instructions could be limited to the immigration Levels Plan each year, along with information such as:
-
The logic and evidence behind the plans (e.g., population projections, employment forecasts, infrastructure capacity)
Formulas and weighting used for provincial allocations and Express Entry scoring.
-
-
The growth rate should be matched with policies and investments to meet the expected needs of the corresponding population size. Higher growth requires larger investments in public infrastructure like housing and transportation, services like health care and education, and more private capital to ensure a productive workforce. If Canada opts for a lower growth rate, policies need to account for funding and labour shortfalls associated with an aging population, smaller workforce and taxbase, alongside growing care needs. In that scenario, Canada might consider, for example, a greater role for technology in hospitals and long-term care facilities.
2. How do we select those most likely to succeed?
Canada invented the immigration points system in 1967. Bureaucrats assigned scores across nine categories, including education and training, occupational demand and language ability—a minimum of 50 points out of a possible 100 were required for admission.10 The system helped reduce bias in Canada’s immigration selection and drive both economic growth and our country’s multicultural vibrancy.
What’s the points system?
Canada’s points system is a tool for admitting immigrants based on their earning potential. Since 2015, the points system, or Comprehensive Ranking System, has been run through the Express Entry program. It assigns each applicant a score based on a series of factors, including education, language skills, work experience and age.
The modern version of the points system, the Express Entry program introduced in 2015, uses evidence of who thrived in the past to identify applicants most likely to succeed in the future—and admit them first.
And it does a good job; top scorers tend to see higher earnings. Immigrants coming through the Canadian Experience Class—the Express Entry category with the highest cut off score—have consistently out-earned arrivals from other pathways with median earnings of $92,100 after 10 years compared with $67,400 for economic immigrants, and $47,600 for Canadians overall.11 Even three years out, median incomes for the full group of principal applicants through Express Entry are considerably higher (see chart below).
But a recent policy focus on admitting newcomers through Express Entry categories, tied to a specific occupation, is undermining the program. Legislation introduced in 2022 allows Canada to add Express Entry categories (beyond the original threec) that advance specific priorities. The categories rank a subset of candidates within the pool against others who meet specific criteria.12 Teaching assistants, for example, are scored against others in the educational occupations category—including teachers and early childhood educators—and may leapfrog higher scoring candidates in another category, maybe engineers or nurse practitioners, that are also in line for admission. In effect, competition among people lining up in the Canadian Experience Class category is getting steeper, while new categories create lower bars for entry; admission through the Canadian Experience Class requires over 100 points more, on average, than it does through other categories.

The list of Express Entry categories has changed multiple times since 2022, illustrating how quickly skill demands change and the futility of designing permanent immigration around them at a national level.
The Express Entry program also lost the original points system’s minimum threshold; cut off scores dropped from the mid-400s pre-pandemic to as low as 75 in 2021 as Canada sought to meet permanent residency targets amid travel restrictions.13 And it has been losing ground: in 2000, almost 80% of economic immigrants were admitted through federally managed point-based selection; lately that percentage is closer to 30%.14
Re-focusing federal admissions on top scorers, rather than trying to predict and meet demands for specific skills or occupations (which vary by region), could restore the Express Entry program to its intended purpose.
Key considerations
-
Canada could consider whether setting a minimum proportion of permanent economic immigration for admission through Express Entry would help boost prosperity and public confidence. Policymakers might also consider re-introducing a minimum cut-off score of core selection factorsd.
-
Express Entry draws should see the highest-ranking candidates admitted. To ensure this happens, Canada could refrain from leveraging the Express Entry program to advance short-term aims by adding sub-categories within it or other federal economic immigration categories alongside it.
-
The federal government has signalled that it plans to streamline Express Entry categories. It could potentially go further by reversing the 2022 legislation allowing additional category-based draws.
-
-
Canada could commit to regular reviews to recalibrate and help keep the scoring mechanism current, ensuring the points system reflects changing labour dynamics (for example, reflecting the skills that prove resilient as the impacts of AI plays out in the market).
3. What about Canada’s skills gaps?
One could argue that all of Canada’s economic immigration should come through Express Entry; that admitting highest scorers is the surest way to raise average earnings and living standards. But this would ignore talent shortages in communities across the country.
As the Canadian population ages, the demand for healthcare workers is growing faster than we can train domestic workers. Between 2016 and 2024, the proportion of unfilled jobs in health care nearly tripled,15 and grew five times for licensed practical nurses.16
Skilled trades are also being squeezed. British Columbia, for example, will need to grow its non-residential construction workforce by 10% to complete projects, including the Richmond Hospital Expansion and work at St. Paul’s and Surrey Hospitals.17 The federal government estimates more than 1.4 million new trades workers will be needed by 203318 as a wave of retirements hits. Predicted shortages vary by region: cooks and welders top the list for in Ontario, while Yukon’s greatest future needs include plumbers and construction electricians.19
Category-based selection through pathways like the Provincial Nominee Program (PNP) admit people based on specific skill needs and help distribute immigration across the country. When the PNP was introduced in 1998, 11% of economic immigrants settled outside of Ontario, Quebec, and B.C.; by 2024, that proportion was up to 37%.

But Canada needs to be careful with the proliferation of categories, which vary significantly across provinces, despite addressing similar needs, and overlap with categories at the federal level. All provinces, for example, have different pathways targeting entrepreneurs, skilled workers, and international graduates of Canadian postsecondary institutions.20 Imagine evaluating this maze of about 80 provincial pathways21 as a prospective immigrant.
Another major challenge with the PNP is retention—certain provinces, and rural regions of most provinces, have a hard time enticing skilled newcomers to stay. Five-year retention rates range from 39% in Prince Edward Island and 61% in New Brunswick to about 94% in Ontario and Alberta for cohorts landing between 2010 and 2015.22
Canada needs some category-based immigration pathways to help address talent shortages that the points system may not prioritize, but federal and provincial goverments need to be strategic about how they are managed.
Key considerations:
-
Situating immigration categories with provinces and territories, and reducing the number at the federal level, would move targeted admissions closer to regional labour markets and allow the federal government to focus on admitting candidates with the highest projected earnings.
-
Provinces involved with the Provincial Nominee Program (PNP) could coordinate to reduce system complexity, aiming for fewer, more stable categories (potentially with adjustable criteria to allow for nimbleness).
-
Provinces could leverage labour market information to align categories with proven opportunities. They could also aim to select and nominate more provincial applicants from the Express Entry pool, who tend to see earnings about 30% higher than other cohorts after three years.23
-
Retention rates improve when newcomers are employed and see earnings growth.24 Provinces could experiment with different ways of setting newcomers up for successful careers, including, for example, practice-ready assessment pilotse to credential the skills newcomers arrive with.f
-
Provinces could also build stronger evaluation frameworks. Research organizations in B.C., Manitoba, Ontario, and New Brunswickg have data sharing agreements with the federal government that link immigration records and provincial datasets and provide faster, more detailed insight into who is staying in the province. Other provinces could follow suit.
4. How do we fix the temporary talent pipeline?
Even when immigrants arrive with qualifications Canada needs, it can often take years for their credentials to be recognized and supplemented with local experience needed to succeed in the Canadian labour market. This is what the two-step model Canada has been embracing for more than two decades solves for.
What’s two-step immigration
Two-step immigration refers to the path to permanent residency taken by a growing share of immigrants Canada. It’s a process where individuals first enter Canada as temporary residents—such as foreign workers or international students—and later transition to permanent residency through programs like Express Entry or the Provincial Nominee Program.
With two-step immigration, skilled newcomers arrive with study or work permits, earn recognized credentials, and/or build experience and networks that translate into higher earnings. Those who came through the two-step Federal Skilled Worker program earned an average of $18,000 more than one-step participants 10 years after arrival;25 and permanent residents who previously studied in Canada earned about 30% more than similarly credentialed arrivals.26 In fact, temporary resident earnings are the strongest predictor of earnings as a permanent resident.27
But these earnings gains, over and above one-step immigrants, are lost when temporary residents arrive with a low level of skill or enter low-quality postsecondary programs.
Canada started to see these gains diminishing before the pandemic as colleges and universities grew international enrolments; many colleges did so with the help of private partners and makeshift satellite campuses, without guardrails to ensure students were entering quality programs.
Then the pandemic hit. Businesses and postsecondary institutions emerging from lockdowns called for more temporary workers and students, and government responded. International student enrolments exploded — then-Immigration Minister likened colleges to “puppy mills”28 — while businesses filled gaps in low-wage work brought about by factors like the so called “CERB effect,” which disincentivized minimum wage workers from returning to their roles.29
Between 2019 (pre-pandemic) and 2023:
-
Study permit approvals increased 102%30
-
Post-graduate work permits increased 154%31
-
Temporary foreign worker permits rose 88%
-
Permits through the international mobility program, an expedited version of the temporary worker program, increased 126%.32
By 2023, the median entry wage for two-step immigrants had fallen to its lowest level since 2017.33
The policy response has since moved in the opposite direction: towards tighter selection and fewer temporary entrants. In 2024, for example, Canada introduced guardrails on the international student program, including Provincial Attestation Letters to allocate capped student spaces across the country. It also tightly restricted new study permits (the approval rate in September 2025 was 38%, down from 58% in 2023 when application volumes were much higher).34
Both pendulum swings—the surge in low-skilled temporary inflows and the tight restrictions on students entering quality programs—undermine the logic of the two-step strategy the country continues to embrace as it transitions record numbers of temporary residents to permanent status.
Key considerations
-
International graduates of high quality, labour market aligned postsecondary programs are good candidates for permanent residency if they wish to stay, and good ambassadors for Canada if they don’t. But that’s not how colleges and universities were incentivized to think about international students. Updating provincial funding models, so that public institutions are not reliant on international tuition to fund domestic seats, could protect the sustainability of a world-class education system and the integrity of the two-step talent pipeline.
-
Once the 5% temporary resident target is met, Canada could evaluate returning to demand-driven international student admissions (perhaps with a pilot at the graduate level, which is already exempt from Provincial Attestation Letter caps) to assess the impact on temporary immigration levels and skills composition. Canada might also pilot a temporary entrepreneurship pathway as a way of attracting investors and job creators with a track record.h
-
Including earnings as a temporary worker and earnings associated with specific post-secondary programs in Canada’s scoring mechanism could improve outcomes, especially if it was transparent to applicants (i.e., if Canada illustrated how postsecondary program selection may affect scores, it could drive applicants to programs with proven labour market success).
5. Why don’t the numbers add up?
The information available to guide Canada’s immigration policy decisions is not as complete or timely as it could be. While Canada has decent sightlines into immigration’s economic impacts through the Longitudinal Immigration Database (IMDB)—which draws on tax filing data—a two-year reporting lag undermines its utility.
New Zealand’s Migrant Employment Data has a reporting lag of only three months, combining immigration data with monthly tax information.35 Canada’s ePayroll project, which aims to standardize and centralize employer payroll submissions, could lend itself to reporting capability comparable to New Zealand’s if it goes ahead.
In the meantime, the Labour Force Survey (LFS) provides faster insights than the IMDB. The LFS generates employment estimates and other labour market information every month, with a lag of only 10 days between collection and release.36 However, the data is less detailed and reliable than the IMDB, and temporary residents are underrepresented. LFS data does not paint a picture of where specific groups of temporary residents, like post-graduate work permit holders, end up.
Until recently, Canada has also lacked adequate compliance data. A 2026 auditor general report found Immigration, Refugees and Citizenship Canada (IRCC) “did not know whether students were leaving Canada after their permits expired;” the Canada Border Services Agency (CBSA) was only able to confirm departures for about 40% of almost 40,000 expired study permit holders.37 In response, the IRCC and CBSA launched a pilot program that tracks exits.
Beyond data gaps, decision-making opacity poses its own challenges for public confidence. The permanent resident target of 380,000 in the 2026-2028 Immigration Levels Plan represented a modest increase from the previous year’s projection but was framed as a contraction—presented alongside 2024 figures and failing to account for one-time initiatives to rebalance the temporary resident population (i.e., transitioning 148,000 to permanent status). This obfuscation only raises public skepticism. Meanwhile, the IRCC publishes the nominations each province receives through the PNP in the Levels Plan each year, but the specific formula and weighting factors used to make allocation decisions remain undisclosed.
Improving timeliness, completeness and transparency around immigration data collection and reporting could help improve immigration policy decisions and public confidence in them.
Key Considerations
-
Advancing the ePayroll Project with input from departments including Statistics Canada could enable faster insights on key metrics. This could be part of a multi-tiered data approach that also includes:
-
Integrating ePayroll data with the IMDB to ensure policy makers also have access to a more detailed longitudinal picture provided by tax and immigration data linkages.
-
Gathering more nuanced data from temporary residents in the LFS questionnaire, and publishing departure estimates by permit type (for example, for post-graduate work permit holders).i
-
Connecting and using data that is already being routinely collected to improve the understanding of immigrant outcomes like mobility. The Longitudinal Immigration Statistical Environment, for example, combines administrative health and education data with information from the Census and IMDB; it has been created on an ad hoc basis, but is not a regular product.
-
-
Canada could improve transparency and accountability by:
-
Publishing clear Levels Plan targets and the policy rationale behind them, avoiding ambiguity that erodes public confidence;
-
Standardizing provincial PNP reporting (format and frequency) and publishing consolidated national data showing provincial allocations, uptake rates, and the proportion of nominations drawn from Express Entry
-
Separately reporting the share of economic immigrants who are principal applicants, versus spouses and dependents.
-
The questions in this report are ultimately about navigating difficult tradeoffs.
Canada’s Levels Plan sets targets for permanent and temporary admissions, meaning there are limited spaces available — one person’s admission is effectively another’s refusal.
Admitting highly skilled newcomers can help raise economic wellbeing for the average person living in Canada; admitting newcomers with skills that are less valued in the Canadian labour market can have the opposite effect, creating competition for low-wage jobs, pulling down both average wages and economic prosperity.
In theory, Canada could rely solely on the points system to admit the economic immigrants most likely to secure well-paying jobs (and make bigger contributions to the tax base). Those high scorers, however, might all choose corporate jobs in Toronto, which would do little to address the long wait lists for family physicians in places like Prince Edward Island.
Category-based selection can help Canada address specific, urgent skills shortages. Canada might achieve the best of both worlds–category — and point-based selection — without having one undermine the other, by focusing federal selection on high prospective earners selected through the points system, and situating categories in the provincial and territorial policy domain. Provinces could work in coordination with the professional bodies and training providers they regulate to ensure newcomers are selected and supported to address regional talent shortages in rewarding careers.
Taking two-steps to permanent residency, by first gaining Canadian work or study experience, can improve newcomers’ odds of securing those successful careers. Not all temporary programs should lead to permanent residency, however. Canada could strengthen outcomes and transparency by using earnings metrics to identify which temporary pathways can work as stepping-stones and set clearer expectations about which ones do not. This would require improvements to the speed and completeness of Canada’s data collection and reporting.
Navigating these tradeoffs strategically and transparently — with clear targets and supporting logic outlined in Canada’s Levels Plan — can help restore and maintain public confidence in immigration policymaking. As can stabilizing population growth.
Growing at a steady, predictable rate allows policymakers and businesses to plan for the infrastructure, services, and supports newcomers and their families need—from healthcare and housing to transportation and education — while building public trust that immigration strengthens rather than strains Canada’s communities and economy.
Rebuilding this trust is urgent. Canada’s success in attracting world-class talent depends on restoring our reputation as a stable destination with a welcoming public and predictable pathways for newcomers to thrive. By refocusing policy trade-offs on boosting prosperity across the country with steady, skilled economic immigration, Canada can restore support for a long-term immigration strategy, where humanitarian and family reunification objectives are advanced alongside economic ones.

Download the Report
Contributors
Jackie Pichette, Policy Lead, Skills & Higher Education
Farhad Panahov, Economist
Caprice Biasoni, Design Lead
1 Refers to principal applicants admitted in 2019.
2 United Nations Department of Economic and Social Affairs, Population Division. (2024). World Population Prospects: Demographic Profiles. https://population.un.org/wpp/graphs?loc=900&type=Demographic%20Profiles&category=Line%20Charts
3 Environics Institute for Survey Research. (2026). Canadian Perspectives on Multiculturalism and Diversity. https://environicsinstitute.org/wp-content/uploads/2026/06/ENV_BD_Canadian-Perspectives-on-Multiculturalism-and-Diversity.pdf
4 Environics Institute for Survey Research. (2025). Canadian Public Opinion about Immigration and Refugees. https://environicsinstitute.org/wp-content/uploads/2025/11/ENV_FC_Canadian-public-opinion-about-immigration-and-refugees.pdf
5 McGoey, M., & Nicol, C. (2026). Demographic Implications of the 2026–2028 Immigration Levels Plan. Office of the Parliamentary Budget Officer. https://www.pbo-dpb.ca/en/publications/RP-2526-025-S–demographic-implications-2026-2028-immigration-levels-plan–implications-demographiques-plan-niveaux-immigration-2026-2028
6 McCormack, C., & Wang, W. (2024). Canada’s gross domestic product per capita: Perspectives on the return to trend. Statistics Canada. https://www150.statcan.gc.ca/n1/pub/36-28-0001/2024004/article/00001-eng.htm
7 Environics Institute for Survey Research. (2025). Canadian Public Opinion about Immigration and Refugees. https://environicsinstitute.org/wp-content/uploads/2025/11/ENV_FC_Canadian-public-opinion-about-immigration-and-refugees.pdf
8 Atique, A., & Nagari, D. (2025). Broken immigration promises are based on false narratives. The Conversation. https://theconversation.com/broken-immigration-promises-are-based-on-false-narratives-285970
9 Steele, K. (n.d.). CDN PSE dashboards: Jobs impacted.Eduvation. https://circles.eduvation.ca/posts/cdnpse-dashboards-jobs-impacted
10 Canadian Museum of Immigration at Pier 21. (n.d.). Immigration Regulations, Order-in-Council PC 1967-1616, 1967. https://pier21.ca/research/immigration-history/immigration-regulations-order-in-council-pc-1967-1616-1967
11 Immigration, Refugees and Citizenship Canada. (2026). Immigrant outcomes. https://www.canada.ca/en/immigration-refugees-citizenship/corporate/transparency/transition-binders/deputy-minister-2026/immigrant-outcomes.html
12 Immigration, Refugees and Citizenship Canada. (2025). 2024–25 Report to Parliament on Immigration. https://www.canada.ca/en/immigration-refugees-citizenship/corporate/publications-manuals/report-parliament-cbs-2024-25.html#toc-3
13 Immigration, Refugees and Citizenship Canada. (2022). Express Entry Year-End Report 2021. https://www.canada.ca/en/immigration-refugees-citizenship/corporate/publications-manuals/express-entry-year-end-report-2021.html
14 Statistics Canada. (2024). Chart 1: Share of new economic immigrants by admission program, Canada, 2000 to 2023. https://www150.statcan.gc.ca/n1/daily-quotidien/240327/cg-e001-eng.htm
15 Statistics Canada. (2025). Canada’s health workforce: Regional vacancy trends, 2024. https://www150.statcan.gc.ca/n1/daily-quotidien/251201/dq251201b-eng.htm
16 Masoud, H., Sayle, Z., & Yang, H. (2025). Regional dynamics of vacancies in health-related occupations in Canada, 2024. Statistics Canada
17 BuildForce Canada. (2026). Construction and Maintenance Looking Forward 2026–2035: Non-residential. https://www.buildforce.ca/wp-content/uploads/2026/07/Construction-Maintenance-Looking-Forward-2026-2035-non-residential.pdf
18 Employment and Social Development Canada. (n.d.). Skilled trades https://www.canada.ca/en/employment-social-development/campaigns/skilled-trades.html
19 Ibid.
20 Picot, G., Hou, F., & Crossman, E. (2024). The Provincial Nominee Program: Provincial differences. Statistics Canada. https://www150.statcan.gc.ca/n1/pub/36-28-0001/2024003/article/00003-eng.htm
21 Picot, G., Hou, F., & Crossman, E. (2023). The Provincial Nominee Program: Its expansion in Canada. Statistics Canada. https://www150.statcan.gc.ca/n1/pub/36-28-0001/2023007/article/00004-eng.htm
22 Picot, G., Crossman, E., & Hou, F. (2023). The Provincial Nominee Program: Retention in province of landing. Statistics Canada. https://www150.statcan.gc.ca/n1/pub/36-28-0001/2023011/article/00002-eng.htm
23 Stick, M., Hou, F., & Picot, G. (2026). Economic outcomes of provincial nominees: Differences between Express Entry and non-Express Entry. Statistics Canada. https://www150.statcan.gc.ca/n1/pub/36-28-0001/2026002/article/00005-eng.htm
24 Institute For Canadian Citizenship. (2025). Highly skilled immigrants twice as likely to leave Canada. https://forcitizenship.ca/article/highly-skilled-immigrants-twice-as-likely-to-leave-canada/
25 Hou, F., & Picot, G. (2024). Earnings of one-step and two-step economic immigrants: Comparisons from the arrival year. Statistics Canada. https://www150.statcan.gc.ca/n1/pub/36-28-0001/2024001/article/00006-eng.htm
26 Skuterud, M., & Chen, Z. (2018). Comparing Outcomes: The Relative Job-Market Performance of Former International Students. C.D Howe Institute. https://cdhowe.org/wp-content/uploads/2024/12/Final20Commentary_518.pdf
27 Picot, G., & Xu, L. (2020). Which immigration selection factors best predict the earnings of economic principal applicants? Immigration, Refugees and Citizenship Canada https://www.canada.ca/en/immigration-refugees-citizenship/corporate/reports-statistics/research/immigration-selection-factors-predict-earnings-economic-principal-applicants.html#conclusion
28 Miller, M. (2023). [Post on immigration selection / policy]. X. https://x.com/MarcMillerVM/status/1732901766029582407
29 Godbout, L. (2020). CERB: From Emergency to Recovery. Canadian Tax Foundation. https://www.ctf.ca/EN/EN/Newsletters/Perspectives/2020/3/200308.aspx
30 Immigration, Refugees and Citizenship Canada. (2024). International Student Program at a glance. https://www.canada.ca/en/immigration-refugees-citizenship/corporate/transparency/committees/cimm-feb-28-2024/international-student-program-at-a-glance.html
31 Immigration, Refugees and Citizenship Canada. (2024). Question Period Note: Temporary resident admissions.https://search.open.canada.ca/qpnotes/record/cic%2CIRCC-2024-QP-00031
32 Ibid.
33 Statistics Canada. (2025). The median entry wage of new immigrants decreased by 10.6% in 2023 but remained above its pre-COVID-19 pandemic level. https://www150.statcan.gc.ca/n1/daily-quotidien/251208/dq251208a-eng.htm
34 Office of the Auditor General of Canada. (2026). International Student Program Reforms. https://www.canada.ca/en/auditor-general/our-work/audit-reports/auditor-general-report-2026-international-student-program-reforms.html
35 Ministry of Business, Innovation and Employment. (n.d.). Migrant Employment Data. New Zealand Government. https://www.mbie.govt.nz/immigration-and-tourism/immigration/migration-research-and-evaluation/migrant-employment-data
36 Statistics Canada. (2026). Labour Force Survey. https://www23.statcan.gc.ca/imdb/p2SV.pl?Function=getSurvey&SDDS=3701
37 Office of the Auditor General of Canada. (2026). International Student Program Reforms: Controlled growth fell short of improving integrity. https://www.canada.ca/en/auditor-general/media-room/international-student-program-reforms-controlled-growth-fell-short-improving-integrity.html
a Janzen, N., & Zheng, A. (2026). Canada’s looming labour squeeze: The impact of retirements and immigration https://www.rbc.com/en/economics/canadian-analysis/featured-analysis/insights/canadas-looming-labour-squeeze-the-impact-of-retirements-and-immigration-policy/
b The population growth rate reflects natural population growth (births – deaths) and net migration (including arrivals and departures of permanent and non-permanent residents).
c Canadian Experience Class for those who have gained at least one year of work experience in Canada as a temporary resident; 2. Skilled Worker Program for those with work experience abroad; 3. and the Skilled Trades Program.
d This would exclude points awarded for provincial nomination.
e
f Foreign credential recognition has long been a challenge in Canada, but an approach called Practice-ready Assessment is showing promise as a new model. For example, rather than relying on a paper trail, the Physician Assessment Centre of Excellence in Halifax pressure tests skills and addresses training gaps for internationally trained doctors in a 12-week apprenticeship-style program.
g Population Data BC, Manitoba Centre for Health Policy, Institutes of Clinical Evaluation Sciences in Ontario and DataNB.
h Canada paused the Start-up Visa Program in January 2026, which granted permanent residency based on capital or local incubator support, regardless of whether the business idea proved genuine or successful. Several OECD peer countries use temporary visas to attract business founders and drive innovation.
i Statistics Canada has supplemental surveys that compliment the core LFS questionnaire. They could be used in the future to test variations of questions to before adapting the LFS questionnaire.
This article is intended as general information only and is not to be relied upon as constituting legal, financial or other professional advice. The reader is solely liable for any use of the information contained in this document and Royal Bank of Canada (“RBC”) nor any of its affiliates nor any of their respective directors, officers, employees or agents shall be held responsible for any direct or indirect damages arising from the use of this document by the reader. A professional advisor should be consulted regarding your specific situation. Information presented is believed to be factual and up-to-date but we do not guarantee its accuracy and it should not be regarded as a complete analysis of the subjects discussed. All expressions of opinion reflect the judgment of the authors as of the date of publication and are subject to change. No endorsement of any third parties or their advice, opinions, information, products or services is expressly given or implied by Royal Bank of Canada or any of its affiliates. This document may contain forward-looking statements within the meaning of certain securities laws, which are subject to RBC’s caution regarding forward-looking statements. ESG (including climate) metrics, data and other information contained on this website are or may be based on assumptions, estimates and judgements. For cautionary statements relating to the information on this website, refer to the “Caution regarding forward-looking statements” and the “Important notice regarding this document” sections in our latest climate report or sustainability report, available at: https://www.rbc.com/our-impact/sustainability-reporting/index.html. Except as required by law, none of RBC nor any of its affiliates undertake to update any information in this document.