

 EN



The Bottom Line:
Canada’s labour market conditions loosened again in October and slack persists, with employment edging lower (a third consecutive decline) and the unemployment rate rising 0.2 percentage points to 6.7%.
Weakness was concentrated in the 15 to 24 year cohort, where the unemployment rate rose sharply to 13.7%, driven by both lower employment and rising labour force participation. The unemployment rate for prime-age (24-54) workers was unchanged in comparison, steady at 5.6%.
In October, overall employment was effectively little changed from September (-4,700) with gains in public sector employment (+50,000) offset by losses in private jobs (-53,000). The growth in public sector jobs was the first in five months, and only partially retraces earlier cumulative loss of 148,000.
New U.S. tariffs implemented since August 22 have not, and are not expected to lead to widespread layoffs in Canada. They are severe but of a narrow scope. Manufacturing jobs changed little in August and September. Sectors disproportionately affected by U.S. tariffs including auto and steel manufacturers can continue to look to increasing government support to transition out of a period of reduced U.S. demand.
Looking ahead, we continue to expect there will be progress in Canada’s labour market recovery, notwithstanding softer readings in recent months.
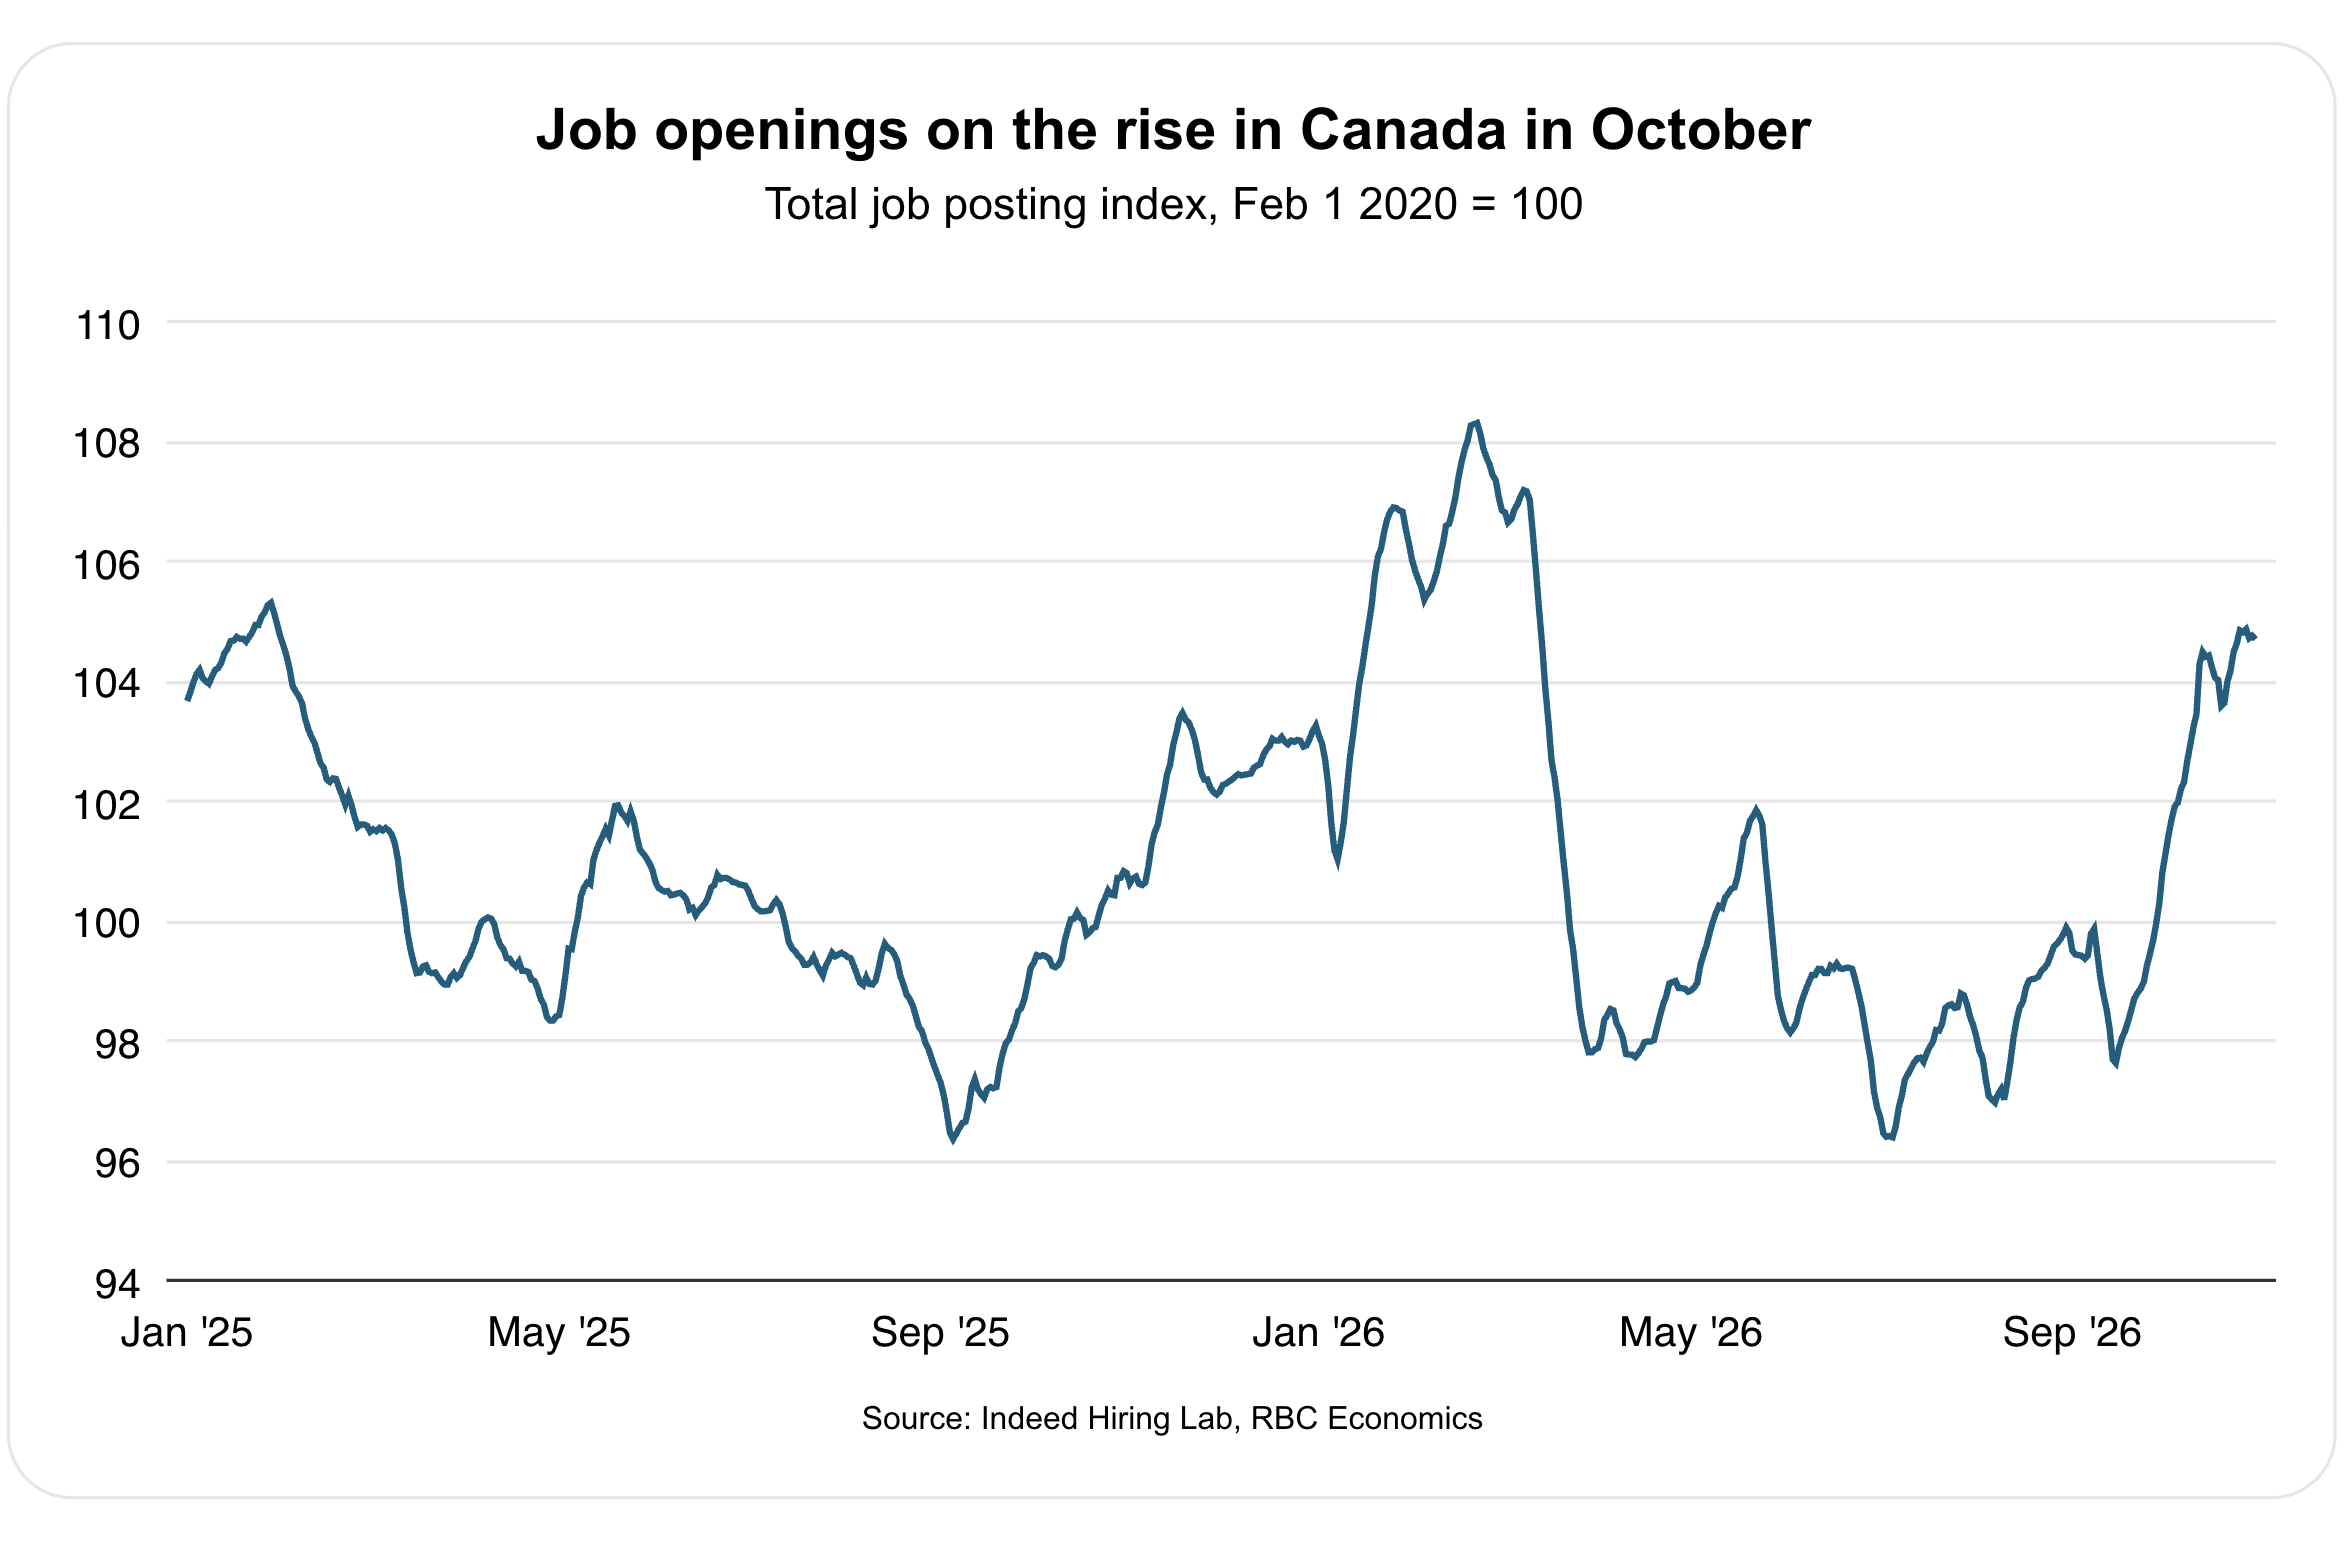
Domestic spending has held up well into the fall and job postings on Indeed.com rose significantly in October, led by an increase in mining and oil and gas postings that could potentially be tied to increased global demand for Canadian energy export as Middle East supply remains disrupted.
Our forecast expects the unemployment rate in Canada to keep edging lower, to below 6% in the second half of 2027.
The details:
Employment
-
Total: −4.7k (−0.02%) m/m; +16.5k (+0.08%) y/y.
-
Full-time: −18.1k (−0.10%) m/m, +39.0k (+0.23%) y/y.
-
Part-time: +13.4k (+0.35%) m/m, −22.5k (−0.58%) y/y.
-
Self-employed: −1.8k m/m, +51.5k (+1.92%) y/y.
-
Men: −19.9k m/m, −55.2k y/y. Women: +4.9k m/m, +63.4k y/y.
Public vs. private
-
Public sector: +49.6k (+1.12%) m/m, but −69.7k (−1.53%) y/y.
-
Private sector: −52.5k (−0.38%) m/m, +34.8k (+0.25%) y/y.
Industry
-
Goods-producing: +20.6k. Services-producing: −25.3k.
-
Gains: construction +15.6k, educational services +15.0k, health care and social assistance +14.1k, agriculture +4.8k, manufacturing +3.8k.
-
Declines: wholesale and retail trade −28.8k, transportation and warehousing −10.1k, professional, scientific and technical −4.8k, finance, insurance and real estate −3.5k, utilities −2.6k.
Unemployment and participation
-
Unemployment rate: 6.7% (+0.2 pt m/m, −0.2 pt y/y).
-
Participation: 64.8% (0.0 m/m, −0.4 pt y/y).
-
Youth (15–24): unemployment 13.7% (+0.7 pt m/m, −0.3 pt y/y); participation 62.6% (+0.3 pt m/m).
-
Core-age (25–54): unemployment 5.6% (unchanged m/m, −0.2 pt y/y); participation 88.5% (unchanged).
Provinces
-
Provinces, rising m/m: Alberta 7.3% (+0.9), Saskatchewan 5.9% (+0.5), Ontario 7.3% (+0.3), PEI 7.4% (+0.1).
-
Provinces, falling m/m: Newfoundland and Labrador 8.7% (−0.4), Quebec 5.7% (−0.3), Nova Scotia 6.2% (−0.1), British Columbia 6.3% (−0.1).
-
Provinces, unchanged m/m: New Brunswick 7.4% and Manitoba 5.0%.
R8 unemployment rate
-
R8 is 8.98% (+0.12 pt m/m, −0.12 pt y/y).
-
The gap to the official rate is about 2.3 points, not significantly different from recent months, so there is no sign of a notable rise in discouraged workers.
Hours and wages
-
Hours worked: +0.34% m/m, +0.55% y/y.
-
Average hourly wage, all employees: +0.66% m/m, +2.24% y/y down from 2.34% in September.
-
Permanent employees: +0.62% m/m, +2.04% y/y.
About the author:
Claire Fan is a Senior Economist at RBC. She focuses on macroeconomic analysis and is responsible for projecting key indicators including GDP, employment and inflation for Canada and the US.
This article is intended as general information only and is not to be relied upon as constituting legal, financial or other professional advice. The reader is solely liable for any use of the information contained in this document and Royal Bank of Canada (“RBC”) nor any of its affiliates nor any of their respective directors, officers, employees or agents shall be held responsible for any direct or indirect damages arising from the use of this document by the reader. A professional advisor should be consulted regarding your specific situation. Information presented is believed to be factual and up-to-date but we do not guarantee its accuracy and it should not be regarded as a complete analysis of the subjects discussed. All expressions of opinion reflect the judgment of the authors as of the date of publication and are subject to change. No endorsement of any third parties or their advice, opinions, information, products or services is expressly given or implied by Royal Bank of Canada or any of its affiliates.
This document may contain forward-looking statements within the meaning of certain securities laws, which are subject to RBC’s caution regarding forward-looking statements. ESG (including climate) metrics, data and other information contained on this website are or may be based on assumptions, estimates and judgements. For cautionary statements relating to the information on this website, refer to the “Caution regarding forward-looking statements” and the “Important notice regarding this document” sections in our latest climate report or sustainability report, available at: https://www.rbc.com/community-social-impact/reporting-performance/index.html. Except as required by law, none of RBC nor any of its affiliates undertake to update any information in this document.

