

 EN
EN 



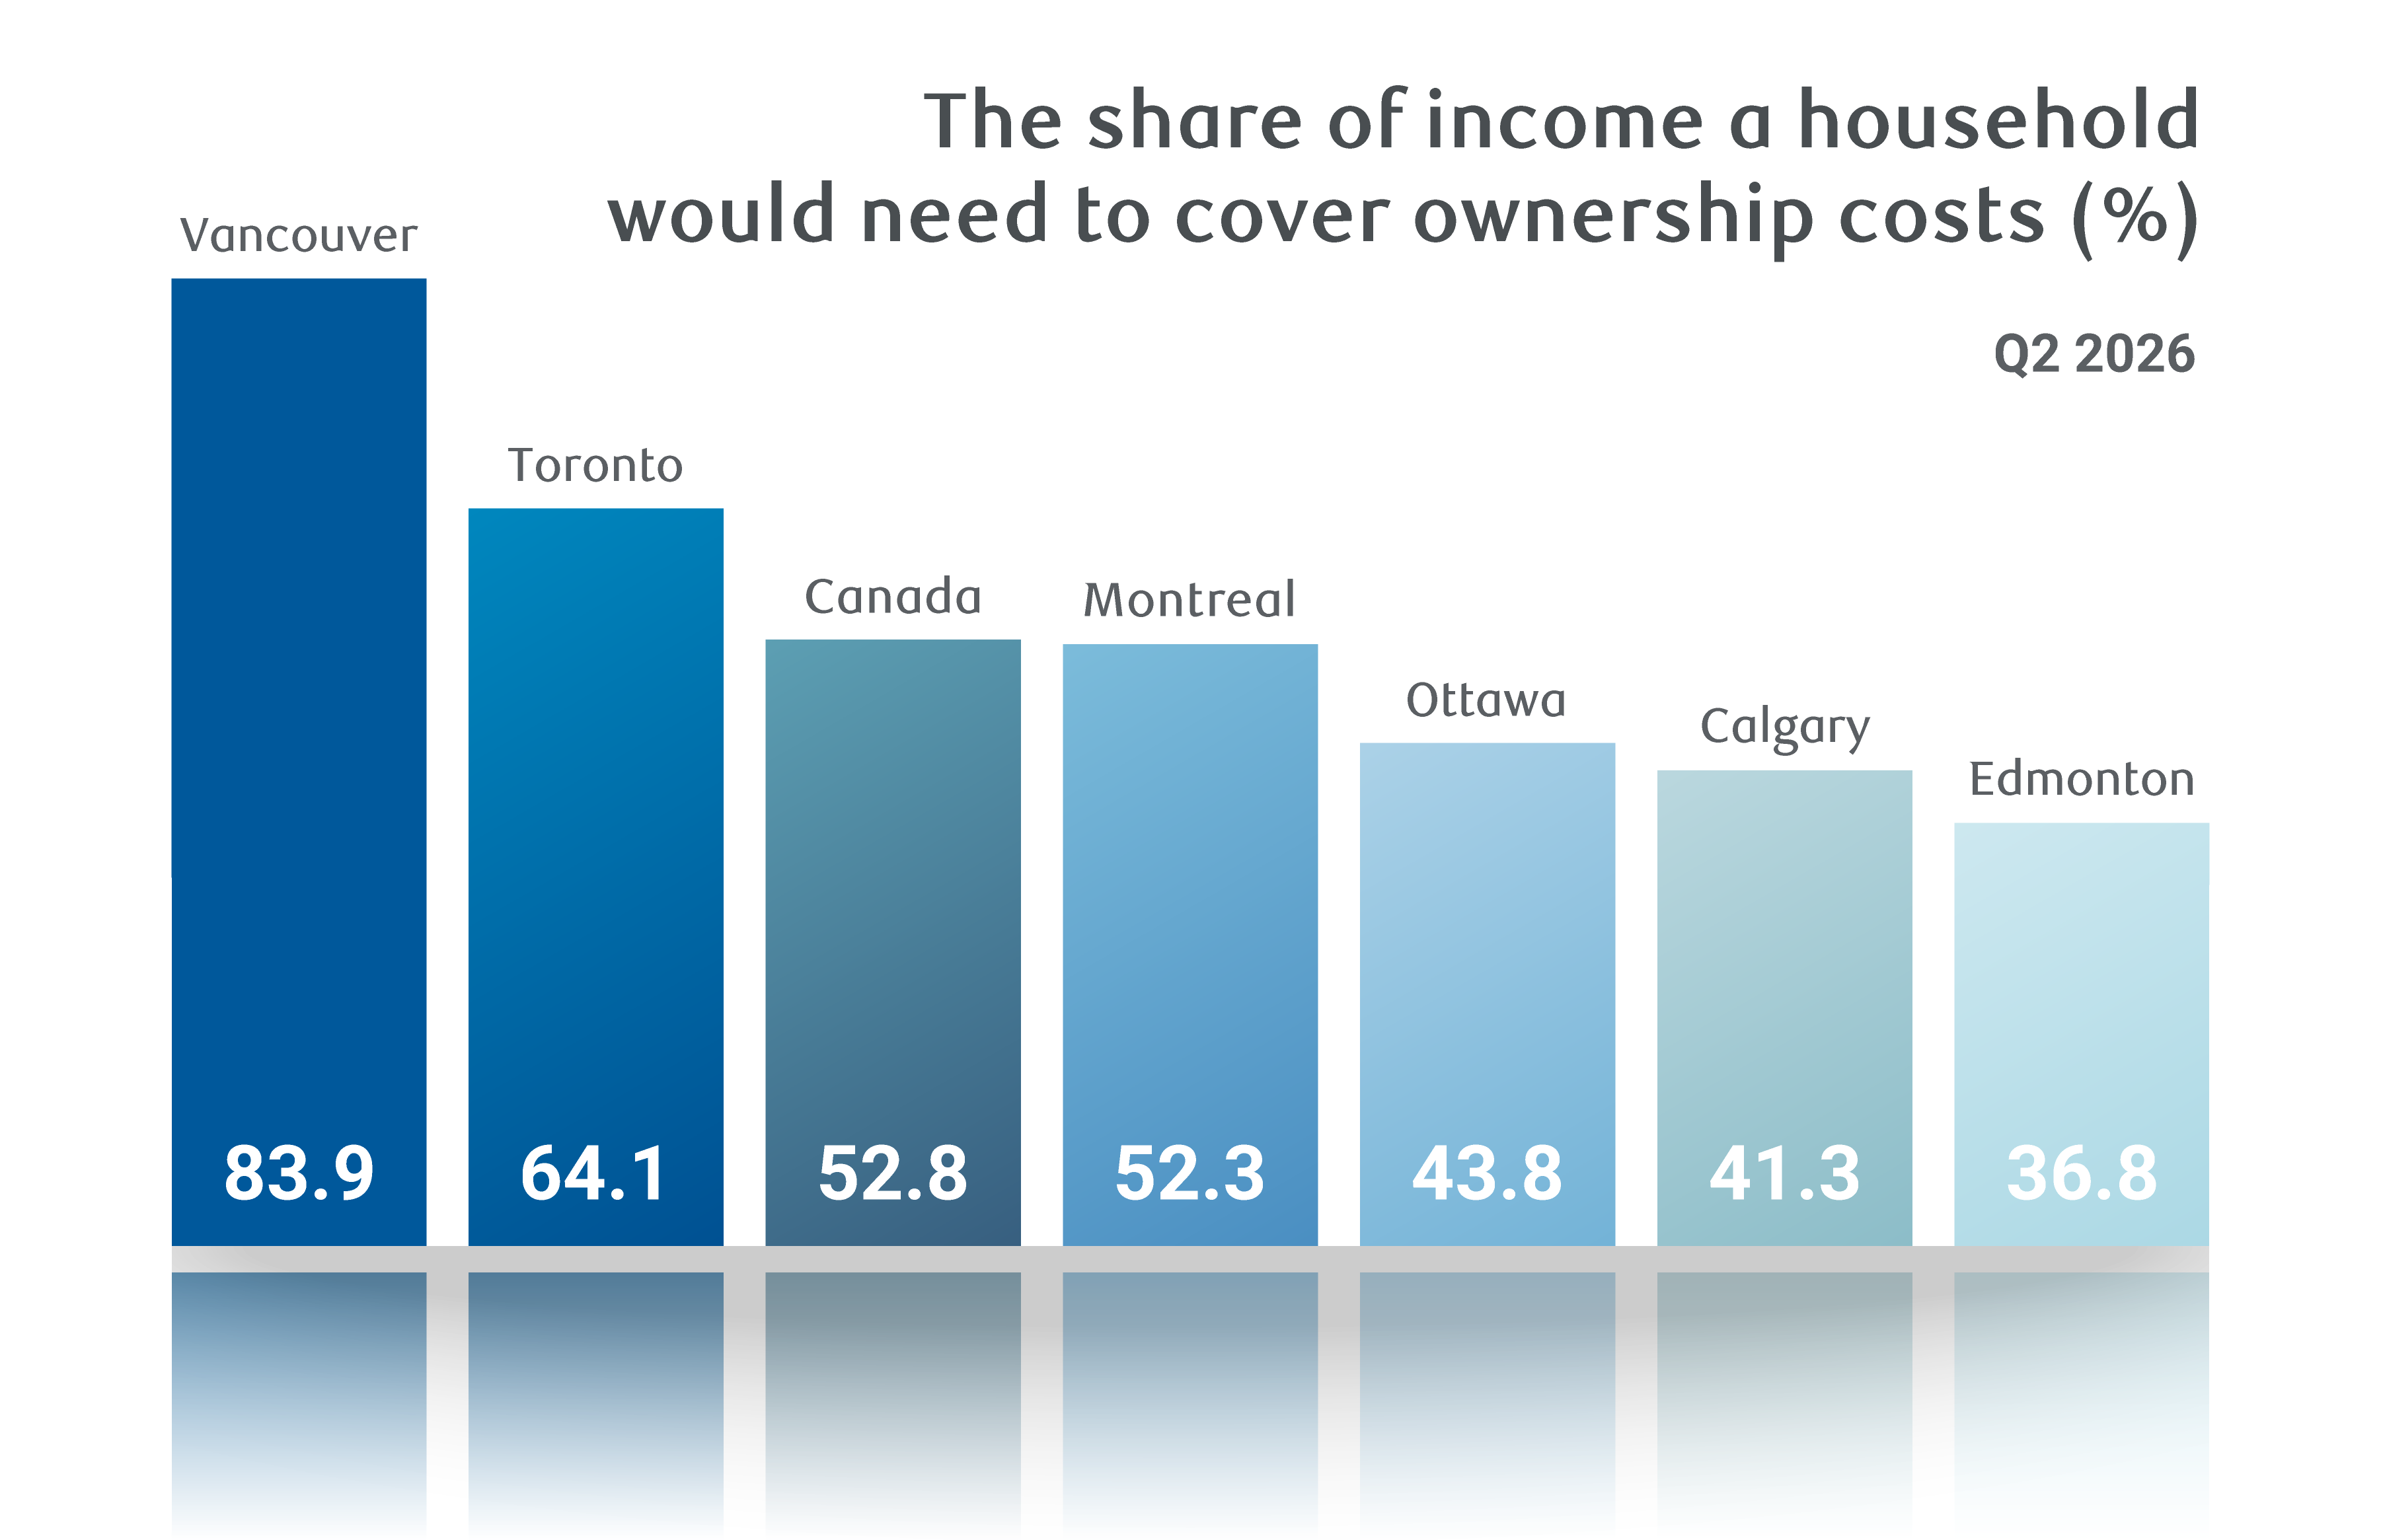
RBC’s national housing affordability measure in Canada was little changed in Q2 (52.8%), posting its smallest improvement of 0.4 percentage point in almost a year.

Ownership costs remained largely stable as a share of household income in most markets with Vancouver and Toronto still seeing more notable declines. Though modest, several Prairie and Atlantic markets saw their first increases in several quarters.

Rising income boosted affordability nationwide as home prices stabilized from the prior quarter, and interest rates remained largely unchanged.

Upward pressure on long-term interest rates and likelihood of Bank of Canada hikes next year could put ownership costs on the rise again after dropping significantly since 2024.
Growing income driving slight affordability gain
Rising household income accounted for the entire affordability gain in Canada in Q2 as home prices and rates held fairly steady.
This was true in most regions, reflecting firmer wage growth and government transfers—including the Canada Groceries and Essentials Benefit distributed in June with a one-time top up.
Exceptions included markets in British Columbia where a softening labour market weighed on worker pay—preventing the affordability boost of still-falling prices from being fully realized.
Strong income gains in Quebec and parts of Atlantic Canada came short of offsetting mounting costs associated with of solid appreciation in property values.
Improvement cycle nearing an end
National home prices stabilized in Q2 from Q1—breaking from steady declines that produced substantial affordability improvement since summer 2025.
A flatter trend could be sustained if recent levelling of home values in Ontario persists.
Meanwhile, rising bond yields mark a turn for the worse for ownership costs with higher fixed mortgage rates increasing interest payments, while expected BoC hikes could do the same for variable rate mortgages next year.
Spiking energy costs will exacerbate matters by raising utility bills.
We see these factors triggering a modest loss of affordability as 2027 rolls in.
Victoria: Door remains open to easing ownership costs
Buying a home is slowly becoming more affordable in Victoria, though it’s still a huge stretch for most prospective buyers. At 63.3%, RBC’s aggregate affordability measure for Victoria was the third worst among tracked markets in Q2 despite easing steadily since 2024.
It’s no surprise then that the market recovery has been a tough slog. Rising home resales have only recently climbed above a year ago. And, prices aren’t budging much, if at all. Sustained competition between sellers and a softening labour market are poised to contain any appreciation near term—keeping the door open to further mild easing in ownership costs.
Vancouver area: Significant yet only partial relief
Ten consecutive declines in RBC’s aggregate measures have rolled back more than half the spike early in the pandemic for the Vancouver area, providing significant yet only partial relief to would-be buyers.
The latest improvement—a drop of 1 percentage point in Q2 from Q1—was the second largest among tracked markets. Nonetheless, Vancouver still holds the crown for Canada’s least affordable market with an outsized measure of 83.9%. The significant strain it poses to buyers are a key factor behind the continuing market slump.
Home resales are down more than 6% this year, and prices are off 3% to 7% from a year ago depending on the category. We expect home values will continue slide near term amid slumping demand and abundant inventory.
Calgary: Stable all-round
Very little has changed this year in Calgary. Ownership costs eased very modestly as a share of household income—down 0.4 ppt to 41.3% in Q2, close to the long-term average of 39.7%.
Resales have levelled off at some 10% below a year ago, but are still 25% above before the pandemic. Home values have also largely stabilized after drifting lower in 2025. Alberta’s vibrant economy, strong labour market and sustained population growth maintain solid housing demand. Increased inventory keeps supply in balance, while containing upward price pressure. We expect broad stability to persist through year end.
Edmonton: Some strains but still a robust picture
The situation remains somewhat strained for Edmonton buyers as comparatively less progress has been achieved in re-establishing more affordability.
RBC’s aggregate measure (36.8%) barely moved in the past year, edging only 0.3 ppt lower since Q2 2025. A continuing gap with the long-term average (32.8%) suggests some buyers face hurdles entering the market, which could be holding back activity.
Home resales are down almost 13% year to date. Then again, the slowdown could reflect unsustainably strong levels a year ago. Recent transactions were still nearly 40% stronger than before the pandemic. The market’s vigour coupled with modest inventory keep home values relatively firm.
Saskatoon: Generally positive backdrop sustains market vigour
Owning a home became slightly less affordable in Q2 in Saskatoon, but ownership costs still unlikely pose a major obstacle for most buyers.
RBC’s aggregate measure (33.2%) isn’t much out of line with the 30.9% long-term average, and compares favourably to the majority of tracked markets. This positive backdrop continues to sustain some degree of vigour. Transactions have picked up since spring, recently exceeding the level before the pandemic by more than 40%.
The trade war with the U.S. has largely spared Saskatchewan’s economy, helping to maintain confidence. And, home values continue to appreciate at a solid clip with relatively tight supply.
Regina: Ownership bar within historical norms
Affordability in Regina compares even more favourably, still the best among all tracked markets despite worsening marginally in Q2.
The aggregate measure (27.9%) is nearly on par with its long-run average (27%), suggesting the bar to own a home is within historical norms. Earlier robust resales have softened this year, but this may be more attributable to fewer homes up for sale than any notable erosion in sentiment. Supply and demand remain historically tight, which keeps prices on an ascending trajectory.
Winnipeg: Lack of affordability relief weighs on activity
Winnipeg also saw a slight loss of affordability in Q2, reversing a similar-sized improvement in Q1.
RBC’s aggregate measure (33.8%) has been range bound since late-2023 near a decades-high. The lack of relief mainly reflects steady home value appreciation supported by tight supply. But, elevated costs could be taking a toll. Transactions fell 7% over the first eight months of this year, dipping slightly below the pre-pandemic mark. We think a deeper pullback in demand would be required to knock down prices, and drive a more meaningful improvement in affordability.
Toronto area: Affordability gains taper on stabilizing home prices
Toronto’s affordability aggregate measure continues to improve faster than most, declining 1.2 ppts to 64.1% across all housing types. Income growth has been the primary driver, but with home prices showing early signs of stabilizing, quarterly improvement was the smallest since the recovery began in Q1 2024.
The condo segment continues to show most relief, reaching its most favourable level since 2017, and remains in closer reach than Montreal for a second consecutive quarter—a shift unseen in 16 years.
The aggregate measure still puts affordability in Toronto at second worst in the country (well ahead of Montreal), inching within a percentage point of Victoria, opening the door to a ranking shift for the first time since 2011.
Ottawa: Strengthening home values halts affordability gains
Ottawa’s aggregate measure remained anchored at 43.8% in Q2 as home price appreciation offset income growth. Prices rose modestly for single and semi-detached homes—comprising of the bulk of the market—but continued price declines in condos kept the aggregate measure flat. We expect affordability improvement is at or drawing very near to a close in Ottawa, particularly for single and semi-detached housing.
An uneven housing market recovery, however, may offer pockets of affordability relief in some quarters. Though, the underlying trend is tilting toward gradual deterioration now that the rate increases loom.
Montreal area: Affordability pressures beginning to take a toll
Montreal’s price resilience is meeting resistance. Elevated property values have kept affordability near historical lows with the aggregate measure barely improving to 52.3% in Q2.
It’s one of the few markets we track where both condo and single-detached affordability are still materially worse than before the pandemic. Condos also remained less affordable than Toronto in Q2—a shift that became apparent earlier this year for the first time since 2010.
That said, some relief may be on the way. High prices are sapping buyer appetite and with inventory finally loosening, price momentum is starting to ease. This should allow affordability to gradually improve.
Quebec City: Both resilient and strained
Recent years’ long strong market resilience has strained affordability in Quebec City. It’s one of only two markets we monitor where ownership costs are higher today than in 2023 as a share of household income. In fact, RBC’s aggregate measure (40.1%) has been worse on only three other occasions since 1985.
Any increased tensions have yet to slow down buyers, however. Home resales are up almost 2% so far this year compared to the same period in 2025.
Higher prices have attracted more sellers. New listings surged 24%, helping to ease market tightness.
Such influx, if sustained, will temper home value appreciation, and possibly pave the way for modest affordability relief ahead.
Saint John: Affordability in a holding pattern
Ownership costs have been mostly in a holding pattern since 2022 in Saint John—easing only incrementally from quarter to quarter as a share of household income on average.
RBC’s aggregate affordability measure crept up to 32.1% in Q2 from 31.9% in Q1. This marks the longest stretch it’s remained above the long-run average (25.8%), suggesting some buyers may feel constrained.
Indeed, it could be a factor behind the 5% drop in home resales year-to-date, alongside the sting of the trade war.
Odds are affordability may not improve quickly either. Saint John’s remains in a deep sellers’ market, likely to keep price gains firm near term.
That said, Saint John remains Canada’s third most affordable market.
Halifax: Bucking its improving trend
Prospective buyers in Halifax hoping to get further meaningful affordability relief were no doubt disappointed in Q2. RBC’s aggregate measure edged up 0.1 ppt to 42.1%, pausing a trend of nearly uninterrupted declines since 2024.
Developments were mixed among property types. Ownership cost burdens for single-detached homes, which had improved steadily since late 2023, ticked up for the first time while for condos, it continued to decline—down 0.5 ppt from Q1.
Despite the recent string of improvement, Halifax’s condo affordability measure is still 7.8 ppts higher from before pandemic—the largest deterioration for condos among the markets we track.
Sellers maintain the upper hand, but waning buyer interest could tip the scale, creating scope for price relief.
St. John’s: Ownership costs weighing on resales
St. John’s saw the largest affordability deterioration of the markets we track in Q2. The aggregate measure rose by a full percentage point from Q1 to 30.6%, reigniting erosion after stabilizing in 2024 into the first half of 2025.
Sellers are generally in the driver’s seat across Atlantic Canada, and St. John’s is no exception. But, the tide could be turning. Home resales are down 7% year-to-date with stretched affordability likely contributing to weakening activity.
Affordability headwinds are at risk of intensifying as well. Rising utility costs driven by elevated global energy prices will hit Atlantic Canada particularly hard, and weigh on household budgets heading into colder months. Additional BoC rate hikes are also expected this winter, keeping budgets stretched.
Still, it remains among Canada’s most affordable markets.
About the authors:
Robert Hogue is the Assistant Chief Economist responsible for providing analysis and forecasts on the Canadian housing market and provincial economies.
Rachel Battaglia is an economist at RBC, providing forecasts for the Canadian provincial economies and analyzing key trends in housing and consumer spending.
This article is intended as general information only and is not to be relied upon as constituting legal, financial or other professional advice. The reader is solely liable for any use of the information contained in this document and Royal Bank of Canada (“RBC”) nor any of its affiliates nor any of their respective directors, officers, employees or agents shall be held responsible for any direct or indirect damages arising from the use of this document by the reader. A professional advisor should be consulted regarding your specific situation. Information presented is believed to be factual and up-to-date but we do not guarantee its accuracy and it should not be regarded as a complete analysis of the subjects discussed. All expressions of opinion reflect the judgment of the authors as of the date of publication and are subject to change. No endorsement of any third parties or their advice, opinions, information, products or services is expressly given or implied by Royal Bank of Canada or any of its affiliates.
This document may contain forward-looking statements within the meaning of certain securities laws, which are subject to RBC’s caution regarding forward-looking statements. ESG (including climate) metrics, data and other information contained on this website are or may be based on assumptions, estimates and judgements. For cautionary statements relating to the information on this website, refer to the “Caution regarding forward-looking statements” and the “Important notice regarding this document” sections in our latest climate report or sustainability report, available at: https://www.rbc.com/community-social-impact/reporting-performance/index.html. Except as required by law, none of RBC nor any of its affiliates undertake to update any information in this document.

