

 EN



RBC Canadian cardholder spending continued to grow in Q3, but at a more measured pace after an unusually large gain in Q2. We see that deceleration as normalization, rather than underlying weakness in household demand.
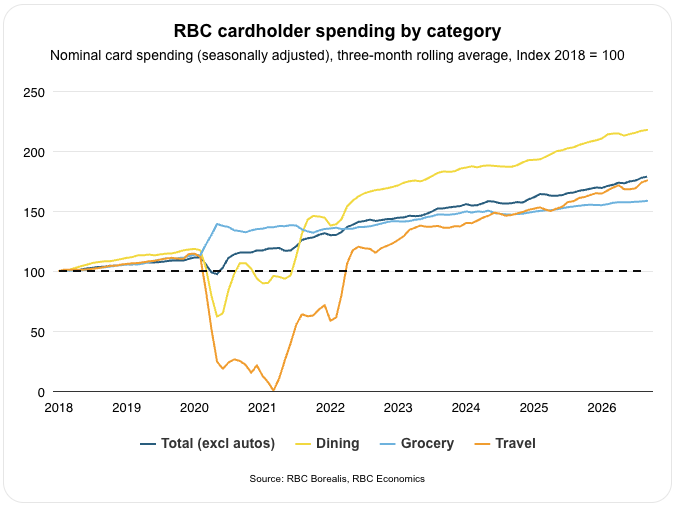
Total spending rose 1% quarter-over-quarter seasonally adjusted alongside a 1.4% gain in core retail sales—both in line with the longer-term trend.
Part of the slowdown came from a pause in accelerating energy costs with gasoline bills remaining high in Q3, but not rising further after a surge in Q2.
Another escalation in the Canada-U.S. trade war and softer income growth after Q2’s exceptional gains likely contributed to the moderation as well.
Still, consumer spending remains broadly resilient. We expect that to continue as job prospects improve and population growth increases modestly, offsetting the drag from higher interest rates.
These three developments stood out to us from RBC cardholder transactions and other metrics we monitor:
-
Spending tied to big purchases picked up, suggesting households are regaining confidence to make larger financial commitments.
-
Growth was strongest in the Prairies and parts of Atlantic Canada mirroring the regional divergence in real gross domestic product and population growth.
-
Financial stress is intensifying—particularly in Ontario and British Columbia where debt burdens are heaviest—though vulnerabilities remain relatively contained elsewhere.
1. Spending tied to big purchases bounces back
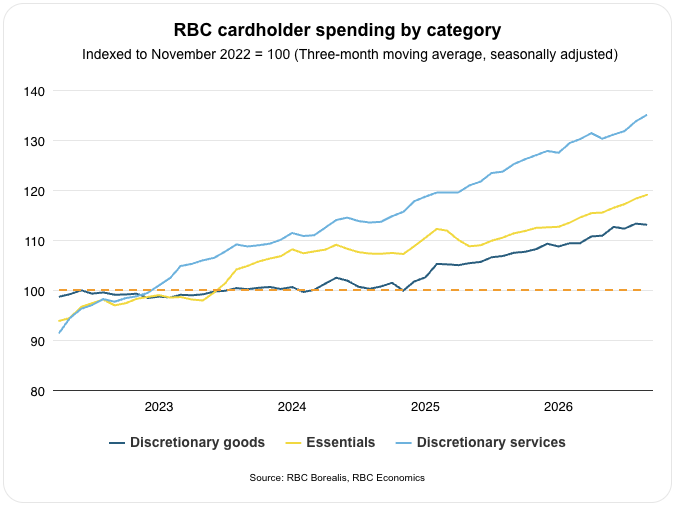
We see early signs of rebuilding confidence as spending on goods and services tied to big-ticket purchases turn a corner.
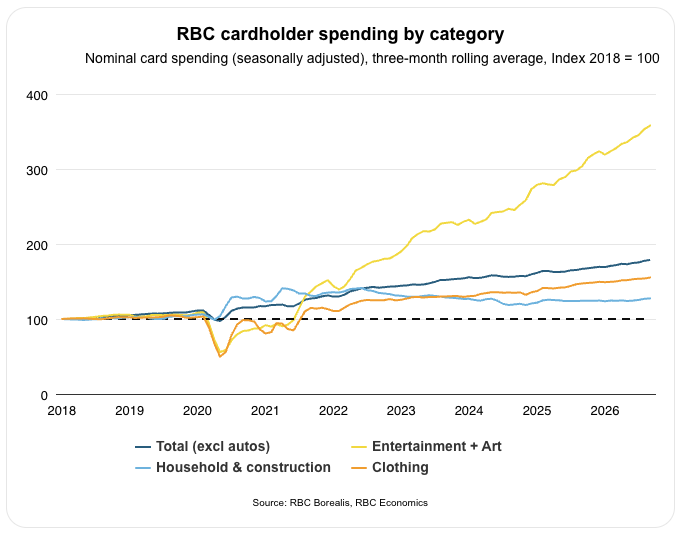
Real estate services—like property management fees, listing services, staging and inspections—stood out with spending surging 7.3% q/q seasonally adjusted alongside notable gains in household and construction goods. The momentum tracks a modest pickup in home resales seen in Q3, and marks a shift from sluggish spending across these categories in recent quarters.
Purchases related to vehicles—including maintenance and repairs—didn’t show the same strength, but stabilized around Q2 highs, a partial win given the backdrop. Statistics Canada data corroborates this stability through sustained car sales in early Q3.
Other discretionary services remained supportive as well with entertainment and art spending climbing 4.2% as the remainder of summer festivities—like FIFA and Calgary Stampede—played out.
Purchases at gas stations still eat up a larger-than-normal share of total card spending, but the increase has not yet been large enough to cause broader household spending trends to falter.
2. Consumer spending splits across clear fault lines
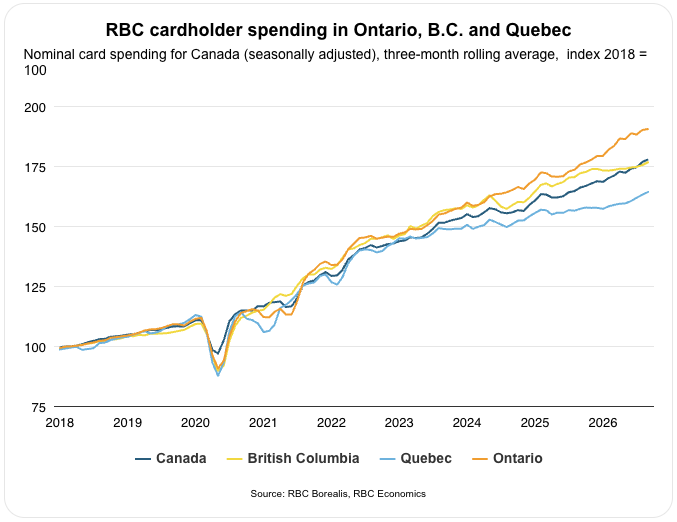
Spending in B.C., Ontario, and Quebec—the three slowest growing provinces by real GDP and population—decelerated sharply in Q3 amid intensifying trade and demographic headwinds.
Spending in B.C. contracted outright with a 0.4% q/q decline that worsens once adjusted for inflation. It coincides with an increase in the lowest personal income tax rate (effective July 1), which reduced take-home pay. The higher prorated rate will apply to the remainder of the year.
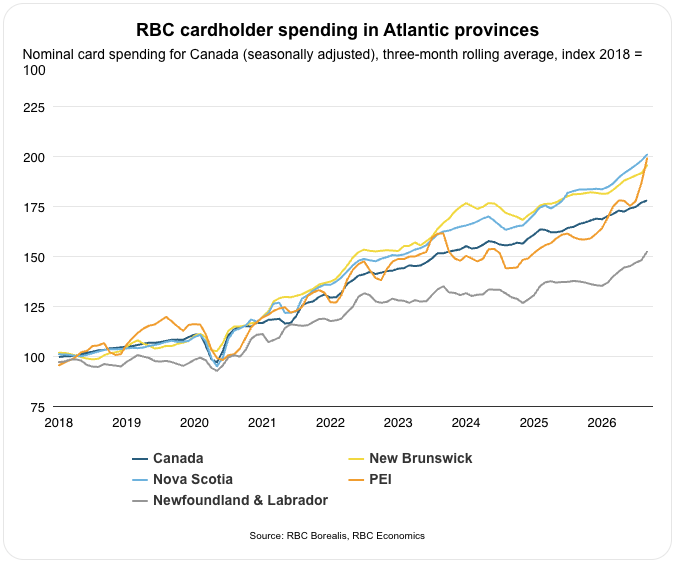
Spending also cooled across most of Atlantic Canada. Newfoundland and Labrador saw a similar mid-year tax increase that’s been cutting into disposable incomes since mid-summer, though growth remains strong compared to other provinces. In New Brunswick and Nova Scotia, where fuel makes up a larger share of household budgets, the leveling-off of gas prices appears to have had a bigger impact.
But, the story flips dramatically in faster-growing provinces with stronger demographics. Prince Edward Island led the pack with spending more than doubling to 5.2% q/q. Half came from travel coinciding with Canada’s Premiers Meeting in Charlottetown and the Canada Strong Pass launch, a federal initiative to boost domestic tourism. The Island Essentials Benefit, introduced in July, added to the gains by replacing the sales tax credit with larger household transfers to help with the higher cost of living. Higher prices also contributed to that growth, as inflation in P.E.I. runs nearly double the national average.
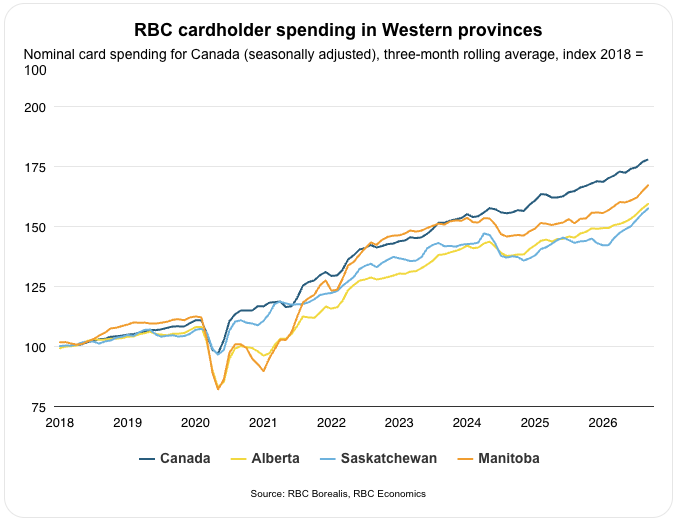
Alberta, Saskatchewan, and Manitoba remain near Q2’s pace at 3%, 2.9%, and 2.5% respectively—the second, third and fourth fastest for growth.
3. Intensifying financial stress on the radar
We’re monitoring other indicators outside of RBC cardholder data to assess growing pressure households face.
In Q3, Canadians likely devoted a larger share of disposable income to debt payments as higher bond yields pushed fixed mortgage rates slightly higher, while disposable incomes likely eased after one-time government transfers in Q2.
Bank of Canada data shows strain in loan delinquencies with a growing share of outstanding debt not paid back on time. Delinquency rates are rising fastest on instalment loans—like personal, student, and payday loans—but have also been edging higher for autos and credit cards.
This explains why spending can look steady on the surface while households’ capacity to sustain it weakens. Given the expected rise in the debt service ratio, delinquencies on these loans most likely increased further into Q3.
Mortgage holders are showing similar strain. The share of mortgages behind on payments remains historically low, but continues climbing. Data from the Canadian Bankers Association shows stress particularly in Ontario and B.C.—where household debt burdens are heaviest.
Ontario’s mortgage arrears rate reached a 15-year high in August as heavily leveraged borrowers contend with a sluggish resale market. This leaves borrowers under financial pressure to carry mortgage payments for longer while they wait for a buyer, increasing the risk of falling behind on payments or defaulting.
That said, delinquency rates remain a safe distance from historical peaks nationally. While additional stress may emerge, most of the ultra-low pandemic-era fixed-rate mortgages have now renewed, limiting the pool facing imminent payment shocks. This, along with further gradual improvement in labour markets, should mitigate the rise in the coming quarters—keeping the mortgage delinquency rate within manageable levels in most places.
About the authors:
Rachel Battaglia is an economist at RBC, providing forecasts for the Canadian provincial economies and analyzing key trends in housing and consumer spending.
Abbey Xu is an economist at RBC. She is a member of the macroeconomic analysis group, focusing on macroeconomic forecasting models and providing timely analysis and updates on economic trends.
By Carrie Freestone
RBC’s consumer spending tracking report uses RBC Data & Analytics’ proprietary database of anonymized card transactions by Canadian clients. The data are an accounting of merchant transactions that are divided into various spending categories covering tens of millions of weekly card transactions worth billions of dollars each week. Transactions, both in person and online, are classified into 11 broad spending groups: Dining, Education, Finances, Groceries, Health, Household, Shopping, Transport, Travel, Utilities, and Other. Within each group, the data are further classified: for example, shopping covers merchants classified as clothing stores, hobby shops, electronics stores, and jewelers, among others. We exclude purely financial transactions such as cash advances and insurance from spending.
We examined changes in the value of all transactions in these areas using a 7 day rolling sample starting January 1st of each year that is indexed to pre-covid levels which are calculated as the average spending for the month of February 2020. To examine the impact of seasonal factors, we also show each’s year spending profile which depicts monthly trends in spending. Online spending volumes are estimated based on the presence of an RBC card at the time of the authorization.
Protecting your privacy and safeguarding your personal information is a cornerstone of our organizational ethics and values and will always be one of our highest priorities. The underlying data for this analysis was aggregated based on transaction date, region and merchant category, and cannot be used to identify any individual client or merchant. For additional information please visit www.rbc.com/privacy.
This article is intended as general information only and is not to be relied upon as constituting legal, financial or other professional advice. The reader is solely liable for any use of the information contained in this document and Royal Bank of Canada (“RBC”) nor any of its affiliates nor any of their respective directors, officers, employees or agents shall be held responsible for any direct or indirect damages arising from the use of this document by the reader. A professional advisor should be consulted regarding your specific situation. Information presented is believed to be factual and up-to-date but we do not guarantee its accuracy and it should not be regarded as a complete analysis of the subjects discussed. All expressions of opinion reflect the judgment of the authors as of the date of publication and are subject to change. No endorsement of any third parties or their advice, opinions, information, products or services is expressly given or implied by Royal Bank of Canada or any of its affiliates.
This document may contain forward-looking statements within the meaning of certain securities laws, which are subject to RBC’s caution regarding forward-looking statements. ESG (including climate) metrics, data and other information contained on this website are or may be based on assumptions, estimates and judgements. For cautionary statements relating to the information on this website, refer to the “Caution regarding forward-looking statements” and the “Important notice regarding this document” sections in our latest climate report or sustainability report, available at: https://www.rbc.com/community-social-impact/reporting-performance/index.html. Except as required by law, none of RBC nor any of its affiliates undertake to update any information in this document.

