

 EN



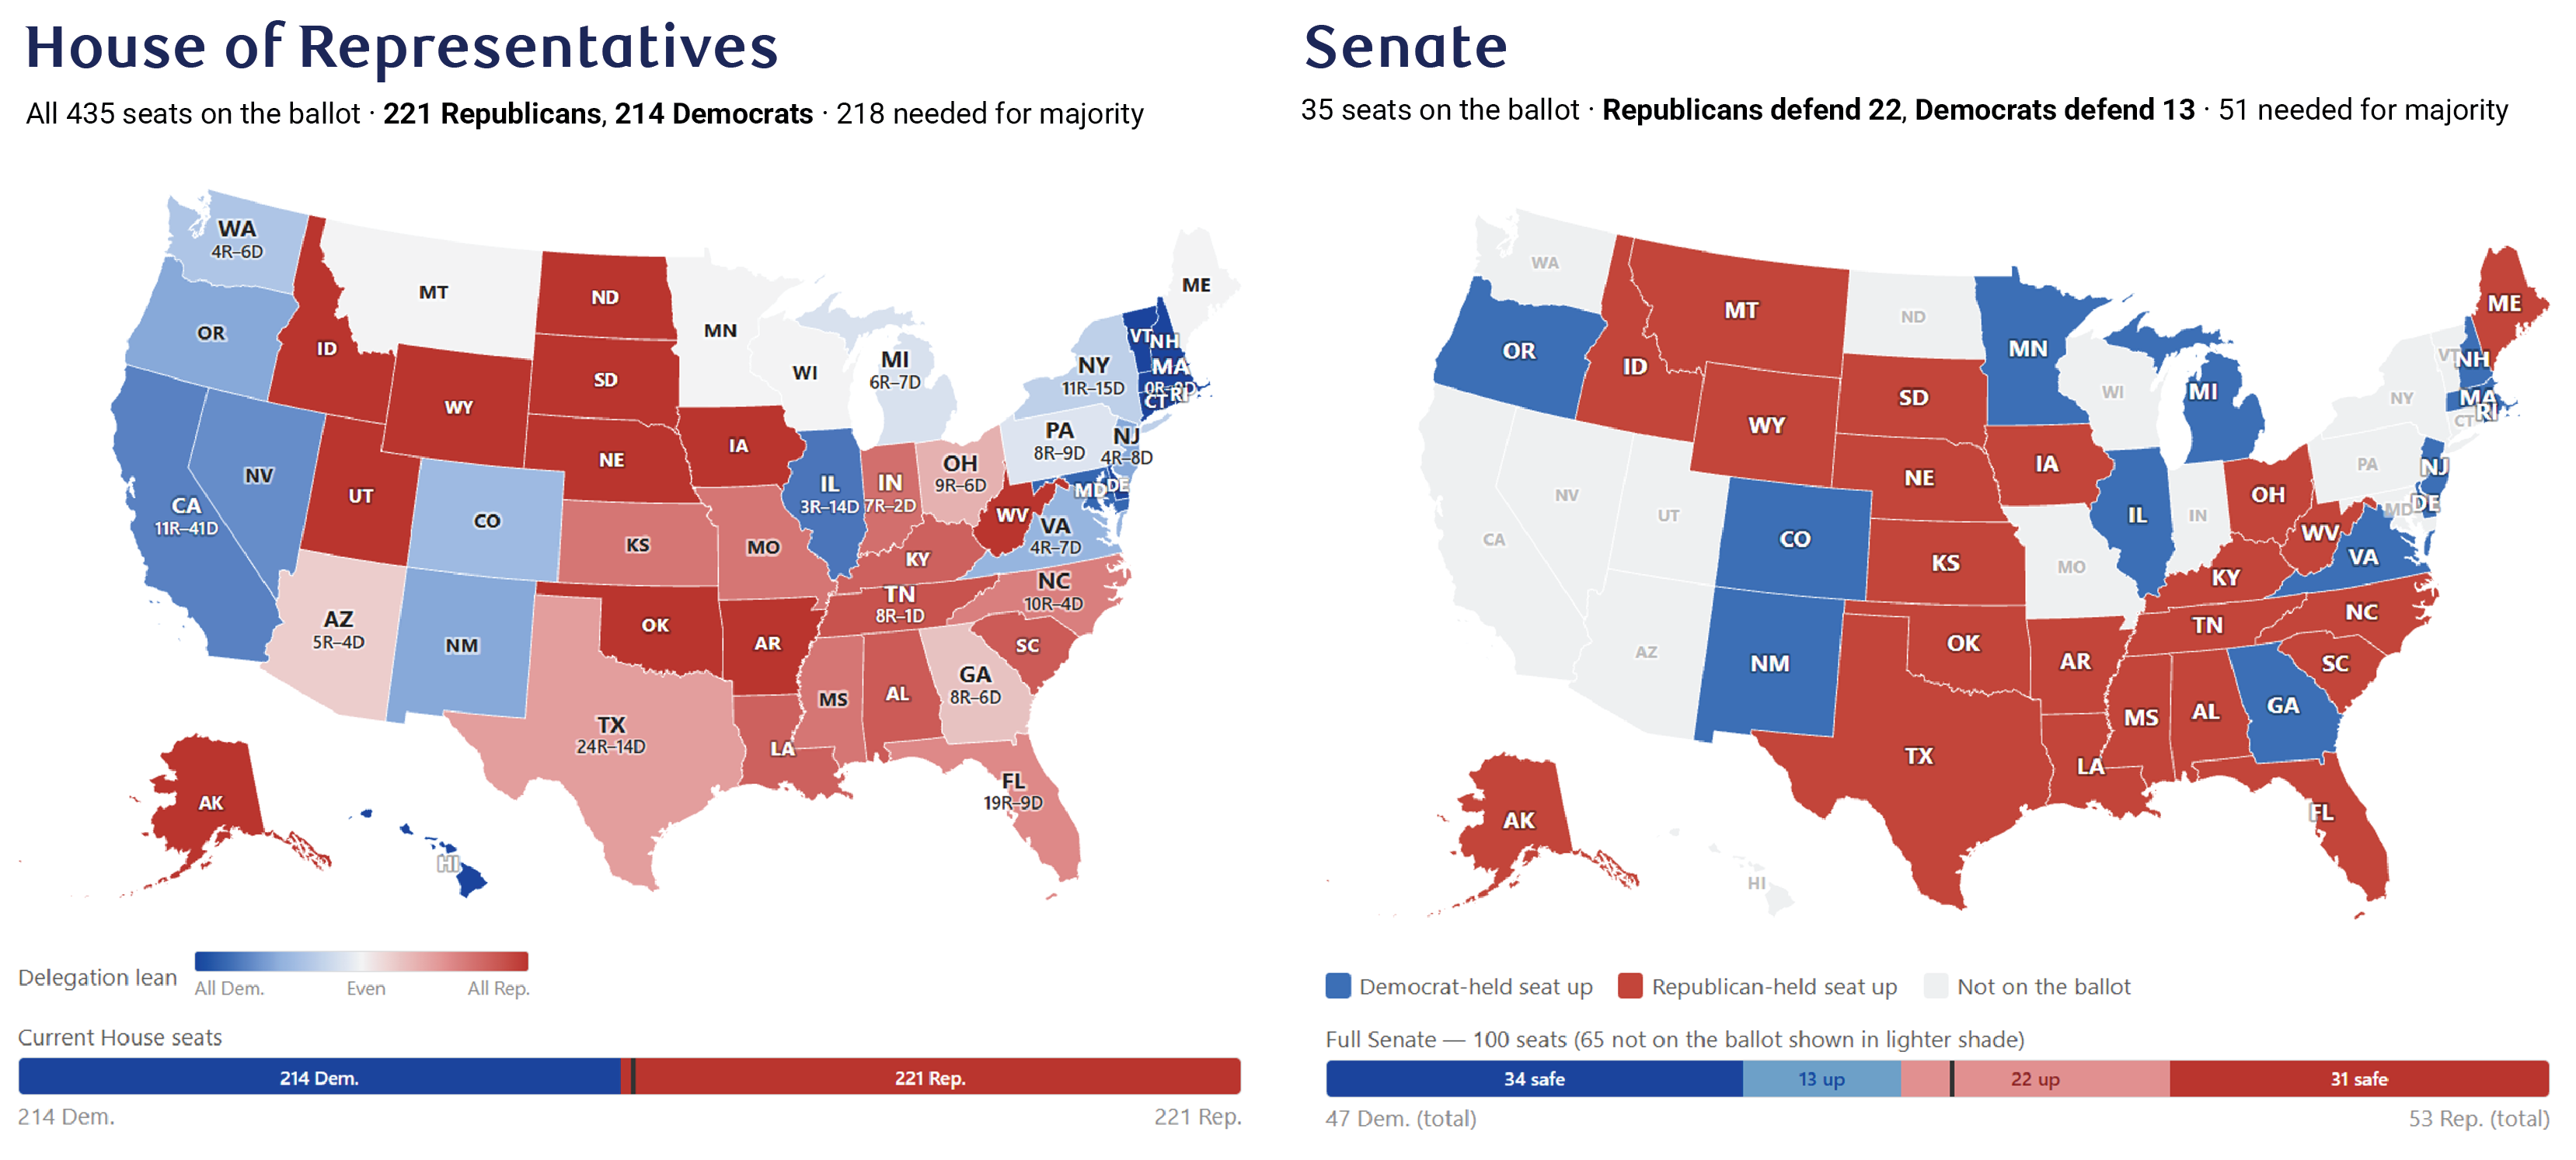
US economic growth remains resilient in the face of tariffs, energy shocks, and lingering uncertainty, but consumers’ confidence is not reflecting the economic data.
Sticky inflation and slowing wage growth are top of mind for voters ahead of the Nov. 3rd midterms. Consumer prices have increased 5.4% since January 2025, but average hourly earnings are barely keeping up with 5.5% growth over the period.
For households that depend on a paycheck, the economic challenges are clear: staying employed has not necessarily meant staying above water. In recent polls, 84% of respondents called the cost of living one of their most important issues. Of these, 74% say their cost of living is heading in the wrong direction.
These concerns have mounted all while the hard metrics tell another tale: GDP is growing above trend, consumer spending remains robust, layoffs trudge along at ultra-low levels, and we’ve seen a stable unemployment rate over the past year. Despite healthy metrics, consumers have never felt worse about their circumstances. The University of Michigan’s preliminary October sentiment index fell to 46.3 from 48.1 in September, depressing the metric further than the troughs seen during the inflationary crisis of the 70’s, the financial crisis of 2008, and even the COVID pandemic.
Recent household experiences and sentiment differ across the country. Below we examine how income, spending, unemployment, inflation, and bankruptcies have performed across the country as a way to understand how voters’ concerns may be expressed at the polls next week.
Stable unemployment, but not for all
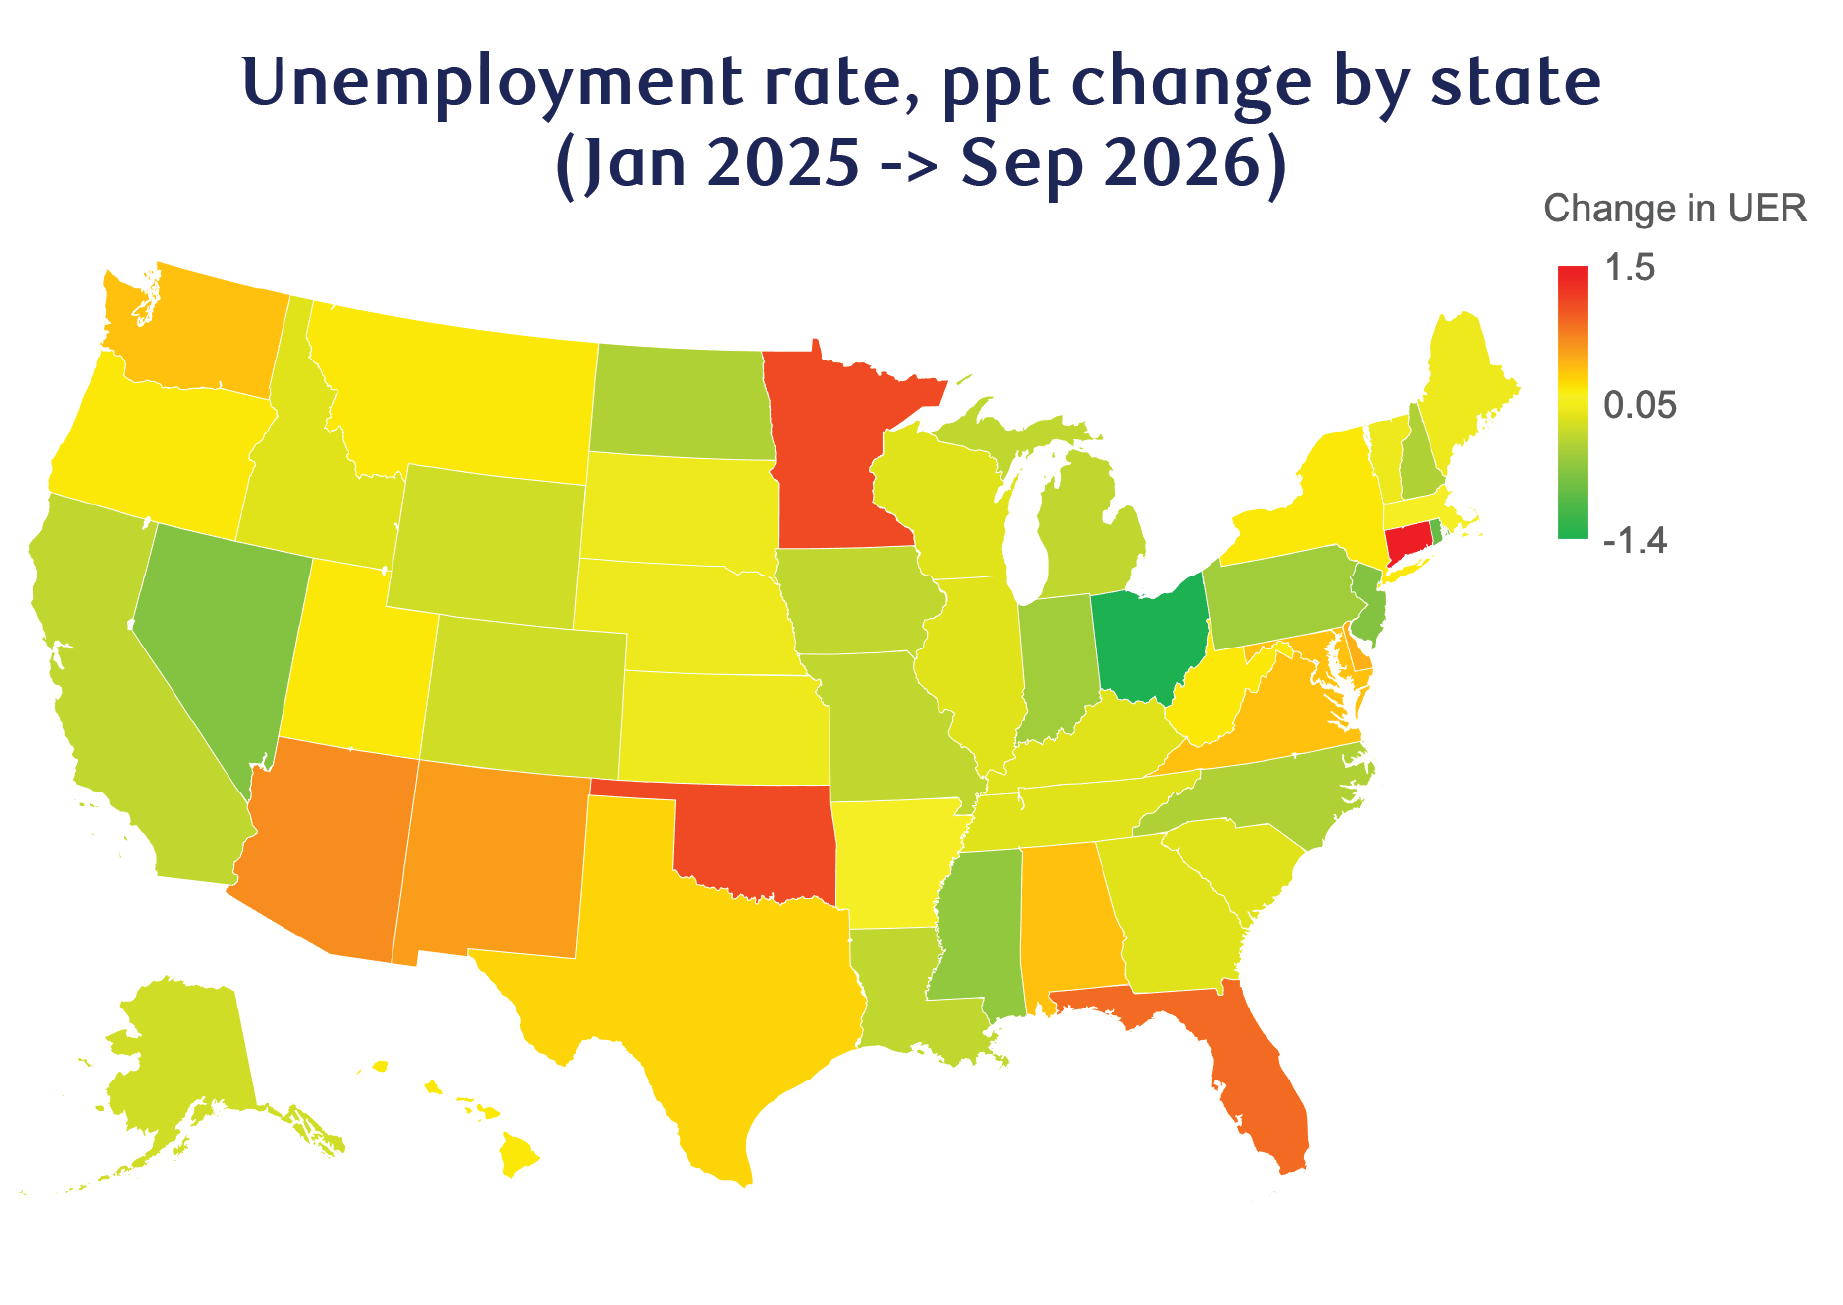
Recoveries have taken place in unemployment metrics, such as headline unemployment, the job finding rate, and the incidence of working part-time due to economic reasons. Oklahoma, Florida, Minnesota and Connecticut each showed more than a full percentage point increase in their state unemployment rates, which may have caused frustration and income loss for households living there.
Weak growth in personal income reflects a worried consumer
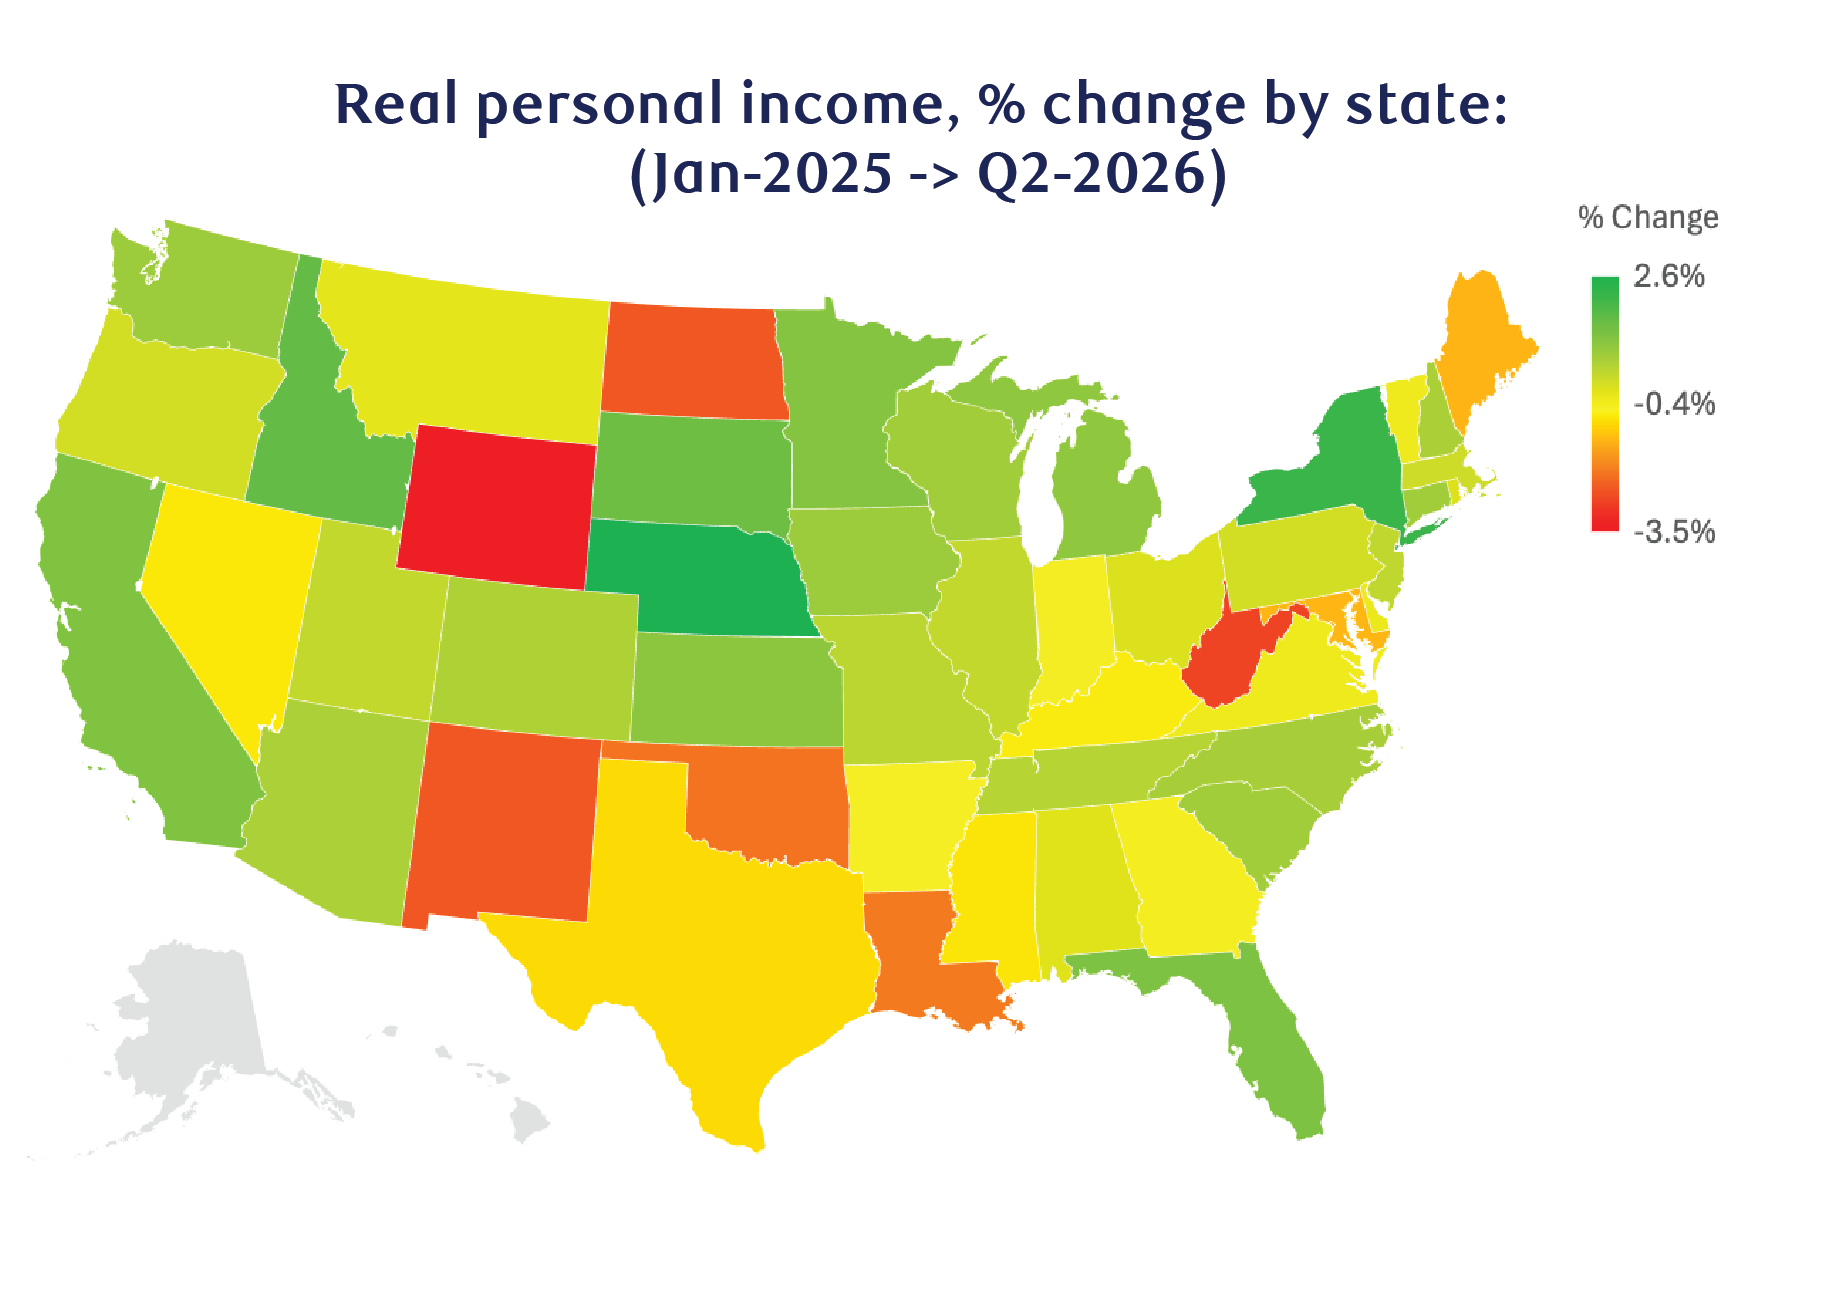
In Q3, consumer spending accelerated to 3.8% despite flat real disposable income increasing by only 1.3%. The broader trend has been a declining personal saving rate that sits below 4.0% for the first time since 2022. Our assessment is that this leaves affordability politically potent even without an economic slowdown or widespread layoffs. Southern and Southwestern states showed losses in real personal income which are reflective of increases in unemployment. But higher regional costs are a factor, and North Dakota and Wyoming stand out, with both having lost purchasing power despite an improvement in the unemployment rate.
Electricity prices are a visible issue
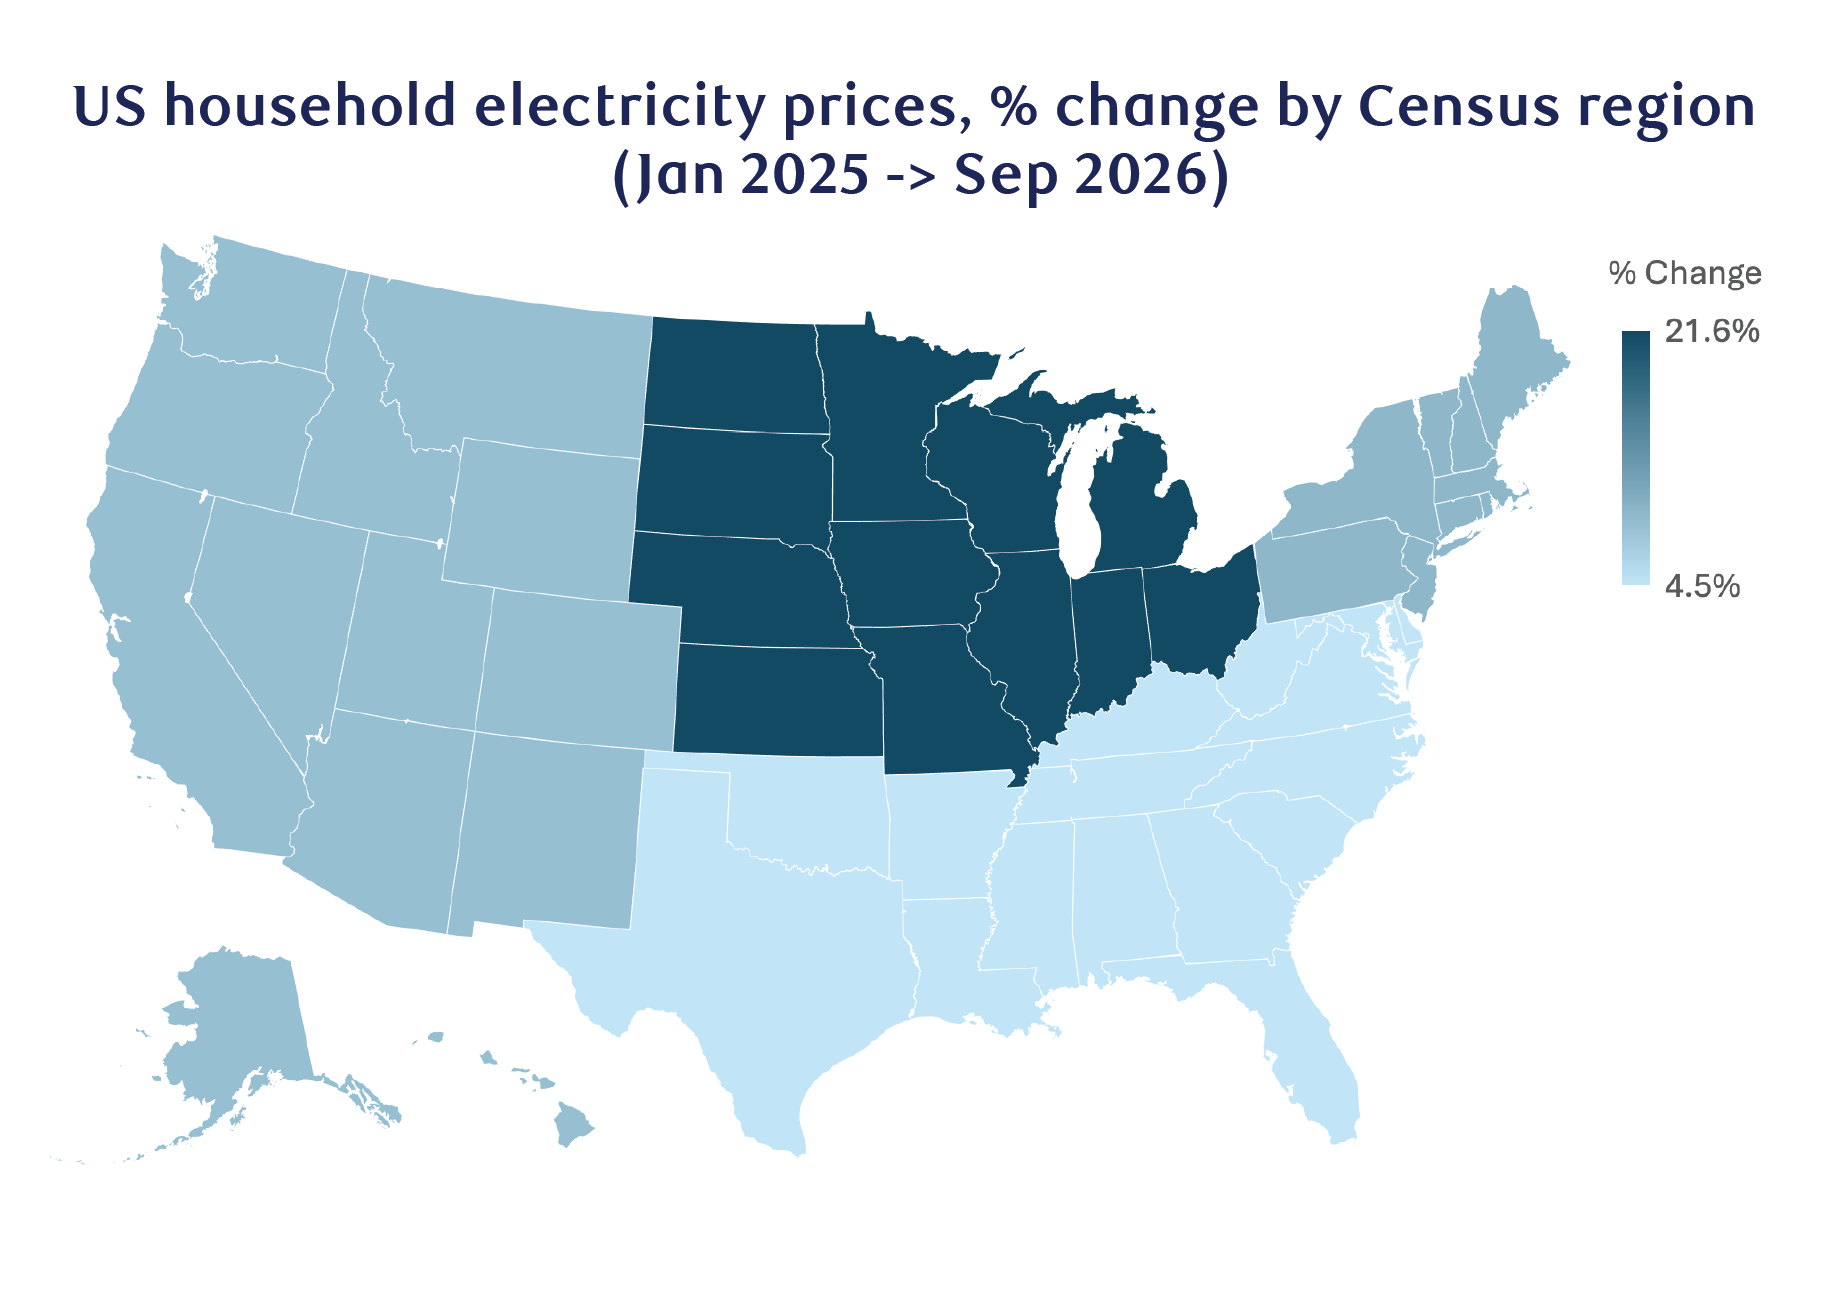
A main contributor to the affordability story is the price of electricity. On a cumulative basis from Jan 2025 to September 2026, household electrical prices rose 5.3%, and added more than an entire percentage point to headline inflation. The Midwest region has been especially burdened this term, with household electrical services prices increasing by more than 20%. This is tied to the AI data center build out and will be worth monitoring how states handle data center development heading into 2027.
Bankruptcies are trending higher
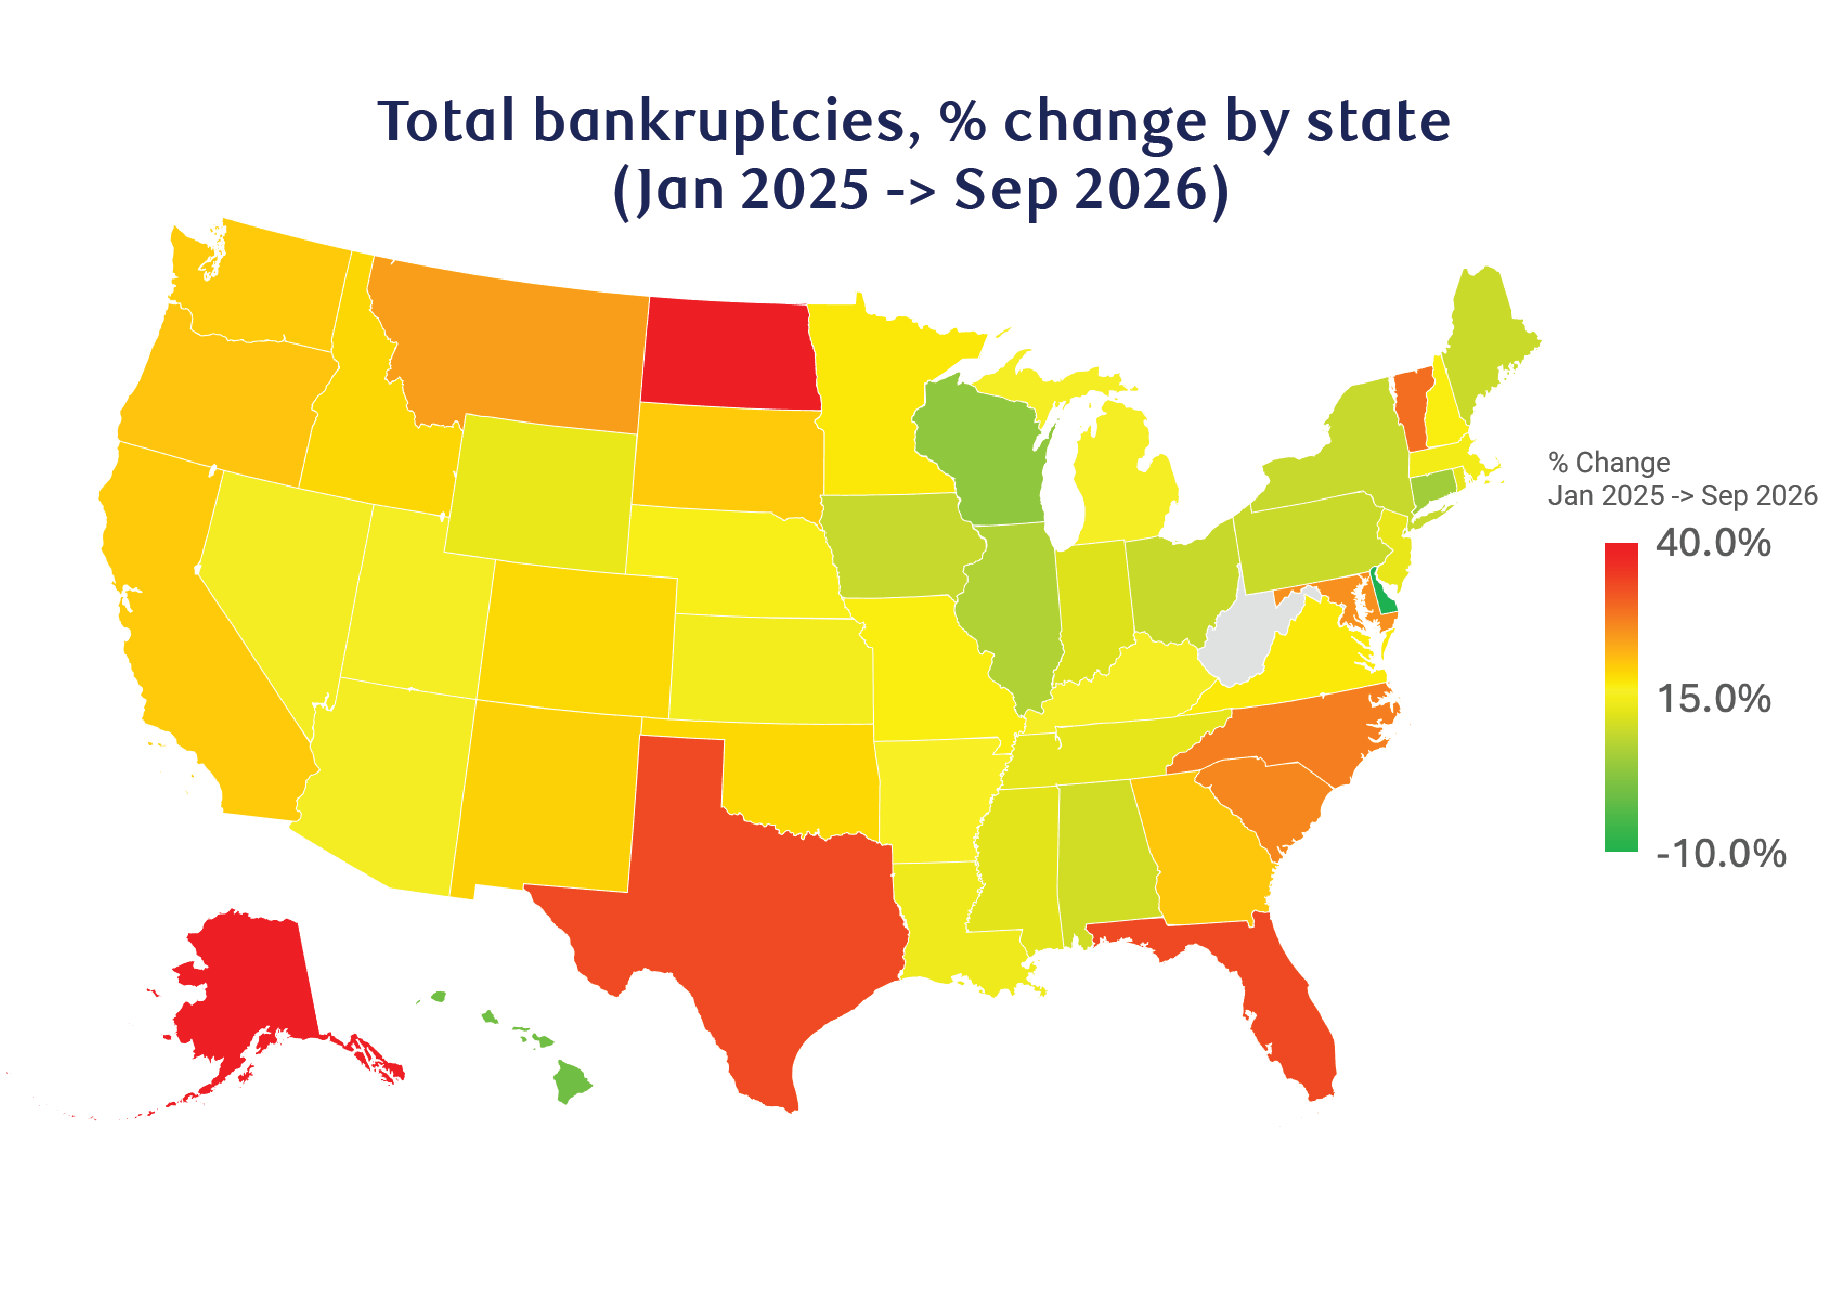
Bankruptcies are a strong indicator of both the business climate and consumer stress. While new business formation has been strong, the ability to run a business longer term is a better indicator of economic strength. In that lens, the average increase in bankruptcies filed across states was 17.7%. Just 18 states sit below a 15% increase, marking a significant deterioration in the business climate, in large part due to rising input costs. The increase is most apparent in southern states including North Carolina, South Carolina, Florida, and Texas. North Dakota stands out again, which suggests rising costs are a factor.
Medicaid coverage has seen widespread declines
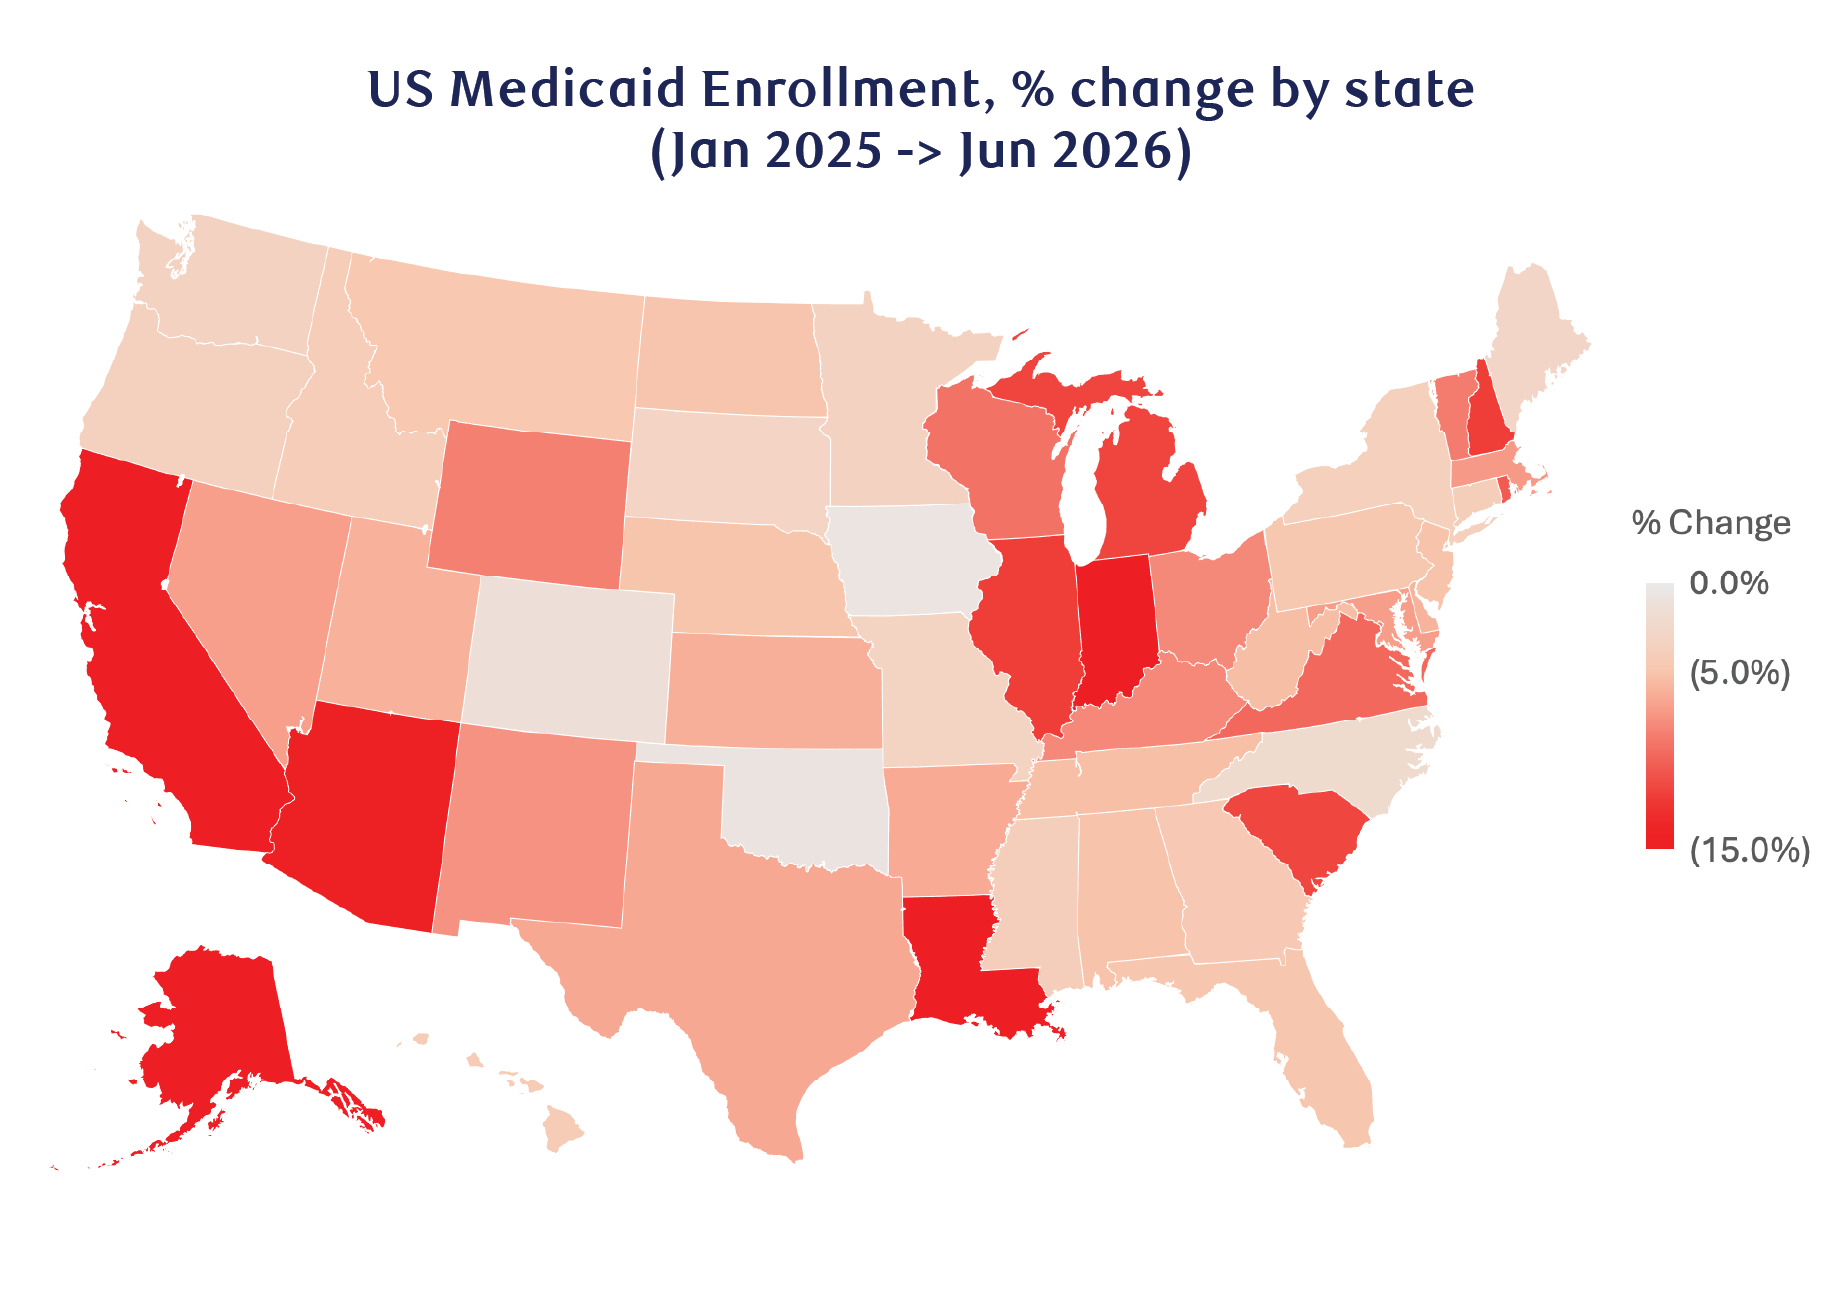
Medicaid participation has declined by more than six million enrollees since January 2025. Like the SNAP program, additional requirements were put into place which constrained the eligibility terms and tightened coverage. Outsized enrollment declines were seen in Alaska, Arizona, California, Louisiana, South Carolina, and the Great Lakes region. Loss of Medicaid coverage is a notable adjustment to government welfare benefits, and could amount to sizable reductions in government transfer income over the next year.
About the authors:
Mike Reid is Head of US Economics at RBC. He is responsible for generating RBC’s US economic outlook, providing commentary on macro indicators, and producing written analysis around the economic backdrop.
Carrie Freestone is a Senior US Economist at RBC. Carrie is responsible for projecting key US indicators including GDP, employment, consumer spending and inflation for the US. She also contributes to commentary surrounding the US economic backdrop which she delivers to clients through publications, presentations, and the media.
Imri Haggin is an US Economist at RBC, where he focuses on thematic research. His prior work has centered on consumer credit dynamics and treasury modeling, with an emphasis on leveraging data to understand behavior.
This article is intended as general information only and is not to be relied upon as constituting legal, financial or other professional advice. The reader is solely liable for any use of the information contained in this document and Royal Bank of Canada (“RBC”) nor any of its affiliates nor any of their respective directors, officers, employees or agents shall be held responsible for any direct or indirect damages arising from the use of this document by the reader. A professional advisor should be consulted regarding your specific situation. Information presented is believed to be factual and up-to-date but we do not guarantee its accuracy and it should not be regarded as a complete analysis of the subjects discussed. All expressions of opinion reflect the judgment of the authors as of the date of publication and are subject to change. No endorsement of any third parties or their advice, opinions, information, products or services is expressly given or implied by Royal Bank of Canada or any of its affiliates.
This document may contain forward-looking statements within the meaning of certain securities laws, which are subject to RBC’s caution regarding forward-looking statements. ESG (including climate) metrics, data and other information contained on this website are or may be based on assumptions, estimates and judgements. For cautionary statements relating to the information on this website, refer to the “Caution regarding forward-looking statements” and the “Important notice regarding this document” sections in our latest climate report or sustainability report, available at: https://www.rbc.com/community-social-impact/reporting-performance/index.html. Except as required by law, none of RBC nor any of its affiliates undertake to update any information in this document.

