
As oil prices continue to fluctuate around $100/barrel, there’s been an ongoing concern about “damage” to the US economy, even as by any standard definition, the economy is clearly currently not in a recession.
Growth in Q1 came at a solid 2%, the unemployment rate is sitting comfortably at 4.3%—near all-time lows—and jobless claims suggest layoff headlines are overdone. It’s also evident, however, that economic strength isn’t particularly broad. AI investment is driving the bulk of capex growth, and payroll growth is almost entirely thanks to robust hiring in healthcare. Both represent structural trends supporting the economy through otherwise cyclical weakness. Let’s also not forget government support. The deficit is still running around 5% of GDP—despite DOGE cuts—with personal transfers comprising nearly 20% of personal income.
We’ve written that we don’t think one should bet against the US economy, but it’s fair to question the fragility of top line figures, especially in the context of a sizeable energy shock. Even if the economy is fine now, the question we keep getting is: how long could it hold up in this environment before we see a recession?
While we covered the impact of higher energy prices, to more specifically answer this, we map out how close the US is to a recession now, and what it would take to trip the wire on a significant deterioration. It leads us to three core views:
1. The US economy in aggregate is not currently in a recession.
The set of indicators used by the National Bureau of Economic Research (NBER)* to identify recessions is not flashing red. Yes, some segments suggest caution, but more recent data including payroll growth, industrial production, and retail sales are accelerating, while the unemployment rate is holding steady.
At the same time, headline strength in most major data masks some significant sectoral weaknesses that we’ve seen in the past year. We are mindful of weaknesses in trade-reliant sectors and note that two things can be true at the same time. An economy can look fine in aggregate but suffer sectoral recessions underneath.
Still, the US economy remains on a solid footing, and it will take more than a few months of high gas prices to knock it off course.
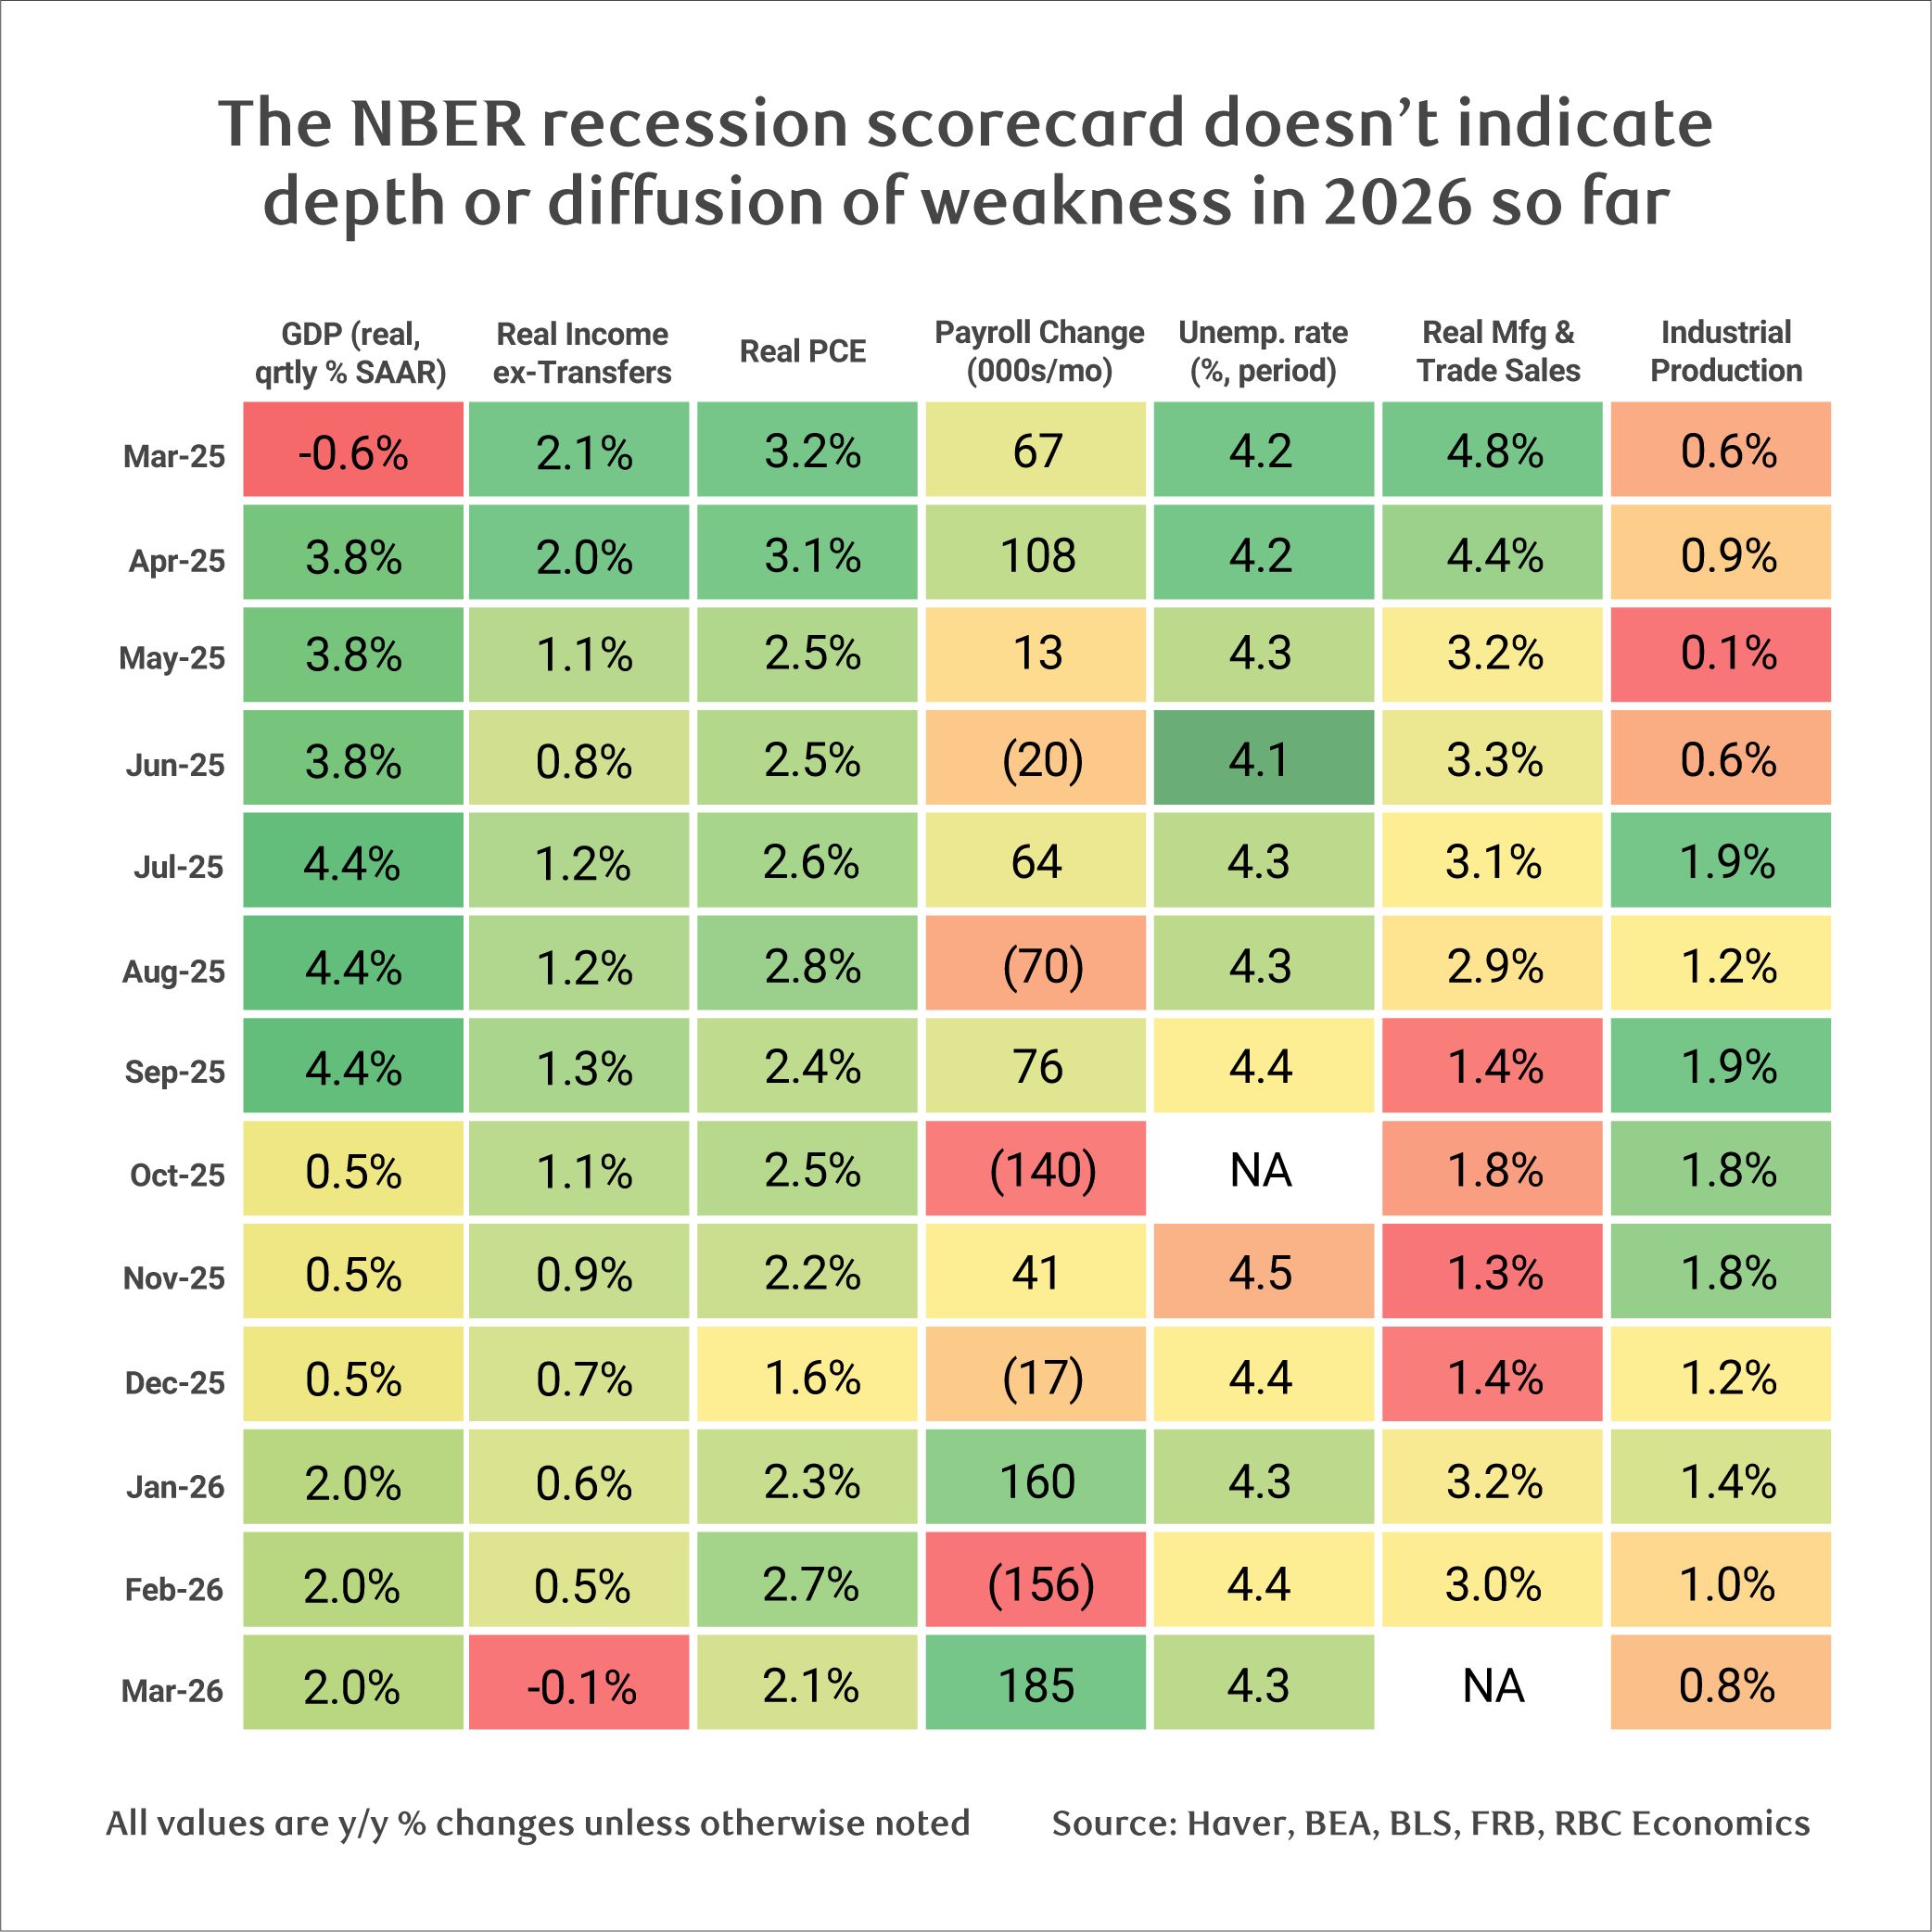
*The NBER is tasked with identifying and dating economic cycles in the US, and broadly defines a recession as: “a significant decline in economic activity that is spread across the economy and that lasts more than a few months. The committee’s view is that while each of the three criteria—depth, diffusion, and duration—needs to be met individually to some degree, extreme conditions revealed by one criterion may partially offset weaker indications from another.”
2.There are meaningful counterweights in the economy that can absorb this energy shock, namely One Big Beautiful Bill Act (OBBBA) tax benefits.
Tax refunds are tracking 17% higher than 2025 to date—worth an additional $50 billion in consumer pockets (which does not show up as income for 2026). Outsized tax returns are acting as a buffer for higher gas prices, which we estimate are adding upwards of $150 billion in nominal spending. Stripping out gas station sales from retail sales data shows spending increased nearly $1.4 billion between February and April, with few signs of meaningful demand destruction.
Still, tax returns are not evenly distributed across the income spectrum, and we’re seeing signs of stress including a declining personal saving rate (3.6% in March). But there’s room for that to fall further—it just won’t feel good for consumers, increasing the risk they start pulling back more meaningfully.
3. We estimate it would take nearly one million job losses to generate recession risks.
That number would push the unemployment rate high enough to trigger the Sahm rule by December. The rule historically signals recessions are triggered when the three-month moving average of the national unemployment rate rises by 0.5 percentage point or more relative to its low in the preceding 12 months. The question is, how could that happen?
We get this number by estimating the increase in input costs resulting from higher oil prices across all private sectors. If all sectors react by laying off enough workers to proportionately offset the hit to margins without the need to pass through higher costs, we can get there. But that’s extreme.
And we certainly don’t see signs of muted pass through. April’s headline Producer Price Index accelerated at the fastest pace since 2022. An elevated Consumer Price Index in April also confirms higher input costs are being passed to the consumer. So, a recession-based scenario is not tracking with reality right now.
About the Authors:
Frances Donald is the Chief Economist at RBC and oversees a team of leading professionals, who deliver economic analyses and insights to inform RBC clients around the globe. Frances is a key expert on economic issues and is highly sought after by clients, government leaders, policy makers, and media in the US and Canada.
Mike Reid is Head of US Economics at RBC. He is responsible for generating RBC’s US economic outlook, providing commentary on macro indicators, and producing written analysis around the economic backdrop.
Carrie Freestone is a Senior US Economist at RBC. Carrie is responsible for projecting key US indicators including GDP, employment, consumer spending and inflation for the US. She also contributes to commentary surrounding the US economic backdrop which she delivers to clients through publications, presentations, and the media.
Imri Haggin is an US Economist at RBC, where he focuses on thematic research. His prior work has centered on consumer credit dynamics and treasury modeling, with an emphasis on leveraging data to understand behavior.
This article is intended as general information only and is not to be relied upon as constituting legal, financial or other professional advice. The reader is solely liable for any use of the information contained in this document and Royal Bank of Canada (“RBC”) nor any of its affiliates nor any of their respective directors, officers, employees or agents shall be held responsible for any direct or indirect damages arising from the use of this document by the reader. A professional advisor should be consulted regarding your specific situation. Information presented is believed to be factual and up-to-date but we do not guarantee its accuracy and it should not be regarded as a complete analysis of the subjects discussed. All expressions of opinion reflect the judgment of the authors as of the date of publication and are subject to change. No endorsement of any third parties or their advice, opinions, information, products or services is expressly given or implied by Royal Bank of Canada or any of its affiliates.
This document may contain forward-looking statements within the meaning of certain securities laws, which are subject to RBC’s caution regarding forward-looking statements. ESG (including climate) metrics, data and other information contained on this website are or may be based on assumptions, estimates and judgements. For cautionary statements relating to the information on this website, refer to the “Caution regarding forward-looking statements” and the “Important notice regarding this document” sections in our latest climate report or sustainability report, available at: https://www.rbc.com/community-social-impact/reporting-performance/index.html. Except as required by law, none of RBC nor any of its affiliates undertake to update any information in this document.
