

 EN



The Bottom Line:
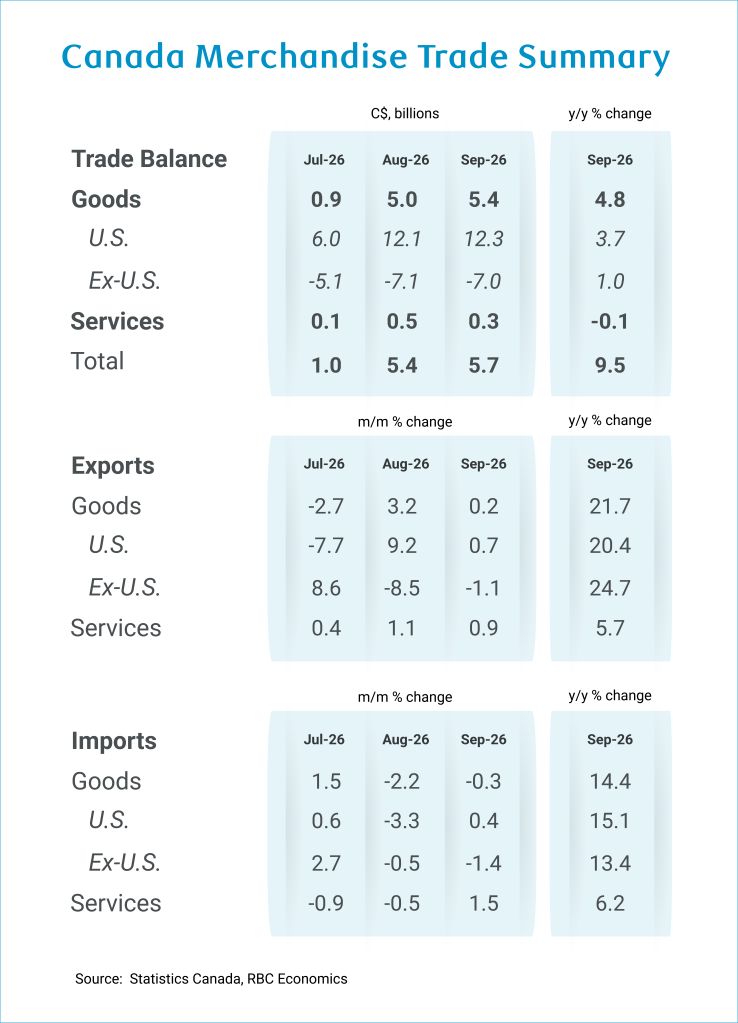
Canada’s trade surplus widened to $5.4B in September from $5.0B in August (revised up from $4.2B), marking the first full month since Section 338 tariffs took effect on August 22nd.
Exports rose 0.2%, driven by volatile metal exports (+9.8%, mostly gold) and energy exports (+8.2%) from higher crude oil prices. But these gains were largely offset by declines across various non-energy products, including consumer goods (-7.1%) and electronic equipment and parts (-13.8%), partly reflecting a reversal in U.S. purchases of targeted exports following August’s rush to front-run tariffs. Excluding energy and metals, exports fell 5.6%. Export volumes fell 4% when stripping out price effects.
Imports edged 0.3% lower, largely reflecting weaker motor vehicle and parts purchases due to unplanned supply disruptions in U.S. plants. This was moderated by continued spillover from the AI supply chain buildout into Canada-imports of electronic equipment and parts jumped a record 10.3%, mostly reflecting computer and peripherals (+29.4%), which includes processing units used in data centers.
By our count, Canadian exports of products targeted with the new 50% tariffs were down 28% year-over-year in September after rising 40% year-over-year in August1. The estimated average effective tariff rate for Canadian exports to the U.S. ticked up to 4.2% from 3.2% in August, reflecting the impact of the new tariffs – now above some other major U.S. international trade partners (notably Mexico’s 3.2% rate) but still below the 6.5% average rate on all U.S. imports, and over 82% of Canadian exports continued to cross the border duty free in September.
While the monthly data is highly volatile and revision prone, we estimate a net add of around a percentage point to Q3 GDP growth – broadly consistent with our own projection for an annualized 1.8% increase in Q3 GDP.
Looking ahead, the reshuffling of products targeted by U.S. tariffs in both mid-September and late October did not materially change the share (~5%) of total U.S. import from Canada affected by the new measures. While product bans for a subset of dairy, alcohol, and motorcycle products went into effect on September 29th, there was already a prohibitive 50% tariff applied to some of these goods, so the marginal impact of the ban on the macroeconomic growth backdrop is likely relatively small.
That being said, we continue to expect significant disruption in targeted sectors, but with more than 80% of Canadian exports maintaining duty-free access under CUSMA, spillover to the broader economy should remain limited.
The details:
-
Canada’s merchandise trade surplus widened to $5.4 billion in September, up from $5.0 billion in August—marking the seventh consecutive surplus.
-
Overall exports edged up 0.2%, driven by higher metal (mostly gold) and energy exports that benefited from rising prices, but were offset by weaker non-energy exports such as consumer goods and electrical equipment and parts, some of which were targeted by Section 338 tariffs. Export volumes (excluding price effects) fell 4% in September.
-
Imports edged 0.3% lower, largely reflecting sharp declines in motor vehicle and parts imports (-9.1%) due to unplanned supply disruptions and weaker consumer goods purchases (-2.9%).
-
Both exports and imports edged up 0.2% in the third quarter. On a real basis, exports were down 0.6% in the third quarter, while imports were down 1.6%.
-
Canada’s trade surplus with the United States widened slightly to $12.3 billion in September, compared with $12.1 billion in August. Exports to the U.S. rose just 0.7%, while imports rose 0.4%.
-
The trade deficit with countries outside the United States was largely unchanged at around $7.0 billion in September. Exports fell for a second consecutive month but were up roughly 25% year-over-year. Imports also fell 1.4%.
-
From separately reported U.S. trade data this morning, the average effective U.S. tariff rate on imports from Canada was 4.2%, up from 3.2% in August, partly reflecting the new Section 338 tariffs. The total U.S. average effective tariff rate declined to 6.5% from 6.8% in August.
-
The share of exports crossing the border duty-free is estimated at around 82% (down from 84.6% in August and 85.7% in July), largely due to duty-free trade exemptions under CUSMA.
About the authors:
Salim Zanzana is an economist at RBC. He focuses on emerging macroeconomic issues, ranging from trends in the labour market to shifts in the longer-term structural growth of Canada and other global economies.
- Based on August 22nd Section 338 tariff list ↩︎
This article is intended as general information only and is not to be relied upon as constituting legal, financial or other professional advice. The reader is solely liable for any use of the information contained in this document and Royal Bank of Canada (“RBC”) nor any of its affiliates nor any of their respective directors, officers, employees or agents shall be held responsible for any direct or indirect damages arising from the use of this document by the reader. A professional advisor should be consulted regarding your specific situation. Information presented is believed to be factual and up-to-date but we do not guarantee its accuracy and it should not be regarded as a complete analysis of the subjects discussed. All expressions of opinion reflect the judgment of the authors as of the date of publication and are subject to change. No endorsement of any third parties or their advice, opinions, information, products or services is expressly given or implied by Royal Bank of Canada or any of its affiliates.
This document may contain forward-looking statements within the meaning of certain securities laws, which are subject to RBC’s caution regarding forward-looking statements. ESG (including climate) metrics, data and other information contained on this website are or may be based on assumptions, estimates and judgements. For cautionary statements relating to the information on this website, refer to the “Caution regarding forward-looking statements” and the “Important notice regarding this document” sections in our latest climate report or sustainability report, available at: https://www.rbc.com/community-social-impact/reporting-performance/index.html. Except as required by law, none of RBC nor any of its affiliates undertake to update any information in this document.

