

 EN
EN 


Canadian consumers continued spending through another challenging quarter, likely drawing on savings or taking on more debt to maintain consumption patterns amid weak real wage gains and higher energy costs.
RBC’s Q2 cardholder transactions shows overall spending accelerating, consistent with signs of improvement in the broader economy—though some of the gain likely reflects spending to keep up with rising gasoline prices.
Beyond the energy pull, RBC’s core retail sales (excluding spending at gas stations) rose 2.4% in Q2 from Q1, pointing to broader consumer strength. Purchases of essentials1 excluding fuel grew 2.2%, matching growth in discretionary services2 spending—where cardholders prioritized social experiences during the summer event season.
Cardholder spending on discretionary goods3 rebounded 3.7% from Q1 following a weak year and a half. Household and construction purchases saw its first quarterly gain since mid-2025, coinciding with early signs of renewed homebuyer interest. Spending on clothing and apparel also strengthened after a slow start to the year.
Major events—like FIFA World Cup matches in Toronto and Vancouver and The Calgary Stampede—temporarily boosted dining and entertainment activity in specific time periods and locations, but likely had limited impact on overall Canadian spending growth. International visitors may have offered a larger temporary spending boost during these events. However, RBC cardholder data reflects spending by Canadian cardholders in Canada, not by international visitors (see more below).
Underlying strength in spending suggests consumers broadly contributed to gross domestic product growth in Q2. We remain cautiously optimistic that the consumer and economic backdrop will continue to improve gradually over the remainder of 2026, though high energy costs—still cutting into household purchasing power—remain a risk.
Outlook still cautiously positive despite high energy costs
Since energy prices spiked in early March, consumers have been allocating a larger share of their spending to gas stations, likely sustaining broader spending growth by collectively saving less or borrowing more—a trend that can’t persist indefinitely.
Still, under the surface fundamental drivers of consumer spending have also been improving. The unemployment rate fell to its lowest in two years (6.4%) in July from a recent 6.9% peak in April, and employment bounced back after large declines earlier this year.
U.S. tariff risks remain, but business investment is tracking a sizable increase in Q2. More businesses also plan to add jobs in the year ahead than pull back, suggesting they’re adapting to the uncertainty.
Household insolvencies have likewise shown signs of stabilizing after rising for much of the last four years, and—controlling for the earlier surge in population—remain below levels before the pandemic on a per-person basis.
Government support programs—like the new Canada Groceries and Essentials Benefit4 –may be providing additional relief for lower-income households navigating higher essentials costs as well.
That said, there are certain pockets of the country where financial stress indicators are significantly worse. British Columbia stands out with rising per capita consumer insolvencies that remain significantly elevated compared to before the pandemic. Though per capita insolvencies are still the lowest in the country, the pace of increase is an indicator of financial stress.
Manitoba, Ontario, and Newfoundland and Labrador also show elevated insolvency rates relative to 2019, though their trajectories are considerably less steep than B.C.’s.
Impact of FIFA on cardholder spending in June and July
RBC cardholder data doesn’t fully capture the impact FIFA had on overall spending, given the significant number of international visitors that attended tournaments. Still, our data provides a meaningful view of how Canadian consumers adjusted spending patterns during the event.
There was a significant increase in spending at food and drink vendors over the tournament period. Nationwide, spending in this category ate up 12.5% of total cardholder spending in June—the largest share since RBC began tracking this data in 2018.
Food and beverage spending peaked at the end of June when tournament scheduling intensified to six matches per day from the usual 1-4. The uptick was broad-based across age groups and regions—extending beyond host cities (Toronto and Vancouver)—likely reflecting watch parties and other associated gatherings.
Interestingly, cardholders under age 25 showed more exclusive engagement with Team Canada matches—increasing visits to food and drinking establishments more when the national team played.
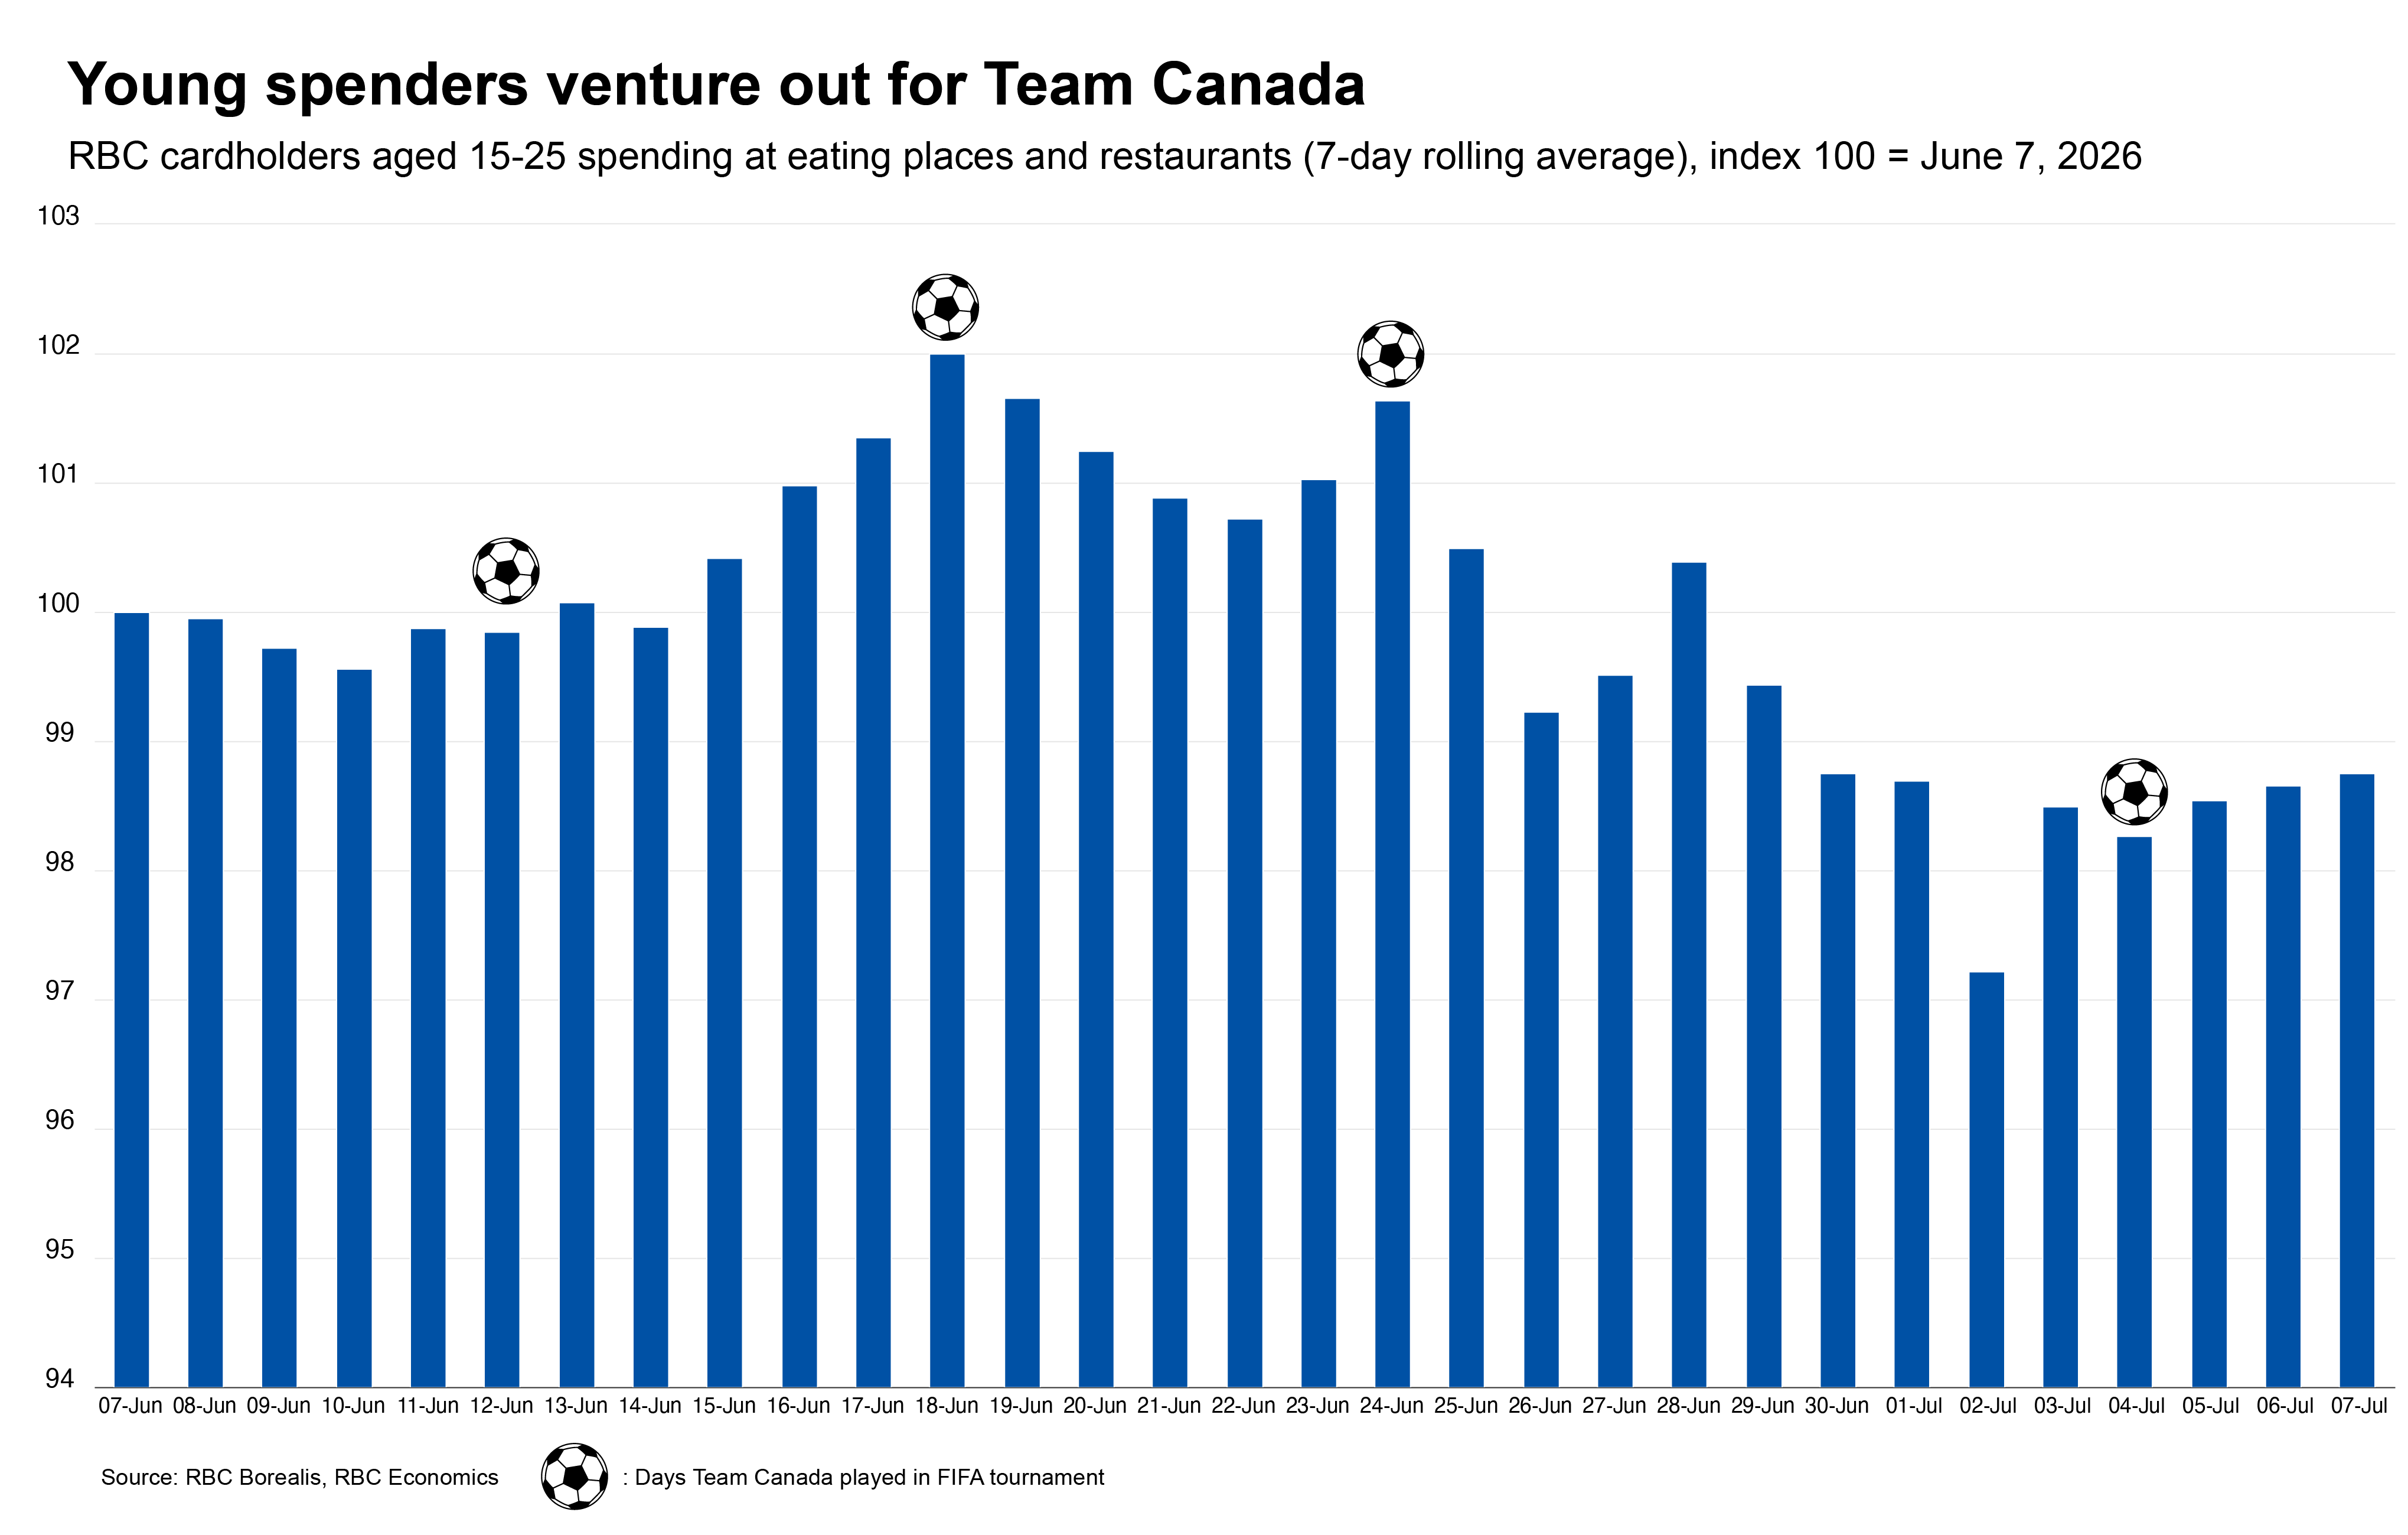
Despite the boost at food and drink establishments, discretionary services spending overall saw little change between May and June (+0.4%). Higher spending in this category appears to have come at the expense of other discretionary services’ spending, consistent with historical precedents where special events shift the timing, type and location of domestic consumer spending without necessarily leading to a net gain nationally.
Growth in discretionary services outside of dining and entertainment were essentially flat between May and June (0.1%), bogged down by a 0.2% decline in travel spending and 7.3% contraction in spending on movie and videogame streaming services.
Potentially larger temporary boost from foreign visitors
International tourists may have amplified the World Cup’s spending impact on host cities. International visitors to Toronto and Vancouver’s airports rose nearly 10% during the tournament, reflecting increased travel to these destinations. OpenTable reservations’ data mirrored this pattern with a significant increase in restaurant visits.
Overall, international arrivals to Canada in June were just 2.6% higher than last year. Travel services exports, which measures spending by travellers within Canada, showed little change in June.
About the Authors:
Rachel Battaglia is an economist at RBC, providing forecasts for the Canadian provincial economies and analyzing key trends in housing and consumer spending.
Abbey Xu is an economist at RBC. She is a member of the macroeconomic analysis group, focusing on macroeconomic forecasting models and providing timely analysis and updates on economic trends.
- Include groceries, utilities, insurance, telecommunications, and local transportation among others. ↩︎
- Includes restaurant, education, entertainment, travel, personal care, business, legal and real estate services. ↩︎
- Includes apparel, jewellery, electronics, household materials, office supplies, pet care items, and gifts ↩︎
- Replaced the old federal GST/HST credit with enhanced, quarterly payments where amounts are boosted by 25% for a five-year window beginning in 2026. ↩︎
This article is intended as general information only and is not to be relied upon as constituting legal, financial or other professional advice. The reader is solely liable for any use of the information contained in this document and Royal Bank of Canada (“RBC”) nor any of its affiliates nor any of their respective directors, officers, employees or agents shall be held responsible for any direct or indirect damages arising from the use of this document by the reader. A professional advisor should be consulted regarding your specific situation. Information presented is believed to be factual and up-to-date but we do not guarantee its accuracy and it should not be regarded as a complete analysis of the subjects discussed. All expressions of opinion reflect the judgment of the authors as of the date of publication and are subject to change. No endorsement of any third parties or their advice, opinions, information, products or services is expressly given or implied by Royal Bank of Canada or any of its affiliates.
This document may contain forward-looking statements within the meaning of certain securities laws, which are subject to RBC’s caution regarding forward-looking statements. ESG (including climate) metrics, data and other information contained on this website are or may be based on assumptions, estimates and judgements. For cautionary statements relating to the information on this website, refer to the “Caution regarding forward-looking statements” and the “Important notice regarding this document” sections in our latest climate report or sustainability report, available at: https://www.rbc.com/community-social-impact/reporting-performance/index.html. Except as required by law, none of RBC nor any of its affiliates undertake to update any information in this document.

