
The week that was
-
Canada and Mexico agreed to increase collaboration in several key areas: from supply chains and AI to energy security and the digital economy.
-
Trump follows through on his threat to double tariffs on India to 50% for buying oil from Russia.
-
U.S. shipments of orange juice to Canada plummeted to a more than 20-year low in June, new data shows.
-
Japan says the Trump administration promises to fix an “extremely regrettable” tariff rate mistake connected to its deal with the U.S.
-
In a new survey, nearly 90% say tariffs have negatively impacted U.S. manufacturing and production.
-
Trump threatens to impose 100% tariffs on foreign semiconductors unless businesses promise to invest in the U.S.
-
As of midnight on August 8, new U.S. tariff rates came into effect on 90-plus countries.
Who wants to make a deal?
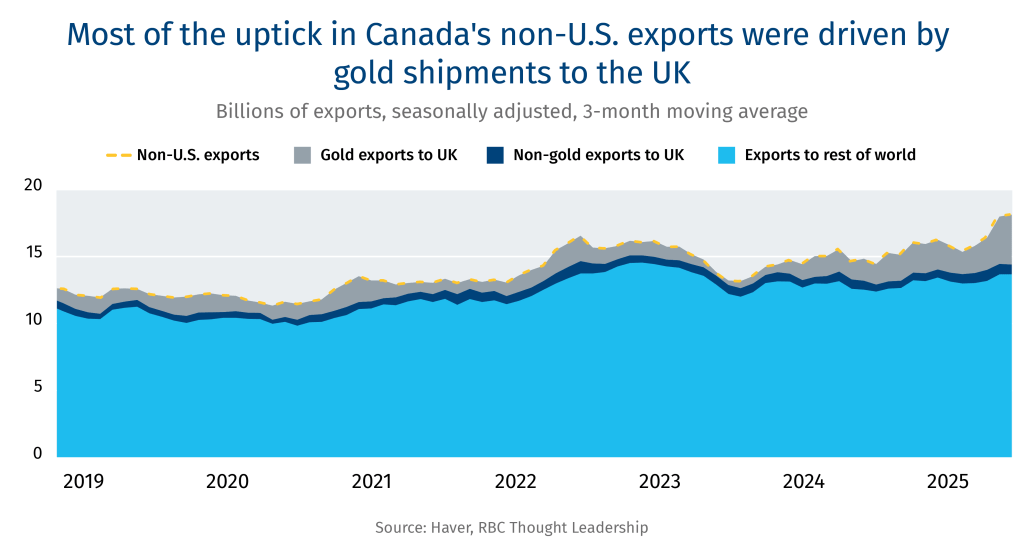
Despite Canada’s growing ambition to widen its pool of trading partners, the latest trade data indicates that diversification is challenging. Exports to countries other than to the U.S. were largely flat in the second quarter–the slight uptick in non-U.S. exports was primarily due to higher gold shipments to the U.K., which more than doubled in value compared to last year because of higher prices.
Three questions…
Nathan Janzen, Assistant Chief Economist with RBC Economics, provides some clarity amid all the chaos around trade.
Q: Can you attach a dollar figure on what U.S. tariffs are costing the Canadian economy?
A: Reduced economic growth on both sides of the border, much of that coming from the uncertainty around future trade policy, has frozen business investment decisions. Canada’s retaliatory tariff measures have been significant in some sectors, including increased tariffs on steel imports from countries other than the U.S., and are raising input costs for Canadian businesses.
But on a relative basis, tariffs have raised costs more in the U.S. than in Canada. Tariff revenues collected by the Canadian federal government, paid by Canadian buyers, rose about $2 billion from a year ago from March through May, which was 1.8% of the value of total goods imported over that period. And a significant portion of those revenues collected will be returned to businesses through a remission process. By comparison, U.S. tariff revenue collected, paid by U.S. buyers, increased $48 billion over that same period, and rose to 10% of the value of imports in June. That is the highest average U.S. tariff rate since the 1940s.
Q: How much has CUSMA shielded Canadian exports?
A: Canada’s pre-existing trade agreement with the United States has backstopped duty free access for the bulk of Canadian exports to the United States. About 90% of Canadian exports have continued to access the United States market duty free March through June and Canada has been left with the lowest average effective tariff rate of any major U.S. trading partner, even with the August 1 increase in the tariff rate to 35% on Canadian exports not compliant with CUSMA.
Maintaining that exemption for duty free trade under CUSMA is critical for Canadian exporters, but is also critical for Canada’s trade partners in the U.S.—Canada was the top export destination for 32 U.S. states last year, and the top import source for 22. The CUSMA agreement does not automatically expire until 2036, but critical negotiations to extend the agreement begin next year.
Q: Canada and Mexico agreed this week to collaborate more closely on trade. What opportunities do you see?
A: More Canadian trade diversification is great—that includes offshore opportunities but also increased trade with Mexico and between Canadian provinces. International trade in services has also been a growing share of both Canadian and global trade, and it is easier to diversify trade in something like professional services where geographic distance is less of a barrier.
But a huge share of trade flows in North America are in the heavily integrated manufacturing sector—and decades of free integration of Canada/U.S./Mexico supply chains means that the sector doesn’t really work without any one participant. U.S. tariffs on products like steel, aluminum, and copper raise input costs and reduce the competitiveness of that integrated North American manufacturing ecosystem relative to offshore production chains in Europe and Asia. It’s not possible to diversify that kind of trade in the short tern without significant, negative economic disruptions on both sides of the border.
Bottom line
US$12 billion
How much the trade war is said to have cost automakers—so far.
This article is intended as general information only and is not to be relied upon as constituting legal, financial or other professional advice. The reader is solely liable for any use of the information contained in this document and Royal Bank of Canada (“RBC”) nor any of its affiliates nor any of their respective directors, officers, employees or agents shall be held responsible for any direct or indirect damages arising from the use of this document by the reader. A professional advisor should be consulted regarding your specific situation. Information presented is believed to be factual and up-to-date but we do not guarantee its accuracy and it should not be regarded as a complete analysis of the subjects discussed. All expressions of opinion reflect the judgment of the authors as of the date of publication and are subject to change. No endorsement of any third parties or their advice, opinions, information, products or services is expressly given or implied by Royal Bank of Canada or any of its affiliates.
This document may contain forward-looking statements within the meaning of certain securities laws, which are subject to RBC’s caution regarding forward-looking statements. ESG (including climate) metrics, data and other information contained on this website are or may be based on assumptions, estimates and judgements. For cautionary statements relating to the information on this website, refer to the “Caution regarding forward-looking statements” and the “Important notice regarding this document” sections in our latest climate report or sustainability report, available at: https://www.rbc.com/community-social-impact/reporting-performance/index.html. Except as required by law, none of RBC nor any of its affiliates undertake to update any information in this document.