Key Findings
-
Canada is back on the radar of global investors. Last year, foreign direct investment in Canada reached nearly $100 billion, the highest level since 2015.
-
Global capital flows are shifting significantly. Geopolitical disruptions, most recently the conflict in Iran, are leading major investors and companies to rebalance their portfolios.
-
A $1.8 trillion investment opportunity over the next 10 years could make Canada the G7’s growth leader. RBC Thought Leadership’s research and analysis indicates that there is an immense opportunity in six export-oriented, R&D-intensive, and strategically significant industries:
-
Oil and Gas: $705 billion. New oil pipelines and LNG terminals could elevate Canada to energy superpower status, diversifying trade, providing energy security to allies, and fostering carbon capture and sequestration technologies.
-
Electricity: $670 billion. A transformative expansion of power across nuclear, hydro, and renewables, coupled with grid modernization, would ensure a reliable, affordable, non-emitting system while strengthening Canada’s competitiveness in a power-hungry heavy industry.
-
Agriculture and Food Processing: $205 billion. Enhanced support for R&D could unleash a multi-decade, export-led growth cycle that strengthens domestic food sovereignty and enables food security to allied countries.
-
Metals and Minerals: $200 billion. With NATO partners eyeing alternatives to a China-dominant critical mineral supply chain, Canada could hedge this concentration risk, power the West’s energy transition, and strengthen defence and advanced manufacturing supply chains.
-
Defence: $19 billion. Canada plans to nearly triple defence spending to 5% of GDP by 2035, which could generate $100 billion for Canadian companies and transform Canada from a defence equipment importer into a contributor to allied military capabilities, particularly in emerging areas like Arctic surveillance and space-based defence systems.
-
Space: $12 billion. Canada’s economic ambitions should extend out of this world. Investments in the space industry would advance the country’s excellence in satellite communications, space robotics, earth observation, and aerospace engineering, creating new opportunities in defence, high-tech and advanced manufacturing.
-
-
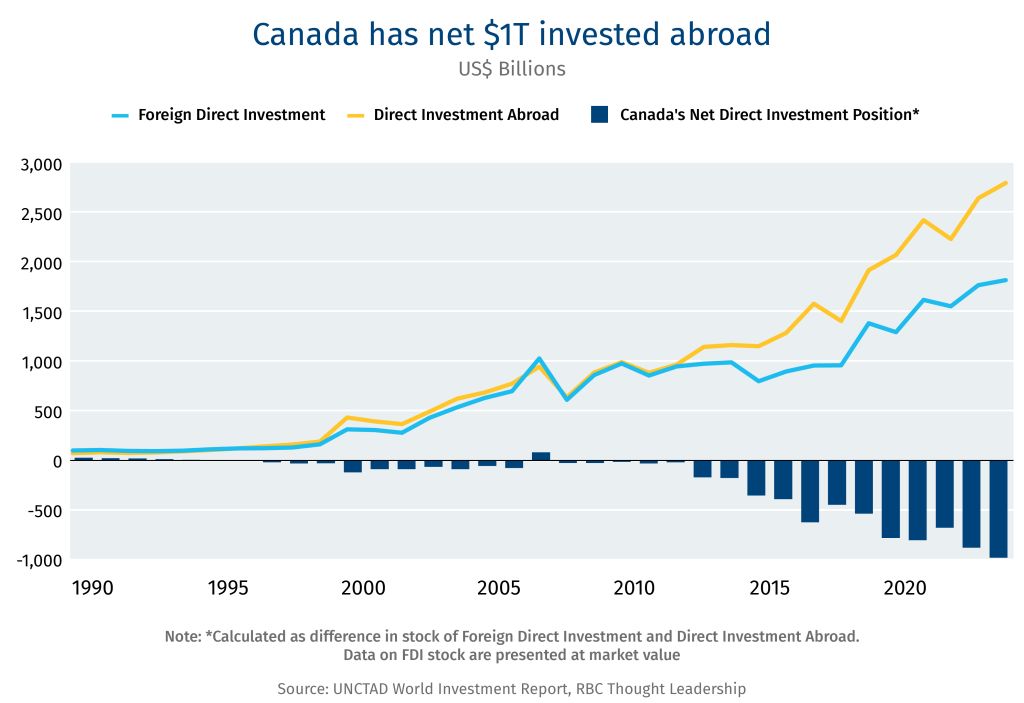
Canada is emerging from an unprecedented capital recession. The renewed interest comes after a decade of weak business investment, stalling productivity, and stagnating living standards. Between 2015 and 2024, more than $1 trillion of investment exited Canada—the largest capital exodus in Canadian history. For every dollar of inward FDI, two dollars exited.
-
To unlock investment, Canada needs a new capital formation framework. The non-financial corporate sector is sitting on more than $1 trillion in cash on its balance sheet. Its deployment could crowd in additional pools of capital: institutional, risk, foreign, and state capital. Our proposed capital formation framework includes four pillars, each targeting an incremental layer in the capital stack:
-
A brownfield to greenfield asset recycling program
-
Scale-enabling procurement
-
Reforms to the corporate income tax and foreign investment regimes
-
Leveraging of state capital
-
-
Canada’s new playbook must include Indigenous economic partnership, which not only helps to secure project approvals, but can accelerate project timelines. Partnerships work best when they are embedded early and aligned with community needs.
Canada is back on the capital radar.
Following a decade defined by record levels of capital flight and weak business investment, Canada is increasingly catching the attention of global investors and companies looking to rebalance their portfolios amid global uncertainty. Last year, foreign direct investment in Canada hit nearly $100 billion, the highest it’s been since 2015 and the first time in a decade when inflow exceeded outflow.
The opportunity is immense. If Canada can capitalize on this moment, it could lead the G7 in economic growth and industrial dynamism. RBC Thought Leadership’s research and analysis indicate that Canada requires $1.8 trillion in investment over the coming decade to galvanize growth in six export-oriented, R&D-intensive and strategically significant industries:1 Oil and Gas, Metals and Minerals, Electricity, Agriculture and Food Processing, Defence, and Space.
For an economy worth $3 trillion annually—and given that we are focused on six industries that, collectively, represent less than 10% of GDP—the $1.8 trillion figure is substantial. However, it is attainable over the next decade, especially given the pools of capital to draw upon. Between pension funds and asset managers, Canada is sitting on nearly US$10 trillion in capital. And while estimates vary, the global capital pool sits somewhere between US$150 to US$200 trillion.2
Simply put: There is more than enough capital to power the country’s growth ambitions.
With that in mind, we imagine two future scenarios: Trend Growth and Step Change. The Trend Growth scenario paints a picture of Canada 10 years out if current policies and investment patterns remain unchanged. The Step Change conceives a decade of purposeful national strategy, federal-provincial coordination and targeted investment.3
The latter, which represents a 65% capital injection boost from the Trend Growth scenario, shapes a new and prosperous Canada. One that could include two new oil pipelines, increasing production capacity by a third; an expansion of power generation across all sources, including nuclear; $300 billion in defence spending that strengthens advanced manufacturing and better enables Canada to contribute to NATO’s collective defence; the transformation of the mining sector into a linchpin of Canada’s industrial and geopolitical strategy; and sovereign launch capability just as space becomes the next economic frontier.
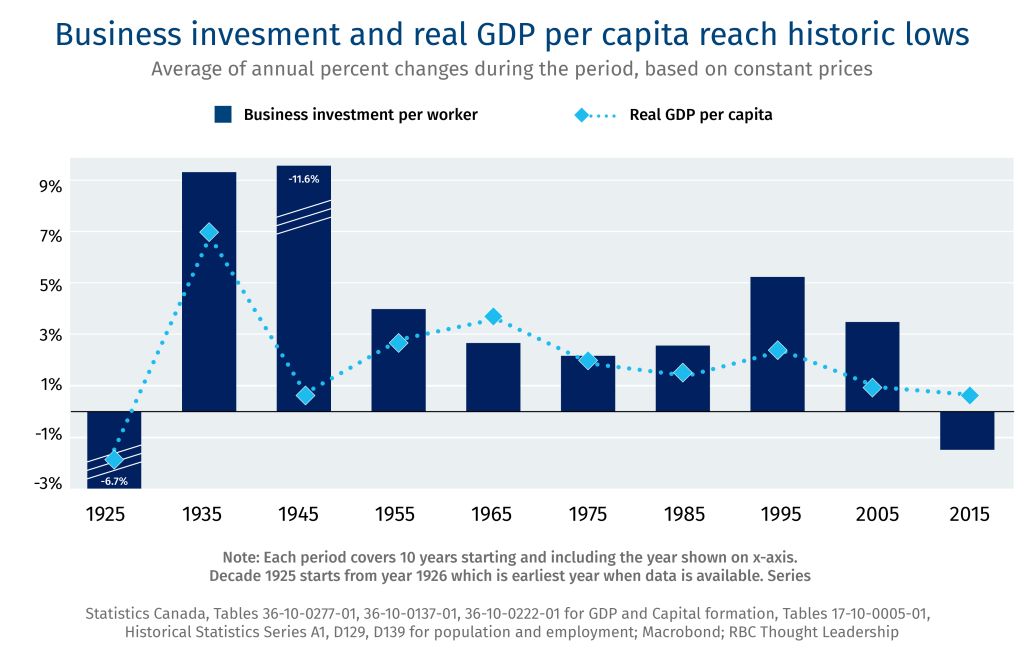
All of this would follow a 10-year capital recession. Over the past decade, Canada’s net outflow of investment exceeded $1 trillion, the most significant capital exodus in modern Canadian history. For every dollar invested in Canada from abroad, two dollars exited. Canada accounted for nearly 10% of global outward foreign direct investment over the past decade, having exported more capital than any country on Earth save the U.S. and China. Canada now ranks last among G7 nations in investment in both machinery and equipment (M&E) and intellectual property (IP). Only about 30% of Canadian capital formation goes into these productivity-enhancing categories—half the U.S. share.4
The unifying view of the experts we consulted—from pension funds to policymakers, manufacturers to miners—is that Canada doesn’t lack for capital. Instead, the barriers are execution, predictability, and risk tolerance. What’s needed is more boldness and commercial ambition. Growth requires tradeoffs in three interlocking areas:
-
Raise risk tolerance in the Canadian ecosystem and dismantle burdensome regulatory, permitting and project delivery barriers while respecting the rights of Indigenous people and protecting the environment.
-
Inject process certainty: Investors are adept at navigating risk but flee when hemmed in by vague rules and shifting frameworks.
-
Reward risk-taking and entrepreneurship to stimulate innovation and growth.
None of this will be easy. While Canada’s stock has been climbing, global competition for capital is intense. Canada isn’t the only nation in build mode. But it does have all the traits of an economic leader: a deep talent pool, abundant natural resources, political stability, and the rule of law.
The question is not whether Canada can grow—but how.
Oil and Gas
| Scenario | Trend Growth | Step Change |
|---|---|---|
| Capital Required | $430 Billion | $705 Billion |
| No significant attempt to grow oil or liquefied natural gas production | Two new oil pipelines increase output by one third | |
| Investments incrementally expand output | Three new LNG export terminals | |
| Expansion of carbon capture capacity |
Canada’s oil and gas industry sits at a strategic crossroads. Canadian producers appear poised for growth: the International Energy Agency (IEA) forecasts that under current policy, global oil and natural gas demand will continue to increase through 2050.5 The demand for oil is driven in part by growth in developing markets, aviation, and petrochemicals. LNG capacity is surging to unprecedented levels—300 billion cubic metres of new export capacity is scheduled to hit the market by 2030—bolstering global LNG supply by about 50%, some two-thirds of which originate in the U.S. and Qatar.
Energy security has become a top geo-political concern. And that was before the war in Iran curtailed supply, sent prices soaring, and exposed the dependence of many advanced economies on the Middle East. The long-term impact of the supply shock remains to be seen. It’s also too early to conclude that demand for Canadian oil and gas will remain strong for the foreseeable future. And not just for energy purposes, but as feedstock into critical industries like pharmaceuticals and fertilizers. Venezuela remains a wildcard. It’s unclear if investment will flow into that country at the scale required to meaningfully augment its production and export capabilities. Strategically, this leaves the U.S. exposed, despite being the largest global producer of oil. With 46 billion barrels of recoverable oil, the reserve-to-production ratio means that the U.S. has less than seven years of proven reserves on current consumption patterns.
The operating environment in Canada, however, is constrained. Pipelines are near full capacity and several mega projects have been delayed or cancelled over the past decade. The Canada-Alberta MoU signals a policy inflection: for capital markets, it reduces political sequencing risk—historically one of the largest contributors to Canada’s cost of capital. In conjunction with Prime Minister Mark Carney’s commercial diplomacy, including LNG exports to the Indo-Pacific and accompanying trade infrastructure, the message to global capital is that Canada’s policy environment is more open to development.
Canadian natural gas and LNG are also in expansion mode. Strong interest from Asian and European countries seeking energy security and coal-to-gas transition offer a clear growth pathway. Canada’s West Coast is well-positioned to supply this demand—if export capacity, permitting, and Indigenous partnership are aligned.6 With the U.S. rushing into the LNG space, future growth will depend on predictable and accelerated permitting, environmental assessment efficiency, and policy harmonization across jurisdictions.
Oil & Gas (2024)
| Variable | Value |
|---|---|
| Employment | 148,000 |
| Revenue | $248B |
| Exports | $115B |
| GDP | $97B |
| Source: Statistics Canada |
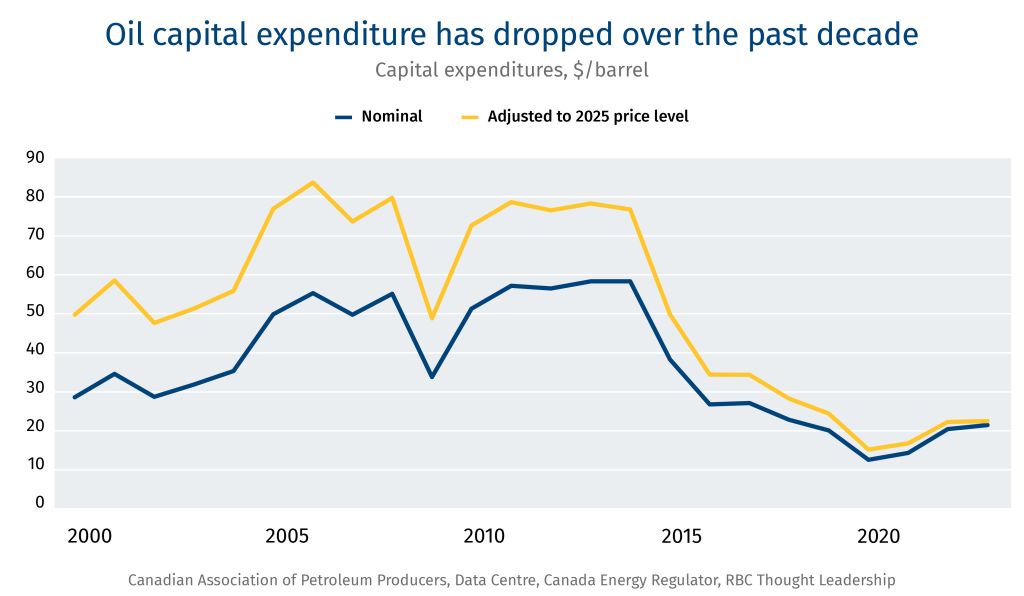
From a capital perspective, oilsands majors have emphasized capital discipline and shareholder returns, having deleveraged their balance sheets. The bulk of capital in the industry comes from operating cash flows and retained earnings. Canada’s oil and gas players hold tens of billion in cash on their collective balance sheets and generate tens of billions more in free cash flow. The industry is well capitalized to internally finance growth, but the debt and equity markets would readily respond to catalyzing investments. Between the heavy capital requirements of the industry—drilling programs, bitumen mining, processing plants, refineries, and pipelines—mere maintenance opex is extraordinarily expensive. The industry has been reticent to undertake the heavy capital investments required to expand productive capacity because it is so sensitive to policy and the uncertainty around pipeline approvals, not to mention commodity price volatility.
Capital tends to flow in the industry when policy certainty creates the extended investment horizon necessary for retained earnings to be channeled into durable, productivity-enhancing assets. Absent that, capital will tend to be returned to shareholders in the form of dividends and stock repurchases.
Capex per barrel collapsed—falling from US$75 per barrel in 2014 to US$20 per barrel in 2024 (adjusted for inflation). Production is more than twice as high today as it was in 2000, yet companies are investing less than they did a quarter of a century ago. As a result, Canadian energy infrastructure faces capacity constraints relative to resource potential.
Clean technology integration represents both a capital requirement and strategic necessity. Large-scale carbon capture and sequestration (CCS) projects like Pathways Alliance and methane emission reduction programs are important factors in securing market access and political support. IEA modelling indicates that decarbonizing the oil and gas sector will require adoption of tried, tested and affordable methane abatement technologies (e.g., leak detection and control devices) and heavy investment (US$100+ billion) in CCS technology to reach net zero. Without these investments, Canadian producers risk losing access to carbon-conscious markets.
Until key aspects of the Canada-Alberta MoU are realized, pipeline capacity will remain the defining bottleneck in Canada’s oil future. Climate policy, including industrial carbon pricing, remain in flux. The debate about the Oil Tanker Moratorium Act adds an additional layer of uncertainty. In the meantime, Canada’s export dependency on the U.S. will continue to pose sovereignty and resilience risks. Without new pathways to tidewater, diversification towards Asia will be aspirational.
Trend Growth Scenario: Constrained Oil Growth, Rapid LNG Growth ($430 Billion)
Capital is required to maintain and incrementally expand the current infrastructure and production patterns. Canada remains a strong player in international markets but continues to underplay its hand geo-politically.
-
Oil production grows 10%, rising to nearly six million barrels per day (bpd) in 2030 before plateauing. Canada remains reliant on U.S. buyers.
-
No new export oil pipelines: the system relies on improved efficiency within existing infrastructure.
-
For LNG, production grows with the completion of announced expansion projects (Woodfibre LNG and Cedar LNG), but Canada does not feed Indo-Pacific demand. No new greenfield terminals are added beyond what is already funded.
-
Limited CCS deployment constrains market access in Europe and Asia and deepens domestic divisions over hydrocarbon development.
Step Change Scenario: Energy Superpower ($705 Billion)
Canada becomes a nation capable of providing energy security to allies, supporting global emissions reductions, and galvanizing national economic growth through long-term, capital-intensive investments.
-
Two new export pipelines anchor this scenario:
-
West Coast tidewater line to Prince Rupert or Kitimat could add one million-plus bpd.
-
U.S.-bound pipeline connecting Alberta to Gulf Coast refiners could add 800,000 bpd – which could be added in phases through existing systems or through a new large diameter pipeline expansion project.
-
-
Oil production grows to 7.1 million bpd by 2035.
-
Large-scale carbon capture and sequestration (CCS) package becomes integral to Canada’s strategy, enabling expanding production. Emissions reductions were incorporated directly into our growth model:
-
Pathways, which would sequester up to 22 metric tonnes per year (Mt/year).
-
Additional projects could sequester oil sands emissions of similar scale (e.g., Alberta Carbon Grid or Origins).
-
-
Three new major LNG projects add 3.8 billion cubic feet per day (bcfd) to Canada’s LNG export capacity: LNG Canada Phase 2, Ksi Lisims LNG, and Tilbury LNG expansion.
Combined, these investments create a fundamentally different energy system. Canada contributes to the long-term energy needs of the U.S. and underwrites energy security for partners in Asia and Europe. Canada regains influence in the global oil and LNG markets, diversifying its trading partners and strengthening sovereignty. Indigenous equity partnerships are embedded in mega projects, aligned with community needs, facilitating accelerated project timelines. Upstream emissions are managed through large-scale CCS.
Electricity
| Scenario | Trend Growth | Step Change |
|---|---|---|
| Capital Required | $400 Billion | $670 Billion |
| Completion of projects underway | Expand wind and nuclear power to enable economy-wide electrification | |
| Grid maintenance | Grid expansion and modernization |
Canada’s electricity system is built on roughly 80% non-emitting power anchored by hydro and nuclear. However, the coming decades will test every part of the grid. Electrification of vehicles, buildings, industry, and data centres mean demand could double by 2050. To keep the grid reliable and affordable, Canada must massively expand and modernize a system that was built more than half a century ago. Policy momentum is building in this area, with a new pan-Canadian electricity strategy under development.
Electricity planning is shifting from a provincial utility logic to one that ties national infrastructure with industrial strategy. Hyperscale data centre commitments and applications are transforming load forecasting from incremental upgrades to step-change demand modelling. Electricity is increasingly viewed from the lens of industrial capability and economic resilience rather than power need and climate management alone. And there are areas for enhanced regional cooperation on generation and transmissions—think interties—with an important coordinating, financing and regulatory role for Ottawa.
Modernizing Canada’s variegated systems will be expensive. The power sector differs from other industries—split between public utilities and private operators, all under the rubric of heavy regulation. It’s a balance sheet-driven sector where capital flows are highly structured. Investment tends to be financed through long-term debt, not equity. The risk-and-return profile is not only tied to market prices; instead, regulatory approval, the rate-setting framework, cost-recovery mechanisms, and occasionally, risk-sharing arrangements, attract long-horizon, liability-driven investors like pension funds and insurers who are attracted by the security and stability of returns.
Utilities Sector (2024)
| Variable | Value |
|---|---|
| Employment | 140,000 |
| Revenue | $51B |
| Exports | $4.6B |
| GDP | $46B |
| Source: Statistics Canada |
Investment flows into multi-decade generation, transmission, and distribution networks, grid modernization, storage, and digital control systems. Unlike other heavy industries, productivity improvements tend not to be derived from labour efficiency, but from capital deepening—larger, more resilient, more flexible systems that lower costs and enable downstream economic activity.
At the generation level, each resource plays a distinct role in Canada’s system.
-
Nuclear is undergoing a revival. Ontario’s refurbishment anchors baseload supply, and the Darlington small modular reactor (SMR) will be the first grid-scale project in the Western world. Large-scale nuclear comes with significant cost and scheduling risks. A recent study found that of the two dozen project types, nuclear waste and nuclear power came in first and third, respectively, in terms of cost-overruns. Ontario’s refurbishment program, however, was delivered ahead of schedule and under budget—making it one of the most successful major infrastructure projects in Canadian history.
-
Hydro remains the backbone of power across Canada, but the storyline has shifted. Historically thought of as ‘endless surplus,’ hydro is becoming a balancing source of power as grid and demand requirements evolve. Drought conditions in Quebec, B.C., and Manitoba have exposed the fragility of relying solely on hydro power, too. The future of hydro is less about mega-projects and more about offering flexibility, the strategic use of interties, and providing inertia for the grid.
-
Wind makes up the largest share of new generation. On an incremental basis, wind is the lowest-cost source of new power. The challenge is intermittency and inertia. Integrating large volumes of renewable supply requires storage, grid stability, and flexibility.
-
Natural gas will likely remain a reliability backstop in various regions.
Rapidly expanding electricity demand also puts strain on the grid and related infrastructure. Transmission and distribution of assets spanning 850,000 kilometres require massive upgrades, regional interconnection, and enhanced digitization. Canada’s patchwork of 10 provincial grids complicates this process. The long-horizon nature of investment planning is complicated by the multiplicity of demand drivers, which are politically, technologically, and culturally contingent.
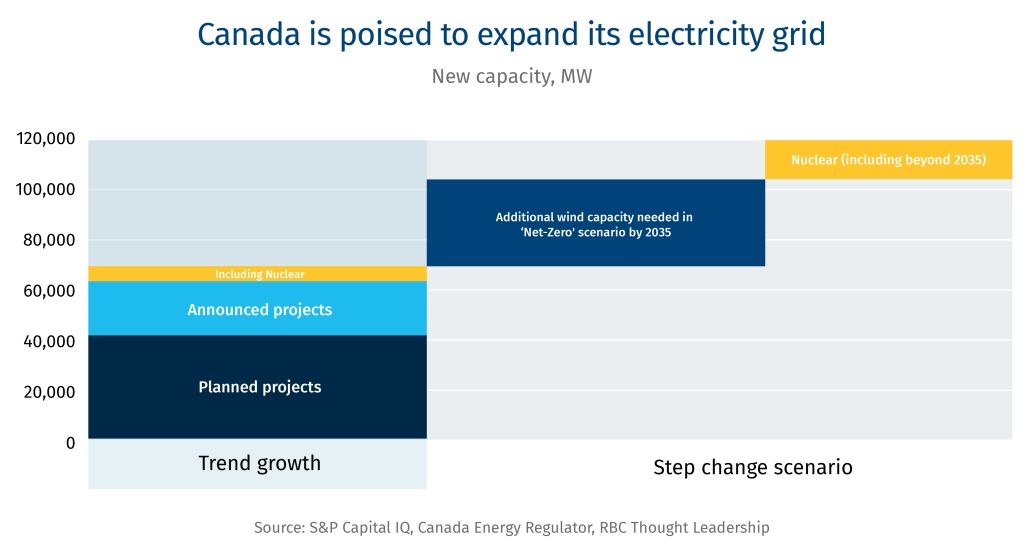
Trend Growth Scenario: Remaining Within The Grid ($400 Billion)
Canada completes what’s already approved, funded, or under construction and generates 20% more power across all sources.
-
Canada brings 63 GW of incremental capacity online across wind, solar, natural gas, and battery storage based on projects already planned and announced.
-
Two major nuclear additions in Ontario: Darlington SMR (online in 2035) and Bruce C Project (in 2041).
-
On the grid side, we assume routine reinvestment and incremental upgrade of Canada’s existing transmission and distribution lines, aligned with limited further progress on nation-wide decarbonization.
The baseline pathway does not materially alter the underlying structure of the system. With climate policy either stalled or in reverse, the policy incentives to decarbonize are less compelling. Global and domestic efforts to reduce emissions remains limited. Electrification proceeds in this scenario, but slowly.
Step Change Scenario: Industrially Competitive Net Zero Grid ($670 Billion)
Canada transforms and radically augments its energy system across generation, transmission, and distribution, including policy measures that drive decarbonization and electrification-led economic growth.
-
Canada builds 119 GW of new generation capacity—nearly double the trend growth scenario.
-
New nuclear projects include the Peace River (Alberta), Point Lepreau (New Brunswick), Wesleyville (Ontario), and Saskatchewan SMR nuclear projects.
-
Canada significantly ramps up its wind power beyond projects already in place. Grid expansion of 240,000 kilometres—double the trend scenario—with major costs from modernizing and digitizing the grid, including system reinforcements and new connections.
The expanded system is cleaner, more flexible and self-sufficient. It is responsive to economy-wide electrification and the major demand drivers that are likely to unfold in the coming decades, including:
-
Population growth and associated electricity demand at the household level (think electronics, heat pumps, etc.). This trend is in flux, as Canada’s immigration system is under increasing scrutiny.
-
Electric vehicle adoption, which has stalled with the removal of incentives, but may rebound with Ottawa’s new automotive strategy. Stricter tailpipe emissions standards, renewed EV rebates, and charging infrastructure aim to hit 75% EV sales share by 2035. This trend may extend beyond electrification of passenger cars into freight and heavy-duty transport, adding further load to the grid.
-
Data centres are a wildcard, creating both risks and uncertainty across the sector. Utilities are already signaling demand well beyond what outlooks have modelled:
-
Alberta provides a striking example: grid connection requests jumped from 6 GW to nearly 20 GW by September 2025–prompting the province to implement a two-phase integration program to maintain grid reliability and affordability.
-
Hydro Quebec expects data centres to account for 15% of net new electricity demand by 2032.
-
Ontario’s IESO projects data centres will account for more than 10% of new electricity demand through 2035.
-
-
Another wildcard: battery technology advancements, which are difficult to forecast, but the cost curve is trending lower.
This scenario supports a larger domestic population that consumes more clean electricity at home and utilizes clean power at work. Through interties and power corridors, Canada expands its grid horizontally, transporting electricity from power-generating regions to power-consuming regions, including abroad.
Power system stability, affordability and flexibility serve as a strategic advantage for Canada globally, helping Canada win new investment mandates in advanced manufacturing and frontier technology, while still working towards the goal of a net-zero grid by 2050.
Metals & Minerals
| Scenario | Trend Growth | Step Change |
|---|---|---|
| Capital Required | $140 Billion | $200 Billion |
| Maintain industry’s long-term growth rate | Develop new early- and late-stage mining projects |
Mining has historically been a cyclical industry governed by market forces. But with recent developments in Washington and Beijing, the ever-expanding critical minerals segment of the industry is being steered increasingly by geo-political strategy. Canada, the U.S. and other NATO partners increasingly view mining through the lens of sovereignty, security, and strategic infrastructure.7 In doing so, they are beginning to mirror China’s playbook. Over two decades, China used industrial policy, state-backed finance, and non-market mechanisms to secure control over minerals essential to defence, advanced manufacturing, and clean technology, especially at the level of processing, refining, and secondary manufacture.
The Canada-led Critical Minerals Production Alliance announced more than two dozen new investments and partnerships, mobilizing some $6 billion in projects and designating critical minerals as ‘essential’ under the country’s Defence Production Act. Offtake agreements, price floors, and stockpiling are some of the non-market mechanisms being employed to mobilize private capital.
The U.S. is going even further with Project Vault—a public-private partnership to finance and stockpile the minerals needed for advanced manufacturing and frontier tech. The White House is using a suite of de-risking instruments such as loan guarantees, offtake agreements, and direct equity stakes in mineral development companies to catalyze the development of lithium, copper, cobalt, and rare earths, among others. Almost overnight, Western governments have gone from observers of mining industry dynamics to market makers.
Mining Industry (2024)
| Variable | Value |
|---|---|
| Employment | 128,000 |
| Revenue | $85B |
| Exports | $35B |
| GDP | $32B |
| Source: Statistics Canada |
For Canada, long-standing challenges come into sharper relief. Despite favourable geology, world-class mining finance and engineering expertise, growth has been held back by:
-
A lengthy, complex, and unpredictable permitting process.
-
Insufficient enabling infrastructure (roads, transmission lines, processing facilities).
-
Shortage of specialized mining talent, especially around operational execution.
-
Risk capital. Junior miners have struggled to raise funds from institutional investors as market sentiment pivoted to cannabis, then crypto, and increasingly AI.
To compete in this new era, Canada’s mining industry must move beyond market-driven dynamics into strategic national development. Indigenous equity frameworks are increasingly embedded at early stages, compressing the consultation cycle.
Trend Growth Scenario: Mining as Usual ($140 Billion)
Canadian mining remains on its long-term historical trajectory. Policy ambition remains high, but the obstacles to capital formation—permitting uncertainty, infrastructure gaps, talent shortages—are not meaningfully resolved. The regulatory environment does not improve fast enough to accelerate capital. Output grows slowly, tracking 0.5% annual GDP growth.
-
New mines struggle to reach final investment decisions.
-
Capital flows remain concentrated in base and precious metals.
-
Canada’s critical mineral potential remains under-developed, owing to dependence on market forces.
These trends are sufficient to sustain operations and replace depreciating assets but not reshape Canada’s competitive position in global supply chains. Canada preserves its mining base, but supply chain dependence on foreign refining and processing persists. Canada retains relative strength in the wider mining industry but does not become a major player in the geopolitical race for critical mineral sovereignty, losing strategic clout with NATO partners in the process.
Step Change Scenario: Critical Minerals Dominance ($200 Billion)
Market forces continue to govern the exploitation of base and precious metals, but critical minerals have become a national priority. Ottawa leads coordinated federal-provincial action and advances several de-risking mechanisms.
The Step Change scenario reflects three fundamental facts about the global mining industry:
-
Many critical mineral projects are not commercially viableif left to market forces. Between small market size, absence of a global market price, or infrastructure barriers, global miners have no incentive to develop many critical mineral and rare earth resources.
-
Canada possesses dozens of strategically significant deposits,but they will require public-private cooperation to fully develop.
-
The U.S. and other allies are moving aggressively;Canada risks being left behind in the global race to build a critical mineral supply chain.
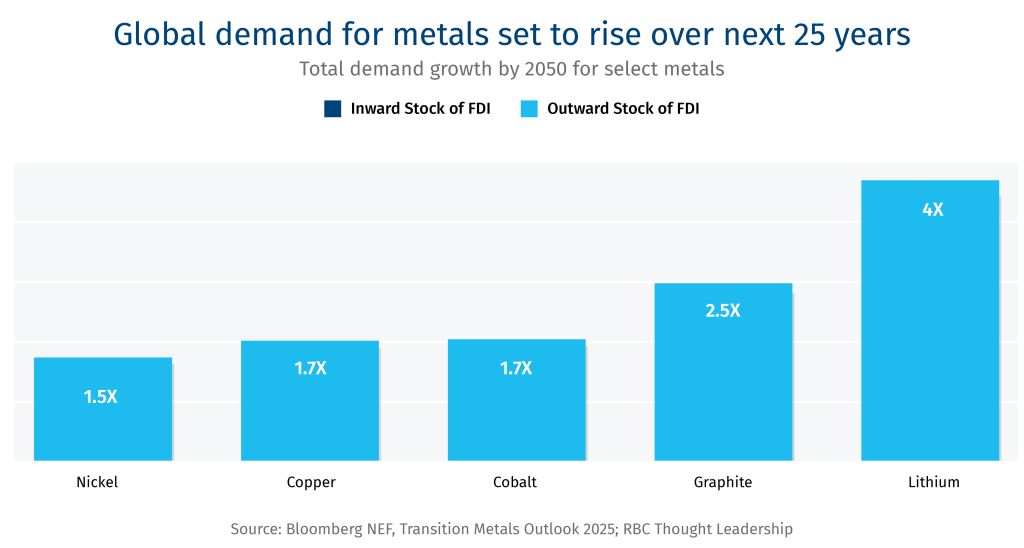
Canada develops a series of projects, both early and late stage, across a range of precious and base metals and critical minerals. Canada becomes a leader in the Critical Minerals Production Alliance, developing its reserves of copper, lithium, graphite, nickel, cobalt, and rare earths. To hedge processing and secondary manufacturing dependence on China, Canada partners with NATO and other allies in the creation of a critical minerals refining supply chain, leveraging existing smelting capacity.
Canada catalyzes:
-
Development of all late-stage projects, including the Eagle’s Nest nickel mine in Ontario’s Ring of Fire and the Casino copper mine in Yukon, among others.
-
Early-stage projects across the range of metals and minerals. Canada is a reliable supplier of critical minerals to NATO partners. Canada strengthens national and international supply chains while building domestic processing capacity. Mining is transformed from a natural resource industry into a linchpin of Canada’s industrial and geo-political strategy.
Defence
| Scenario | Trend Growth | Step Change |
|---|---|---|
| Capital Required | $10 Billion | $19 Billion |
| Canada meets its 2% NATO spending target | Core defence spending increases to 3.5% of GDP by 2035 |
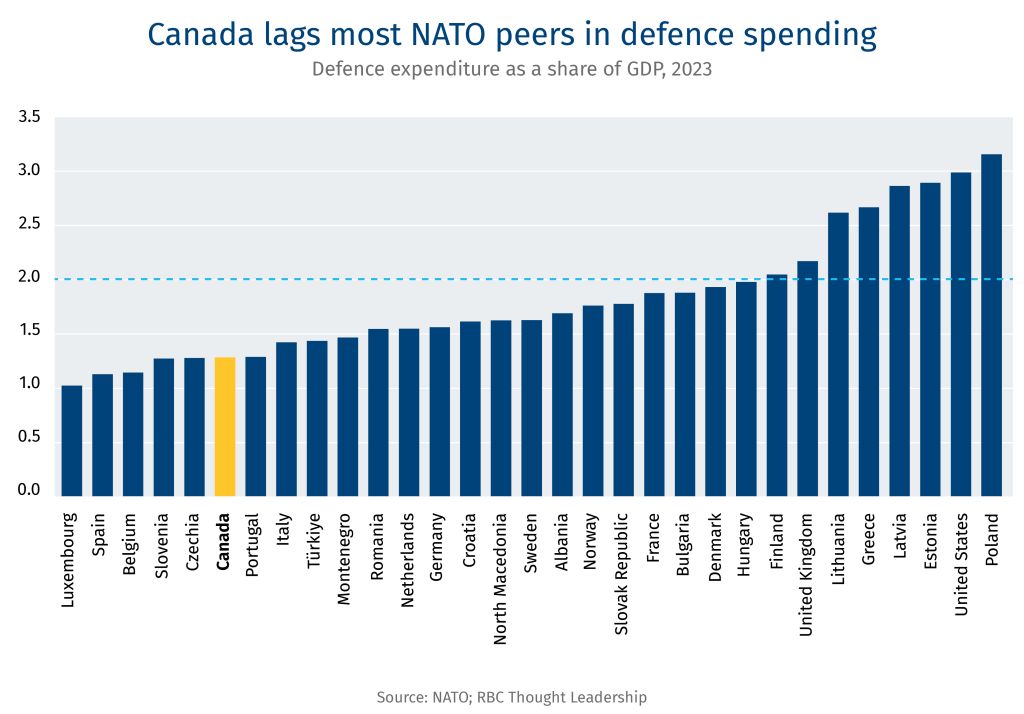
Geopolitical currents are changing rapidly. Uncertainty around the cohesion and stability of NATO has called into question Canada’s military capabilities. After decades of under-investment, Ottawa is sending the strongest demand signal in a generation. The federal government is making historic investments as part of its commitment to raise defence spending to 5% of GDP. Ottawa’s Defence Industrial Strategy serves as the beginning of a new blueprint, combining industrial capacity with strategic positioning.
An expansion of the funding envelope is being met with a change in thinking among the Canadian Armed Forces (CAF), which is shifting away from platform-centric thinking to a capability-centric approach. Uncrewed and autonomous systems—drones—provide an illustrative example of this shift. Drones sit at the intersection of defence, space, AI, and cyber and are quickly graduating from niche sub-sector to foundational capability. Canada’s Drone Surge initiative and the Canadian Army’s MINERVA program exemplify this evolution: government defines the mission or outcome and calls upon industry to provide the solution. Drones also capture the dual-use spirit of Canada’s defence-space strategy since they are already proven in commercial environments while offering scalable military applications when procurement timelines and risk-sharing mechanisms align. When it comes to Arctic sovereignty—a renewed focus for Ottawa—drones provide the persistence and responsiveness that complement space-based assets while maintaining a domestically sustainable capability.
Despite the renewed focus on funding, a series of interlocking challenges afflict the defence industry:
Defence Industry (2022)
| Variable | Value |
|---|---|
| Employment | 36,000 |
| Revenue | $14B |
| Exports | $7B |
| GDP | $9.6B |
| R&D Spend | $440M |
| Source: ISED |
-
Low and uncertain government spending has meant that domestic firms lack an anchor customer.
-
Canada’s procurement process can be slow, complex, and politicized. Multi-agency oversight, lengthy bid cycles and administrative complexities discourage investment and constrains innovation.
-
Export opportunities for Canadian companies can be limited in foreign markets because of regulatory, political and economic barriers designed to favour the host country’s sovereign industry over foreign competitors.
-
The persistent problem of scale, with many Canadian SME’s dependent on American conglomerates.
-
The defence supply chain remains fragile in the post-pandemic era, with backlogs and technical bottlenecks squeezing Tier 2 and 3 suppliers.
-
A shortage of skills means companies struggle to find engineers, scientists and technicians.
Capital dynamics in defence are driven by government procurement, long-term contracts, and public R&D funding signals that also attract venture capital and strategic equity for early-stage investment and to structure debt for more advanced companies. Capital flows fund research and development, specialized equipment, manufacturing facilities, and technological infrastructure and operations. Given the nature of the sector, government demand can scale industrial capacity for long-term contracts and derisk private investments.
Budget 2025 expanded the funding framework with new measures for dual-use technologies, critical minerals, AI, and sovereign space-launch capability. The procurement focus is clear:
-
Fighter jets, maritime patrol aircraft, under-ice submarines, and long-range rocket artillery.
-
Revitalization of Canada’s military and dual-use infrastructure, including Arctic installations, the strategy emphasizes air and maritime surveillance.
-
These latter capabilities depend on space, satellite communications, and cyber systems to connect and secure Canada’s digital defence systems.
All of this is nested in a still-emergent industrial policy with strong ‘Buy Canadian’ ambitions. There are forceful tailwinds for the industry, but momentum has yet to pick up.
Trend Growth Scenario: Force Amplification ($10 Billion)
Canada spends 2% of GDP annually into 2035. This produces predictable demand.
-
Ottawa’s ‘Buy Canadian’ policy tilts procurement volumes towards domestic content.
-
The defence ecosystem gets a boost across the value chain, beginning with R&D, but expanding into facilities, and specialized machinery and equipment, resulting in enhanced capabilities.
Bottom line: Canada rebuilds its military incrementally, with expanded hardware in a few key areas. This enables Canada to better surveil the Arctic, patrol the coasts, and support our NATO allies. However, in a world where the integrity of the NATO alliance is in question, or abolished completely, Canada’s defence capabilities remain under-developed.
Step Change Scenario: Canadian Arms Flex ($19 Billion)
Canada reaches its full NATO target of 5% of GDP by 2035, including:
-
A linear rise in core defence assets.
-
A greater share of spending is allocated to capital equipment and military hardware.
-
Large domestic procurement for next-generation aircraft, ships, cyber defence architecture, and Arctic infrastructure.
Over the coming decade, this adds $300 billion to total defence spending. If Ottawa sustains its commitment to source at least 70% domestically over the coming decade (up from 30% presently), then Canadian producers stand to gain $100 billion in incremental revenue (this excludes spending on dual-use infrastructure). This is not just more spending. Defence is R&D-intensive, which has knock-on effects across IP production, with spillover benefits across advanced manufacturing, better enabling Canada to contribute to NATO’s collective defence.
Canada builds both sides of the defence-space axis, too. Defence spending revitalizes Canada’s industrial base. Space catalyzes dual-use technology. And Canada becomes a meaningful contributor to allied space and defence capabilities, which is not only an emergent ‘border’ to be defended, but a frontier consumer market as well.
Space
| Scenario | Trend Growth | Step Change |
|---|---|---|
| Capital Required | $5 Billion | $12 Billion |
| Industry grows at historical rate (1% annually) | Canadian space sector doubles its global market share, rising to 2% by 2035 |
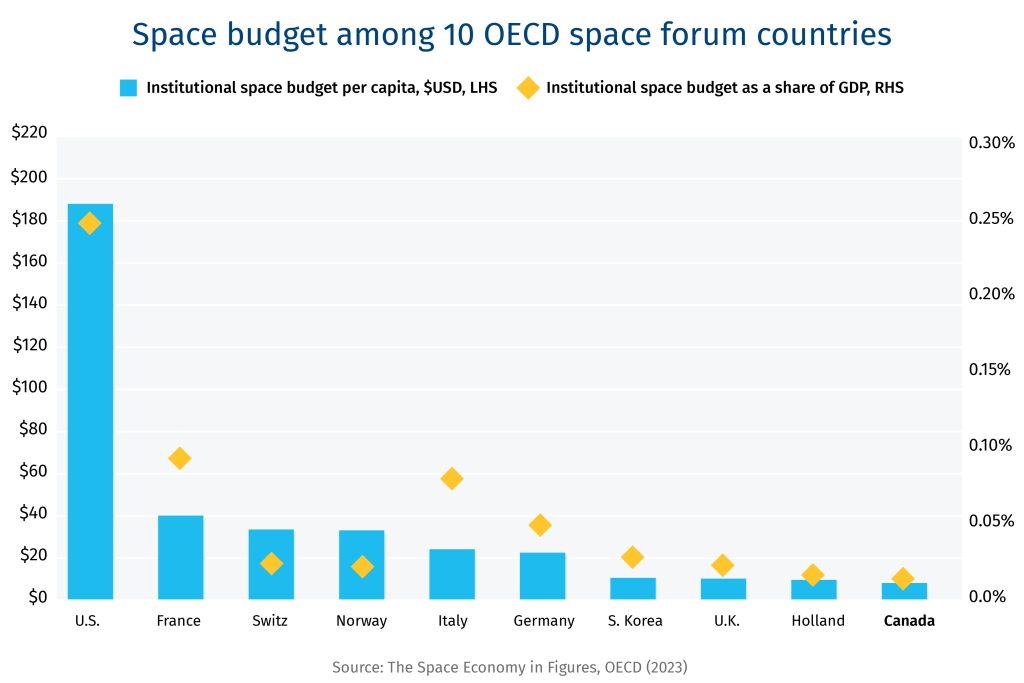
Space represents a unique convergence of strategic necessity and capital formation opportunity. As a strategic industry, space capabilities underpin national sovereignty through Arctic surveillance, defence communications, and climate monitoring but it also functions as a productivity layer across other industries—Earth observation and geospatial analytics enhance efficiency in agriculture, mining, energy, infrastructure, and insurance, making it essential to any capital-deepening strategy. The space-AI nexus also creates a powerful demand driver and intellectual property engine, where space data combined with artificial intelligence can strengthen automation capabilities, climate resilience, and defence readiness.
Canada has recognized excellence in satellite communications, space robotics, earth observation and aerospace engineering. As the third nation in space, with a long and decorated history, under-investment at the federal level combined with the failure to develop sovereign space-launch capability has constrained industry growth. That era may now be coming to an end, driven in part by the reconvergence of defence and space technologies.
Space Industry (2023)
| Variable | Value |
|---|---|
| Employment | 13,900 |
| Revenue | $5.1B |
| Exports | $2.2B |
| GDP | $3.4B |
| R&D Spend | $650M |
| Source: Canadian Space Agency |
There’s a two-pronged revolution underway and Canada has yet to find solid ground.
-
In the U.S., a policy-driven transformation of the business model unfolded over the past 15 years, with private industry increasingly in the driver’s seat when it comes to capital deployment and innovation.
-
The second locus of transformation is Europe and is just getting started. With the Russian’s invasion of Ukraine and the NATO commitment to increase defence spending, there’s a reconvergence between space and national defence. Traditional space companies are crowding into defence contracts while defence conglomerates expand their space capabilities. ‘Dual use’ space technologies are now the norm.8
Like defence, capital flows when government demand de-risks private investment, enabling firms to deepen technological capability and scale industrial capacity for long-term contracts that would not exist under purely commercial market arrangements. The financing model in Canada is challenged. In space, the fastest path to scale is not government-owned hardware—its government acting as an anchor customer for commercially owned, commercially operated (COCO) services—data, communications, surveillance, analytics, launches—under multi-year, performance-based contracts. When done properly, these contracts function as financeable, near-sovereign revenue streams that lower the cost of capital and unlock large pools of private investment, allowing Canadian firms to scale at home and export globally.
Despite past achievements and present strengths,the industry remains challenged structurally and policy wise.
Trend Growth Scenario: Space Remains Under-Leveraged ($5 Billion)
-
Annual sales decline 1% per year.
-
The industry shrinks to $4.5 billion by 2035.
Bottom line: Canada fails to arrest the decline of space. This is primarily a policy-driven choice, not a failure on the part of space companies to innovate and grow. As a result, Canada’s defence capabilities in space remain stunted and core civilian applications atrophy.Bottom line: Canada fails to arrest the decline of space. This is primarily a policy-driven choice, not a failure on the part of space companies to innovate and grow. As a result, Canada’s defence capabilities in space remain stunted and core civilian applications atrophy.
Step Change Scenario: Canadian Space Launches ($12 Billion)
Space is imagined as an essential component of national security and economic competitiveness.
-
Doubling its global market share from 1% to 2%.
-
Building sovereign launch capacity, underpinned by an increase in satellite launch cadence, in keeping with funding commitments in Budget 2025.
-
Deepening dual-use integration with defence.
-
Modernizing procurement around speed, commercial partnering, and risk-sharing.
-
On the space-defence axis, government earmarks a modest share of incremental defence spending growth for dual-use space, procured primarily via COCO service contracts—creating predictable revenues that crowd-in private capital at scale.
McKinsey forecasts that the global space market will reach US$755 billion by 2035.9 Canada captures twice its current share of the market, leading to a 4x boost to sales revenue. And Canada builds both sides of the defence-space axis. Defence spending revitalizes Canada’s industrial base. Space catalyzes dual-use technology, enabling Canada to become a meaningful contributor to allied space and defence capability.
Agriculture and Food Processing
| Scenario | Trend Growth | Step Change |
|---|---|---|
| Capital Required | $155 Billion | $205 Billion |
| Historical growth trends persist in the future | Export-led growth drives Canada to regain its international agri-food export ranking | |
| R&D and IP investments increase, strengthening innovation and productivity |
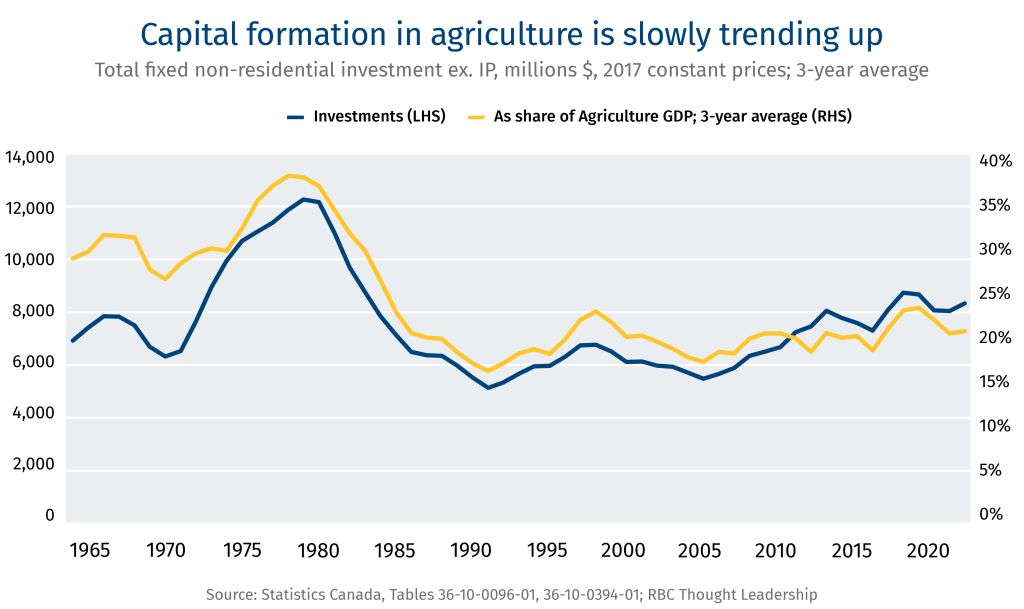
Half a century ago, Canada’s agriculture sector underwent an R&D-fueled innovation and growth boom. The prairie provinces emerged as a global breadbasket, leading in grains and oilseeds, but also in pulses and beef feedlot production. An investment surge in the 1970s and 1980s reshaped farming and coincided with the introduction of new machinery, improved crop varieties, farm chemicals, advanced genetics, and on-farm management systems.
The momentum around R&D, innovation, and growth faded in recent decades. Agricultural productivity growth slowed from roughly 2% in the 1990-2000s to 1.4% more recently.10 Canada’s position as an agri-food exporter has weakened, too. Investment in food and beverage manufacturing, the largest industry in the wider manufacturing sector, was flat from the mid-1990s through the mid-2010s, though it has shown signs of rebounding in the past decade.
Agriculture and Food Processing (2024)
| Variable | Value |
|---|---|
| Employment | 695,000 |
| Revenue | $337B |
| Exports | $60B |
| GDP | $78B |
| Source: Statistics Canada |
We have seen a brief wave of expansion in food processing since 2018—a $770 million Maple Leaf poultry plant, for example, and a $250 million flour milling facility by Parrish & Heimbecker. RBC estimates that the industry has invested $7.5 billion in expanding its manufacturing capacity in recent years, leading to a 20% boost.
Farming operations depend on a mix of cash flow, retained earnings, and bank debt to finance growth, using land, equipment and inventory as collateral. Food processors, some of which are global in scope, can leverage their corporate balance sheets to finance growth, in addition to cash flows, and have access to capital markets. Capital is deployed into productive investment through machinery and equipment, precision agriculture technologies, storage facilities, processing plants, and increasingly, R&D into seeds and biologics.
An interlocking set of stumbling blocks hold the sector back:
-
An innovation engine under strain. Canada’s agriculture R&D has declined in real terms and as a share of GDP. Public support for agricultural knowledge and innovation—once leading the charts at 3% to 4% of industry revenue—has fallen below the OECD average, eroding the pipeline for the next canola and limiting the commercialization of precision tools, seeds, and data systems.
-
Capital intensity. Capital constraints can deter the adoption of costly high-tech equipment such as drones, crop sensors, and the GPS monitoring systems used in precision agriculture.
-
A wave of succession and widening skills gap. The average farm operator is 56. Transition to the next generation is looming. And the number of operators below that age has declined by more than 50% since 2001.11 At the same time, farms are becoming more tech-driven and data-intensive, demanding operators with technical, analytical, and system-management skills. Labour and skills shortage require varying levels of solutions from targeted immigration (in the short-term) to more integrated educational discipline and smarter ag tech (over the long-term).
-
Export market concentration. Some 60% of Canada’s agriculture and processed food exports are shipped to the U.S., creating an unhealthy concentration risk. America’s status as a mature market (i.e., ageing population, slow growth) also tempers the possibility of future export growth, especially when compared to emerging markets.
Canada still has enormous capacity—fertile land, abundant water, advanced genetics, and a globally competitive supply chain. Unlocking the next era of growth depends on whether Canada can generate a new investment wave and rebuild its innovation eco-system. Canada will need to win on two fronts: use production inputs more efficiently and move up the value chain, capturing more of global food processing capacity. This would mean adoption of innovative ag tech to advance crop yield research, livestock management, greenhouse operations, and expansion of domestic manufacturing capacity—realizing efficiency gains on farm and in factory.
Trend Growth Scenario: Status Quo ($155 Billion)
-
-
Public and private investment flows into R&D and IP at historic levels.
-
On-farm investments in structures, machinery and equipment maintain capital intensity.
-
Food processing facilities replace or refresh machinery and equipment.
-
The consequences of this scenario:
-
Productivity continues to grow slowly, remaining well below historic highs. Farm Credit Canada estimates up to $30 billion in foregone industry income over the next decade due to unrealized efficiency gains.12
-
Canada’s position in the global agri-food trade continues its slow erosion. Canada was the fifth largest exporter in the early 2000s, but has slipped to seventh today (and could fall to ninth within 10 years).13
This scenario does not entail collapse, but it is managed stagnation. Canada maintains its current footprint but misses the next global wave in ag-tech, automation, and value-added processing.
Step Change Scenario: R&D-Led Productivity Surge ($205 Billion)
Canada unleashes another multi-decade growth cycle. We imagine a 1970s-style investment boom, built on the back of strengthened support for R&D and IP. More public and private capital flows into research and IP generation, which brings technological advancement and capital deepening, incrementally improving farm efficiency and facilitating the adoption of new technologies. In this scenario, the growth rate in food processing is driven by foreign demand for Canadian food exports.
-
Canada regains its international agri-food market share, rising from seventh to fifth, reinforcing its status as an agri-food superpower.
-
Public and private R&D-related spending would need to increase by 50% just to match GDP-adjusted levels from the 1980s. However, returns on the R&D investment could be 10x to 20x.14
-
Canada undertakes a deliberate, coordinated effort to trigger a new investment and innovation cycle across the industry. Capital spending surges, underpinned by large-scale adoption of emergent ag technologies, including crop genetics, more efficient machinery, and enhanced production systems.
Whether it is for allocating more funding towards research, upgrading equipment for increased efficiency, or adopting new practices, meaningfully augmenting productivity will require another phase of capital deepening. Our growth scenario also imagines Canada expanding and deepening export markets, especially for processed foods. As noted in recent RBC research, Canada could capture a large piece of the global agri-food trade, reclaiming its global ranking.15 For food manufacturing, this means exports climb above current levels. The result is not only food sovereignty, but the provision of food security to allied and friendly countries, reinforcing Canada’s standing as an industrial leader and trusted partner.
A New Capital Framework for Canada
For decades, Canada’s capital framework was built along familiar lines of private enterprise operating in relatively free markets with increasingly open borders, all governed through multilateral institutions. Comparative advantage and cost efficiency dictated capital flow. The new age we are entering is defined by fragmentation and a larger role for the state, with industrial capability, sovereignty, and geopolitical alignment adding to the traditional calculus of profit and loss.
Canada does not lack capital, but the systems to deploy it are maladapted to the new age. Capital is not flowing to where it is needed at the speed or scale required–it’s a capital mismatch. A modern capital formation framework for Canada must focus on better integrating capital pools with investable assets.
The proximal source of capital to finance growth is the companies themselves. Canada’s non-financial corporate sector, which holds more than $1.1 trillion in currency, deposits, and debt securities on its balance sheet, is the first layer in the capital stack. While insufficient to fuel our step change scenario, the deployment of corporate Canada’s spare cash could create a cascading effect, crowding in additional pools of capital.
The framework we propose focuses on four additional pools of capital: institutional, risk, foreign, and state.
| Capital Source | Role in the Capital Stream | Stage of Risk | Core Constraint | What’s Lacking | Unlock Mechanism |
|---|---|---|---|---|---|
| Institutional Pensions, asset managers | Long-horizon, liability-matching assets | Infrastructure, mature assets | Invest in assets—not projects Unable to absorb development or early-stage risk | Pipeline of bankable, de-risked projects | Asset recycling framework |
| Risk VC/PE | Innovation, scaling, commercialization, | Start-up, scale-up | Weak transition from scale to maturity | Late-stage growth capital, anchor customers | Commercial-enabling procurement |
| Foreign Sovereign wealth | Supplement domestic capital, scale enablement, global integration | All stages | Policy clarity, speed, returns | Predictable investment regime, fast approvals, competitive ROI | Corporate income tax + Investment Canada Act reforms |
| State FPT, Public FI’s | Demand creation, risk absorption, strategic projects | Early-stage, development, strategic | Fragmented deployment vehicles, execution | Scalable deployment vehicles, speed, FPT coordination | Leverage public demand and state balance sheet |
-
Large pools of institutional capital—pension funds, global asset managers, insurers—are positioned to invest in long-duration, de-risked, assets with predictable cash flows. Canada produces too few of these assets. Instead, many opportunities exist at earlier stages of development—projects burdened by regulatory uncertainty, permitting delays, or commercialization risk. Institutional capital is not designed for these opportunities.
-
Canada’s risk capital ecosystem performs relatively well at the early stages. Venture capital and private equity support a steady pipeline of innovation, but not enough companies make the transition from startup to scale. The country lacks late-stage growth capital, as well as the demand signals—procurement, anchor customers, deep domestic markets—needed to support commercialization. As a result, successful companies remain stranded at mid-size, unable to grow domestically.
-
Foreign capital remains an underleveraged source of growth. Global investors prioritize jurisdictions that offer policy clarity, speed, and competitive returns. Canada possesses the core endowments required to compete for global investment but consistently underperforms on execution. Lengthy approval timelines and policy volatility increase uncertainty and the cost of capital.
-
State capital could be deployed at scale, not to replace private capital but to catalyze it. In a more fragmented global political economy, governments are playing a bigger role in directing capital flows through procurement, equity stakes, and other de-risking mechanisms. Canada has deployment vehicles—there is a spate of Crown corporations and public financial institutions; but co-ordination and execution hinder the deployment of state capital and the crowding in of private investment.
To address the misalignment problem, we explore an interlocking set of mechanisms that would attract and unlock investment. These options are designed to improve investor certainty, reduce execution risk, and raise after-tax returns without materially adding pressure to Canada’s already-strained public finances. Critically, each option is politically implementable in the near-term.
Institutional Capital
Brownfield-to-greenfield asset recycling framework
Canada has significant public capital tied up in mature, low-risk public assets—ports, utilities, pipelines, roads and other core infrastructure. These assets could (and often do) generate stable, predictable cash flows, making them well suited for long-term institutional investors. Yet, they remain on public balance sheets, limiting fiscal flexibility at a time when many governments across Canada are already running deficits. At the same time, policy uncertainty dissuades investment in critical infrastructure projects. As a result, institutional capital remains sidelined while projects in the national interest remain under-capitalized.
An asset recycling frameworkcould address these challenges, not by reducing the public balance sheet but by mobilizing it. Governments at all levels own assets—from pipelines to airports, power utilities to bridges—that can be monetized. Under a brownfield-to-greenfield model, governments could lease or divest mature assets, converting dormant public wealth into productive economic flows, and reinvest the proceeds in new infrastructure. When required, federal incentive payments could be used to encourage provincial and municipal participation. The benefits are clear:
-
For government, fiscal capacity is created without raising taxes or issuing public debt. Instead, governments rotate capital from mature assets to high impact infrastructure.
-
For citizens, new infrastructure is created without taxes being raised.
This model does not introduce new costs, but it does reallocate who pays, which is where the (unavoidable) trade-offs enter. Shifting the burden from general taxpayer to direct user fee can create political friction. This is despite its economic logic, which can improve fairness (since costs align with usage) and enhance efficiency (since pricing disciplines demand while supporting maintenance). Governance is key to both program success and public support.
Public capital is most valuable at the high-risk, early-stage of development, while private capital is well suited to long-lived, de-risked assets. An asset recycling frameworkcould help governments achieve fiscal balance while generating the velocity that is part of the dynamism of a market economy. Australia’s asset-recycling program illustrates the potential: $2.3 billion in federal incentives catalyzed $15 billion in incremental infrastructure investment over five years, accelerating infrastructure development without increasing public debt.
To ensure the asset recycling framework is effective, it could include:
-
Clear eligibility criteria focused on mature, revenue-generating assets.
-
Ring-fencing the proceeds of divestitures for new infrastructure investment (not general revenue).
-
Transparent valuation and governance standards.
This build-prove-privatize model would attract private capital and enable productivity-enhancing investment in core infrastructure without straining public finances.
Risk Capital
Scale-enabling procurement that fosters innovation
The scale mismatch in Canada is most pronounced among mid-size firms. Large pools of institutional capital like pension funds require projects to meet minimum size, maturity, and cash-flow thresholds. Yet, many Canadian projects and enterprises are either too small or too early-stage to qualify.
Commercial-enabling procurement can help bridge this gap, but the model must evolve from an administrative function to an industrial policy tool. Rather than buying platforms, government should purchase capabilities through outcome-based contracts. Government would act as anchor customer, channeling public demand to create revenue certainty for projects and companies that struggle to access capital because of commercialization risk.16 Smart procurement would crowd-in private capital, harness competition, transfer risk, and encourage innovation, creating a capital formation cascade.
Multi-year production runs, fleet standardization, and lifecycle sustainment contracts could convert one-off purchases into durable industrial capability. Sustainment and upgrades generate recurring revenue streams, skilled employment stability, and domestic IP control. Canada could continue to experience persistent capital leakage long after the initial procurement decision. Here the financial architecture matters: anchor contracts enable project finance and asset-backed lending, while long-term off-take agreements materially lower weighted average cost of capital by making debt viable earlier in the development lifecycle. This ‘butterfly effect’ could transform procurement into broad-based capital formation, graduating Canadian firms from perpetual Tier-2 suppliers to globally competitive prime contractors.
NASA’s Commercial Crew and Cargo Program (C3PO) provides an illustrative example. Historically, NASA designed, owned, and operated its assets using cost-plus contacts with heavy bureaucratic oversight and limited commercial reuse. After 2005, NASA flipped the model—transforming the playbook from ‘build and own’ to ‘buy and use.’ NASA became an anchor customer, purchasing services from private companies that design and own multi-customer assets. Launch costs fell 10-fold, with reusable rockets, autonomous docking, and space tourism some of the notable innovations.
Applied in Canada, the model could:
-
Act as a strategic demand signal. Build on the anchor customer model to provide sustained demand through long-term contracts, reducing commercial uncertainty, and incentivizing the significant capex required for frontier technology development. Advance purchase commitments with guaranteed minimum volumes could help crowd-in risk capital.
-
Performance-based contracting. Transition from cost-plus to fixed-price service delivery for mature assets, using competitive tendering that rewards enhanced capability while managing cost overrun risks. Deploy performance metrics tied to capability and delivery timing, with corresponding rewards (favourable pricing, bonuses) and penalties (fines for delays).
-
Administrative streamlining. Reduce bureaucratic burden on contractors, allowing them to focus scarce resources on capability development, productivity improvements, and serviceability. To accelerate programs, consider developing a transaction authority that sits outside the traditional procurement system that can award follow-on production contracts without having to compete for it (assuming success at delivering needed capabilities on budget).
The result would be aligned incentives, a clearer commercialization pathway for small and medium-sized firms, and a more dynamic eco-system of companies with the enhanced ability to service domestic needs while competing internationally.
Foreign Capital
Improve investor returns and certainty by reforming the CIT and ICA regimes
Global investors assess jurisdictions based on openness to investment and their structural competitiveness. Hospitality to foreign investment and tax policy are critical inputs in the decision matrix.
Canada’s framework for reviewing foreign investment—the Investment Canada Act (ICA)—is a source of friction in attracting global capital. Ensuring national security and a net benefit to Canada are sound goals, but the application of the framework can create uncertainty, opacity, and extended timelines. The reactive and discretionary nature of the system creates unpredictability, which acts as a deterrent to foreign investment. Reform would improve investor certainty while boosting after-tax returns.
-
The system for screening and approving foreign investment can be made more rules-based and strategically aligned by distinguishing between sectors that are commercially or strategically sensitive and sectors where capital is actively welcomed. Reforms could preserve national security while enhancing the attractiveness of Canada as an investment destination by:
-
Introducing fast-track pathways for low-risk investments such as minority stakes, investments from trusted allies or projects in cleared sectors.
-
Creating strategic investment corridors with preferred allies, aligning policy, capital and industrial strategy in areas like mining, energy, and advanced manufacturing.
-
These changes would shift the ICA from a perceived barrier to a predictable facilitator for foreign investment that simultaneously safeguards national interests while welcoming global capital.
Canada also requires a more competitive corporate income tax regime. Since 2018, when the U.S. and others reformed their systems, Canada lost its corporate tax advantage. That’s why leading tax experts are calling for ‘big bang’ tax reform that incentivizes investment rather than creating ever-more layers of distortionary tax credits. We see two options to boost after-tax returns on capital that are worth further study:
-
Canada could tax distributed profits while exempting retained earnings. Estonia and Latvia offer full exemption for retained business profits, for example, and have been successful at attracting foreign direct investment. Assuming this option could be made compliant with international tax treaties and OECD minimum tax rules, Canada could:
-
Tax profits that are distributed—dividends, buy-backs, and deemed distributions.
-
Exempt profits that are retained within the business, incentivizing reinvestment in R&D, IP formation, machinery and equipment, and business expansion.
-
Importantly, this approach could be made revenue-neutral for governments by eliminating the impact of other inefficient and distortionary tax incentives, which would become redundant.17
-
Despite being revenue-neutral for government, this reform would make Canada a more attractive destination for investment by meaningfully lowering the marginal effective tax rate. It would also directly and materially reward firms that channel capital into productive activities in Canada.
-
A suite of reforms which would improve Canada’s tax competitiveness by:
-
Lowering the federal CIT rate. Reduce statutory corporate income tax rates to enhance Canada’s competitiveness relative to other jurisdictions, particularly following recent U.S. tax reforms.
-
Full expensing of capital investments. Allow businesses to immediately deduct the full cost of machinery, equipment, and intellectual property investments rather than depreciating them over time. This would provide immediate cash flow benefits and reduce the cost of capital for growth-oriented investments.
-
Enhanced capital gains treatment. Increase capital gains exemption limits for business investments and expand business rollover allowances to facilitate reinvestment and business succession planning, while maintaining fairness.
-
This comprehensive approach would make a strong statement about Canada’s commitment to being a preferred destination for global capital while maintaining revenue sustainability and international tax compliance.
State Capital
Leverage public demand to crowd in private capital
Canada faces a persistent challenge in financing projects and technologies that are commercially viable over the long term but fail to clear private investment hurdles in the near term. These are typically first-of-a-kind (FOAK) technologies or strategic assets—small modular nuclear reactors, critical minerals, rare earth processing, carbon capture—where long lead times, uncertain demand, or price volatility crate a gap between risk tolerance and Canada’s strategic interests.
The issue is not the absence of capital but of risk-bearing capacity. Private investors unwilling to absorb early-stage uncertainty when timelines stretch over decades and revenue streams remain unclear. The result is underinvestment precisely in the industries that are most critical to Canada’s industrial and geopolitical positioning.
A more active deployment of state capital can help close this gap—not by displacing private investment, but by reshaping the risk-return profile to crowd it in. A range of instruments can be utilized:
-
Public-equity stakes in early-stage or systemically important projects or firms, allowing the state to absorb initial risk while preserving upside participation.
-
Price floors to reduce commodity volatility and support project viability, particularly in shallow or immature markets such as rare earth mining and processing.
-
Long-term offtake agreements that provide revenue certainty, enabling project developers to secure debt or equity financing against contract demand for long horizon projects.
-
Strategic stockpiling to stabilize markets and signal sustained public demand in priority sectors.18
These tools are already deployed in peer jurisdictions, particularly in critical minerals and energy, where governments act as market makers rather than market observers. An outstanding question is not whether to use these tools— but how to deploy them at sufficient speed and scale.
This capital formation framework is about restoring Canada’s investability by reducing uncertainty, creating scale where capital mandates require it, transferring early-stage risk away from private investors and improving after-tax returns on productive investment.
By lowering the risk-adjusted cost of capital across strategic industries—oil and gas, electricity, mining, defence, space, and agriculture and food processing—Canada can convert its latent advantages into bankable projects.
But this great opportunity won’t last. In an era of intensified competition, capital will flow to countries that make investments viable. Canada needs to move quickly–turning ambition into action.

Download the Report
Contributors
Lead Authors:
Jordan Brennan, Managing Director, RBC Thought Leadership
Farhad Panahov, Economist, RBC Thought Leadership
John Intini, Senior Director, Editorial, RBC Thought Leadership
Yadullah Hussain, Managing Editor, RBC Thought Leadership
Lavanya Kaleeswaran, Director, Digital Marketing and Production, RBC Thought Leadership
Caprice Biasoni, Design Lead, RBC Thought Leadership
A. Methodology and Data Sources
Oil and Gas
For the oil and gas industry, the capital required includes:
-
Brownfield investment to incrementally increase conventional oil and the oil sands output;
-
Greenfield investment to develop new oil sands production capabilities;
-
New oil pipeline infrastructure to strengthen export capacity;
-
New investment in natural gas extraction;
-
New LNG export facilities;
-
Investments for carbon capture projects.
Our Trend Growth Scenario for oil borrows production forecasts from RBC Capital Markets.
-
Production grows from 5.1 million barrels per day (Mb/d) in 2024 to 5.9 Mb/d by 2030, then plateaus. The incremental output is proportionately split between conventional oil and the oil sands.
-
Pipeline optimization and improved efficiency enables more oil to flow through existing infrastructure. We assume either the Enbridge Mainline adds 300,000 barrels per day or the Trans Mountain—via pump stations—adds 245,000 barrels per day beyond 2027. We assume no major greenfield production sites are built; increased output is sourced from current sites.
-
Capital spending figures come from the Canadian Association of Petroleum Producers and the Canadian Energy Regulator. To calculate an annual capex estimate for the coming decade, we took the average capex spent per barrel of oil production from 2017 to 2023 for conventional oil ($38.80) and for the oil sands ($9.90).
-
Our Trend Growth Scenario for natural gas includes completion of the Woodfibre and Cedar LNG facilities. Drawn from Natural Resources Canada, the combined cost is estimated to be $11.5 billion. This enables an additional 0.7 bcf/d of new export capacity.
In our Step Change Scenario, we assume two new oil pipelines are approved:
-
Keystone XL adds 0.83 Mb/d and a pipeline from Alberta to British Columbia (loosely inspired by Northen Gateway) adds 1 Mb/d in capacity. To generate an estimated cost for each pipeline, we took the cost-per-kilometre for the original Northern Gate pipeline (provided by the National Energy Board) and adjusted it for inflation and cost overruns. We estimate that each pipeline costs approximately $30 billion. We assume that pipeline construction begins in 2028 and will take four years to complete. This adds ~1.2 Mb/d in oil sand production capacity. This estimate includes a 70:30 split between bitumen and condensate in the pipelines themselves.
-
The added pipeline capacity enables greenfield investment in oil sands at a cost of ~$56,000 per barrel per day. This enables total Canadian oil production to grow to 7.1 Mb/d by 2035.
-
Our Step Change Scenario includes three additional LNG export terminal projects: LNG Canada Phase 2, Tilbury, and Ksi Lisims. The estimated costs are drawn from publicly available sources. Collectively, these export terminals require ~$55 billion in capital spending. These terminals add 3.75 Bcf/d of export capacity. We assumed $10 per barrel of oil equivalent (BOE) in capex cost for the added natural gas extraction.
-
Our step change scenario imagines heavy investment into carbon capture and sequestration (CCS) infrastructure. We assume major projects go forward, including the Pathways Alliance’s Phase 1, at a cost of $24 billion. We assume two additional projects of a similar scale go forward. We loosely estimate the total investment for CCS projects amounts to $80 billion over 10 years, based on publicly available estimates. We source project-level CCS data from the BloombergNEF Carbon Capture Capacity Database and include approximate costs from various sources, including news articles.
Electricity
For the electricity sector, the capital required includes:
-
Initial project costs to build power plants that are already in various stages of development or have been announced;
-
The costs to replace or upgrade the power grid, including transmissions and distribution lines, enabling new connections and reinforcing systems.
Our Trend Growth Scenario sees projects in various stages of development proceed to the construction phase.
-
Electric capacity grows by ~69 GW across all energy sources. We account for projects where permitting processes have started, where projects have secured financing, and where projects are already in construction phase, and power projects that have been announced. We rely on the S&P CapIQ power projects database. The data provides capacity and construction cost measures for projects by technology type.
-
We also include the Bruce C and Darlington SMR nuclear projects in our trend growth scenario. Combined, they provide 6 GW of new capacity. OPG estimates the cost of the Darlington SMR at ~$21 billion. For Bruce C, we rely on MIT’s Center For Advanced Nuclear Systems to cost AP1000 reactors, which come in at US$8,300-$10,375 per kW.
-
We use an illustrative deployment schedule of large-scale nuclear from Ontario’s integrated energy plan, evenly allocating construction costs over time. For projects where deployment is expected to take place beyond 2035, we assume a portion of the cost by 2035.
We compare this capacity buildout to the Canada Energy Regulator’s (CER) Energy Futures 2026 projections. Our trend growth scenario is largely in line with new capacity requirements under CER’s ‘Current Measures’ scenario, which assumes a limited additional policy-driven push towards electrification and greening of the grid.
Investments for grid maintenance and enhancement are from BloombergNEF’s projections. These include investments in both transmissions and distribution power lines, and grid substations, as related to replacing aging assets, building new connections, and conducting system reinforcement.
While BloombergNEF’s scenarios do not directly correlate to scenarios developed by CER (‘Economic Transition Scenario’ (ETS) used for our trend growth), they also assume no further policy support for the energy transition beyond existing measures, similar to CER’s ‘Current Measures’.
In our Step Change Scenario, we incorporate the additional capacity needed for Canada to remain on the net-zero track as projected in CER’s ‘Net-Zero’ scenario. We also include four additional nuclear projects—Wesleyville, Saskatchewan SMR, Point Lepreau and Peace River—which add an additional ~13 GW at an estimated cost of $149 billion, of which $43 billion is allocated by 2035. Under the step change scenario, total capacity grows by 98 GW.
| Technology | CER ‘Current Measures growth 2025-35 (MW) | CER ‘Net-Zero’ growth 2025-35 (MW) | Projects in development (MW) | Announced projects (MW) | Additional capacity in Step-Change scenario |
|---|---|---|---|---|---|
| Solar | 10,826 | 10,175 | 9,461 | 4,003 | – |
| Wind | 36,128 | 58,526 | 17,745 | 3,493 | 37,288 |
| Hydro | 6,318 | 6,338 | 1,016 | 6,111 | – |
| Natural Gas | 982 | 5,039 | 7,075 | 4,438 | – |
| Battery | 4,842 | 5,413 | 5,713 | 3,455 | – |
| Nuclear | 2,112 | 2,112 | 6,000 | – | 13,175 |
Similar to the Trend Growth Scenario, we use BloombergNEF’s projections for investments related to grid infrastructure. The Net Zero Scenario describes a challenging yet achievable stretch to get on track for net zero by 2050. While it doesn’t directly map onto CER’s ‘Net-Zero’ scenario, it offers a directional pathway.
| Project | Case | Capacity (MW) | Cost ($B) | Estimation | Timeline |
|---|---|---|---|---|---|
| Darlington SMR | Base | 1,200 | 20.9 | OPG19 | 2029-3520 |
| Bruce C | Base | 4,800 | 58.3 | MIT CANES21 | 2031-4122 |
| Peace River | Growth | 4,400 | 39.3 | Derived estimate23 | 2029-4224 |
| Point Lepreau | Growth | 300 | 5.2 | Derived estimate25 | 2030-3426 |
| Sask. SMR | Growth | 315 | 5.5 | Derived estimate27 | 2030-3428 |
| Wesleyville | Growth | 8,160 | 99.1 | MIT CANES | 2033-4729 |
Mining
Capital requirements for mining sector includes a combination of:
-
Capex needed for general operations;
-
Costs of construction of new greenfield projects.
We use a combined approach: general economic modelling to estimate capital spending for the Trend Growth Scenario; and a bottom-up, project-based approach that draws on data from S&P Capital IQ for the Step Change Scenario.
In our Trend Growth Scenario, we utilize the Cobb-Douglass production function using trends over past 10 years, assuming the relationship between investment and output matches historical patterns. The Cobb-Douglas production function quantifies the interaction between labour, capital and productivity in relationship to GDP. We use Statistics Canada Table 36-10-0217-01 to establish the relationship between multifactor productivity (MFP), capital (K) and labour (L) inputs, and real GDP, expressed as follows:
First, we derive a general value for elasticity the factor α, which is ~0.7 on average during 2012-2021. We use the following tables for data on mining and quarrying (except oil and gas) – NAICS 212:
-
36-10-0096-01 for fixed non-residential capital formation;
-
36-10-0489-01 for employment;
-
36-10-0434-03 for GDP.
Once the model is set, we apply a 10-year CAGR rate for real GDP, labour, and productivity to extend projections under the Trend Growth Scenario. Real GDP grows at page of 0.6% annually into 2035, which implies ~$139 billion total investment flows into the industry over the next decade, based on historical depreciation rate of ~16%.
Investments here are in reference to fixed non-residential capital flows. This includes construction of industrial buildings such as plants, machinery and equipment, and intellectual property products that are the result of R&D and similar activities.
In our Step Change Scenario, we stack the cost of constructing more mines in Canada across a range of metals and minerals: gold, zinc, iron ore, potash, U3O8, copper, lithium, graphite, nickel, rare earth elements (primarily lanthanides), and cobalt. We obtained a dataset of 1,000+ projects currently operating or in various stages of development. To model the Step Change Scenario, we took a bottom-up approach by examining:
-
More than 1,000 active and inactive mining sites across Canada;
-
50+ late-stage projects across base metals (zine and copper, for example), precious metals (gold, silver), and critical minerals (lithium, graphite);
-
100+ early-stage opportunities with known costs or reserves.
We refer to projects in their pre-feasibility stage (reserves development, advanced exploration, prefeasibility and scoping) as ‘early stage’ projects, and those already in feasibility stage or where construction has started as ‘late stage’ projects.
As mining projects move further along the development pathway, more information becomes available. As such, we narrow the focus to 228 active projects with information on initial capital costs or production capacity estimates. Some 95% of late-stage projects have information available.
For projects where only production capacity information is available, we apply an estimated average cost per production capacity for the respective metals or minerals. The Step Change Scenario sees development of all late-stage projects, as well as 10% of early-stage projects proceed to completion over 10 years.
| Metal | Total count | Active projects | Early Stage: Projects with cost or capacity info | Late Stage: Projects with cost or capacity info |
|---|---|---|---|---|
| Gold | 446 | 296 | 69 | 24 |
| Silver | 32 | 17 | 2 | – |
| Zinc | 91 | 51 | 8 | 7 |
| Copper | 163 | 96 | 24 | 3 |
| Lithium | 32 | 32 | 12 | 7 |
| U3O8 | 47 | 21 | 7 | 3 |
| Graphite | 22 | 14 | 5 | 2 |
| Nickel | 69 | 39 | 11 | 5 |
| Potash | 13 | 7 | 4 | 2 |
| Lanthanides | 14 | 13 | 6 | 2 |
| Iron Ore | 53 | 34 | 11 | 9 |
| Diamonds | 11 | 5 | 2 | – |
| Platinum | 5 | 2 | 1 | – |
| Cobal | 3 | 3 | 1 | 1 |
| Total | 1,001 | 630 | 163 | 65 |
Defence
Capital requirements for the defence industry are comprised of a mix of R&D and machinery & equipment, all tethered to different assumptions of government defence spending. According to data from Innovation, Science and Economic Development Canada’s (ISED) State of Canada’s Defence Industry report, the industry generates revenues from domestic sales and exports, with an equal split between the two. And sales to the federal government make up ~two-thirds of domestic revenues.
We assume spending on capital equipment by the federal government is the primary source of the revenue for the domestic industry, and one that varies between the scenarios. We assume other revenues expand at a nominal GDP growth rate of 3.5%.
Historically, M&E and R&D spending have made up ~5.5% of revenue. We harness this ratio to derive the capital expenditure needed by the industry to meet new revenue trajectory.
In our Trend Growth Scenario, we assume Canada reaches only 2% of NATO spending. Spending is allocated across personnel (50%), operations and readiness (25%), capital equipment (20%), and infrastructure (5%), which is the historical mix, with the ‘Buy Canadian’ provision boosting the Canadian content share from 30% to 50% by 2035 (in a linear rise). The federal government has signaled that, historically, some 70% of defence spending was allocated to foreign producers, leaving 30% for the domestic market. Ottawa wants to invert that ratio over the coming decade, tilting the balance 70/30 towards Canadian firms.
In our Step Change Scenario, the primary difference is that Canada is on trajectory to meet 5% NATO spending requirement, of which 3.5% is spend on core defence goods. We assume the spending mix remains the same. Personnel spending remains similar to the Trend Growth Scenario, and readiness and infrastructure spending grow proportionally at the historical allocation mix of 25% and 5%, respectively. The remainder of defence spending focuses on acquiring new (or replacing ageing) capital equipment, which offers increased revenue for the industry, requiring further investment to meet the higher demand.
Space
Data on the Canadian space economy is limited. The Canadian Space Agency (CSA) publishes an annual State of the Canadian Space Sector Report, including revenue, gross domestic product, employment and exports. Company-level data is available for publicly traded firms. Our method blended data from both sources to model sales revenue, GDP and capital expenditure across the Trend Growth and Step Change scenarios.
The calculations were made through a series of steps.
-
To forecast sales revenue and GDP to 2035 in the Trend Growth Scenario, we derived the longest possible compound annual historical growth rate using CSA data (2014-2022), which we assume will govern the future growth of sales revenue (-0.8%) and GDP (1%) going forward.
-
To forecast sales revenue under the Step Change Scenario, we assume Canada doubles its global market share by 2035, rising from ~1.1% of the global market in 2022 to 2% by 2035. In partnership with McKinsey & Company, the World Economic Forum projects the global space market will grow to $755B USD by 2035, putting Canada’s share at CA$21B. This scenario thus sees the space market grow 4x in 10 years.
-
To infer the capital required under the two scenarios, we used data for publicly traded space firms. From 2020-2024, Canada’s publicly traded space firms had a capex-to-revenue ratio of 36% (on a weighted average basis). That figure was skewed by heavy investments from a few key firms that are unlikely to be repeated in the future, even under the Step Change Scenario. To better anchor the capex-to-revenue ratio, we included a few mature aerospace companies, which have lower capital requirements. On a weighted-average basis, this brought the capex-to-revenue ratio down to ~10%.
-
Across the Trend Growth and Step Change scenarios, we multiplied annual sales revenue by 10% to determine the annual capex, aggregating the figures over 2025-2035 to determine the total capital required
Agriculture and Food Processing
For the agriculture industry, the capital required includes:
-
Public and private sector support for agricultural knowledge and innovation through expenditure on R&D and IP;
-
Among food processing and manufacturing, capital expenditures on non-residential construction, machinery and equipment to optimize processes at the plant-level;
-
Among large commercial farmers, capital deepening through the adoption of ag-tech solutions.
With data from USDA, we explore Canada’s agricultural productivity across multi-decade periods. The trend suggests productivity growth peaked in 1990s-2000s and declined thereafter. From Statistics Canada’s Table 36-10-0096-01 we chart investment trends over the same period. We compare real investment flows over time as well as investment flows relative to the industry’s GDP. We observe high investment rates (both in real terms and as share of GDP) in the mid-1970s and mid-1980s, which are associated with leading productivity gains in the decades that followed. From the OECD’s Agricultural policy monitoring database we track public support for research and development activities dating back to 1986. The trends show declining spending in real terms, as share of industry revenue, and relative to agricultural GDP.
In our Trend Growth Scenario, we extend the average investment trends of the past 10 years. This suggests ~$10 billion annual investment in non-residential construction, machinery and equipment purchases and ~$1.3 billion combined industry IP investments and public support for R&D.
Our Step Change Scenario assumes Canada repeats the investment surge witnessed in the 1970s-1980s, which could raise productivity through more innovation, stronger advanced tech and practice adoption, and investments into efficiency gains. Industry capex increases to ~$13.8 billion annually to match peak levels in 1970s, and combined public and private R&D-related investments rise to $1.6 billion, matching peak levels in 1980s.
Combined total rises to ~$18.9 billion if instead investment levels are calibrated on proportional size to industry GDP – where industry capex investment stood at ~34% (vs 21% currently) as the share of industry GDP on average during 1973-1982, and combined public and private R&D spending was 4.2% (vs 2.7%) during 1986-1995.
For the food manufacturing industry, we tailor the Trend Growth and Step Change scenarios to Canada’s share of global exports aligned with pathways developed in Food first: How agriculture can lead a new era for Canadian exports. Canada’s current market share of global agriculture and agri-food exports stands at 3.7%, and by 2035, global agriculture and agri-food export market (HS codes 1-24) is projected to grow by 0.6% annually. In our Trend Growth scenario for the food manufacturing industry, we assume Canada only maintains it current global standing. This implies 0.8% annual growth in exports of food manufacturing products. Our Step Change scenario for food manufacturing industry assumes Canada increases its export market share by 50%, capturing about US$66 billion by 2035.
In both scenarios, to estimate overall production levels (Statistics Canada table 36-10-0488-01) we combine projected exports with domestic consumption. Domestic consumption is based on historic per capita levels – ~$2500 of real output (adjusted to 2025 price levels) per person, and by 2035, Canada’s population is expected to reach 44.3 million. Overall, food manufacturing production is projected to grow from an estimated $144 billion in 2025 to $155 and $173 billion by 2035 for Trend Growth and Step Change scenarios, respectively. We use a recent spike in investments since 2018, which led to 20% increase in estimated real output, compared to the historic average of 1.9 investment per output ratio during 2007-2017 to derive capital requirements for production capacity increase aligned with our Trend Growth and Step Change scenarios.
B. References
Ampofo, K. et. al. 2024. Transition Metals Outlook 2025. New York: Bloomberg New Energy Finance.
Ashton, Lisa. 2024. Food first: How agriculture can lead a new era for Canadian exports. Toronto: RBC Thought Leadership.
Baskaran, G., D. Wood. 2025. Critical Minerals and the Future of the U.S. Economy. Washington: Center for Strategic and International Studies.
Bataille, M., J. Francis and J. Potin. 2025. The (Re)Convergence of Europe’s Space and Defence Industries. ESPC Report 94. European Space Policy Institute: Vienna.
Bloomberg NEF. 2024. Transition Metals Outlook. New York: Bloomberg Finance LP.
Bryce Tech. 2025. Start-Up Space: Private Sector Space Investment Activity in 2024. Alexandria, VA: Bryce Tech.
Canadian Space Agency. 2023. What we heard report: Consulting Canadians on a modern regulatory framework for space. Ottawa: Government of Canada.
Cembalest, M. 2025. Heliocentrism: 15th Annual Energy Paper. New York: J.P. Morgan Asset Management.
Chollet, D. and S. Kapnick. 2025. Power Rewired: The New Map of Energy and Geopolitics. New York: JPMorganChase Center for Geopolitics.
Competition Bureau Canada. 2023. Competition in Canada, 2000–2020: An economy at a crossroads. Ottawa: Government of Canada.
Conference Board of Canada. (2024). Innovation report card 2024: How Canada performs. Ottawa: Conference Board of Canada.
D’Souza, C., T. Grieder, D. Hyun, J. Witmer. 2020. The Canadian corporate investment gap. Staff Analytical Note No. 2020-15. Ottawa: Bank of Canada.
Globerman, S. 2024. The weakness of corporate investment in Canada, 2001–2021. Vancouver: Fraser Institute.
Gulab, S., and G. Lhermie. 2025. ‘A Case for Reinforcing Agri-food Research and Development Spending: Where Does Canada Stand Internationally?’, The Simpson Centre, 18 (3). Calgary: University of Calgary School of Public Policy.
International Energy Agency. 2023. Emissions from Oil and Gas Operations in Net Zero Transitions. Paris: IEA.
International Energy Agency. 2025. Oil 2025: Analysis and Forecast to 2030. Paris: IEA.
Jurgens, J. and R. Brukardt. 2024. Space: The $1.8 Trillion Opportunity for Global Economic Growth. Geneva: World Economic Forum.
Kanji, S. and A. Parsons. 2024. State of the Canadian Space Sector Report. Longeuil, QC: Canadian Space Agency.
Khosla, J., Y. Kokkinos, C. Turner. 2025. Build big things: Accelerating major project delivery in Canada. Ottawa: Public Policy Forum.
Lindenmoyer, A. 2014. Commercial Orbital Transportation Services: A New Era in Spaceflight. Houston: NASA.
Manalo, P. 2023. ‘Discovery to production averages 15.7 years for 127 mines’, S&P Global, June 6.
Minister of Industry. 2014. Canada’s Space Policy Framework. Ottawa: Canadian Space Agency.
Minister of Innovation, Science and Economic Development. 2019. Exploration, Imagination, Innovation: A New Space Strategy for Canada. Ottawa: Canadian Space Agency.
Mintz, J. 2025. ‘Why Canada Needs ‘Big Bang’ Corporate Tax Reform’, Perspectives on Tax Law & Policy, 6 (4): 1-4.
Mollins, J., P. St.-Amant. 2019. The productivity slowdown in Canada: An ICT phenomenon? Staff Working Paper No. 2019-35. Ottawa: Bank of Canada.
Natural Resources Canada. 2024. 10 Key Facts on Canada’s Critical Minerals Sector. Ottawa: Government of Canada.
OECD. 2023. The Space Economy in Figures: Responding to Global Challenges. Paris: OECD.
OECD & FAO. 2025. Agricultural Outlook 2025–2034. Rome: OECD Publishing.
Pardy, G., R. Mann, C. Neibert, M. Harvey, R. Kwan, M. Choy, N. Ng. 2025. Energy Insights: Awakening the Northern Giant. Toronto: RBC Capital Markets.
Robson, W., M. Bafale. 2024. Underequipped: How weak capital investment hurts Canadian prosperity. Toronto: C.D. Howe Institute.
Sharp, A., T. Sargent. 2023. ‘The Canadian productivity landscape: An overview’, Canadian Tax Journal, 71:4, pp. 1125-47.
Smith, T., K. et. al. 2025. Missions for prosperity: Building Canada’s next era of economic growth. Toronto: Boston Consulting Group & Centre for Canada’s Future.
Space Capital. 2025. Space Investment Quarterly, Q3-2025. New York: Space IQ.
Theron, G. 2025. Raising business sector productivity: Economic Survey of Canada. Paris: OECD.
Mohamad Yaghi, 2023. Farmers Wanted: The Labour Renewal Canada Needs to Build the Next Green Revolution. Toronto: RBC Climate Action Institute.
C. Acknowledgements
The authors would like to thank the following people, whose insights informed our thinking and writing, as well as the numerous experts who wished to remain anonymous:
Agnico Eagle Mines: Alden Greenhouse
Arrell Food Institute at the University of Guelph: Evan Fraser
Bennett Jones: John Baird
Bombardier: Francis Richer De la Flèche
Brookfield Asset Management: Cyrus Madon
Bruce Power: James Scongack
Canada Pension Plan Investment Board: Andrew Alley, Bruce Hogg, Tara Perkins
Canadian Climate Institute: Kate Harland
Canadian Food Innovation Network: Richa Gupta
Export Development Canada: Sven List
MDA Space: Guillaume Lavoie, Patrick Nihill
NASA: Alex MacDonald (Alumni)
NordSpace: Rahul Goel
Ontario Ministry of Agriculture: Steve Duff
Ontario Teachers’ Pension Plan: Jonathan Hausman
Prospectors & Developers Association of Canada: Jeff Killeen
RBC: Tracy Antoine, Daniel Chornous, Louis Derlis, Chinyere Eni, Andrew Hay, Ken Herbert, Sara Gelgor, Stuart Kedwell, Robert Kwan, Eric Lascalles, James McGarragle, Lorna McKercher, Rob Nicholson, Greg Pardy, Chris Redgate, Hugh Samson, Michael Scott, Michael Siperco
Space Canada: Brian Gallant
Teck Resources: Jeff Hanman, Dale Steeves
The Simpson Centre for Food and Agricultural Policy: Sabrina Gulab
University of Calgary: Robert Johnston, Jack Mintz, Trevor Tombe
Volatus Aerospace: Greg Colacitti, Glen Lynch, Abhi Singhvi
In focusing on these industries, we do not mean to imply that government should pick winners and losers. Instead, we target these industries because they are top of mind for global policymakers. Government should focus on strengthening Canada’s economy across the board by making Canada a more attractive destination for investment.
Our estimates about global capital pools vary. We source and cross-reference these figures from McKinsey, Boston Consulting Group, and the Think Ahead Institute. All three sources are broadly in line with their estimates.
Our analysis does not attempt to forecast demand patterns, market prices, or labour requirements. While all valid considerations, they are outside the scope of this study.
Canada’s weak investment performance has been documented across multiple analytical perspectives by leading economic institutions. The Bank of Canada (Mollins and St.-Amant 2019; D’Souza et al 2020) has examined both the productivity slowdown through an ICT lens and identified a persistent corporate investment gap. Recent comprehensive assessments (Smith 2025; Competition Bureau Canada 2023; Conference Board of Canada 2024) have explored strategies to foster economic growth through enhanced competition and innovation policy. Others have benchmarked Canada’s productivity performance and diagnosed the causes of weak business investment (Sharp and Sargent 2023; Globerman 2024; Robson and Bafale 2024; Theron 2025). Others still have imagined what would be required to catalyze growth through major project delivery (Khosla et al 2025).
RBC’s Reconciliation Action Plan provides a blueprint for how to engage Indigenous voices as key partners in the journey.
On the strategic significance of critical minerals, including for green energy, see Baskaran and Wood (2024) and Bloomberg NEF (2025).
Bataille, M., J. Francis and J. Potin. 2025. The (Re)Convergence of Europe’s Space and Defence Industries. ESPC Report 94. European Space Policy Institute: Vienna.
Broader definitions of the space economy—including downstream applications—place the opportunity closer to US$1.8T by 2035
See USDA for an analysis of productivity trends in agriculture
The government acting as anchor customer is important, but so too is managing the concentration risk and monopolistic tendencies associated with public procurement, which is ideally hedged through diversification of (government and non-government) customers.
In recent years, the corporate sector paid roughly $140 billion in taxes at a blended average rate of 26%. This reflects the impact of various tax incentives, which materially lowers the tax base. Dividends paid to residents and non-residents are approaching $400 billion. Combined with stock repurchases, distributed corporate earnings is about $500 billion. If the various corporate tax incentives were abolished, making the system simpler, fairer, and neutral, the tax base would be nearly equal, which means the fiscal impact would be minimal.
Variants of these instruments are already under discussion in the G7 Critical Minerals Action Plan to secure supply chains critical to defence, advanced manufacturing, and clean energy.
Capital IQ, Power Projects database. Power plant profile.
MIT Center for Advanced Nuclear Systems, 2024 Total Cost Projection of Next AP1000. We apply average of the range (US$8,300-10,375/kW) for cost of AP1000s type power plant.
We used costs estimates from previous projects from The Ontario Clean Air Alliance Research. We adjusted values based on Industrial Product Price Index, and applied average cost per MW.
Applied OPG estimate for Darlington SMR based on $/MW.
No official timeline; applied same timeline as for Saskatchewan SMR project due to similar scale.
Applied OPG estimate for Darlington SMR based on $/MW.
This article is intended as general information only and is not to be relied upon as constituting legal, financial or other professional advice. The reader is solely liable for any use of the information contained in this document and Royal Bank of Canada (“RBC”) nor any of its affiliates nor any of their respective directors, officers, employees or agents shall be held responsible for any direct or indirect damages arising from the use of this document by the reader. A professional advisor should be consulted regarding your specific situation. Information presented is believed to be factual and up-to-date but we do not guarantee its accuracy and it should not be regarded as a complete analysis of the subjects discussed. All expressions of opinion reflect the judgment of the authors as of the date of publication and are subject to change. No endorsement of any third parties or their advice, opinions, information, products or services is expressly given or implied by Royal Bank of Canada or any of its affiliates. This document may contain forward-looking statements within the meaning of certain securities laws, which are subject to RBC’s caution regarding forward-looking statements. ESG (including climate) metrics, data and other information contained on this website are or may be based on assumptions, estimates and judgements. For cautionary statements relating to the information on this website, refer to the “Caution regarding forward-looking statements” and the “Important notice regarding this document” sections in our latest climate report or sustainability report, available at: https://www.rbc.com/our-impact/sustainability-reporting/index.html. Except as required by law, none of RBC nor any of its affiliates undertake to update any information in this document.