

 EN
EN 

Canada is about to find out whether it can still build.
The next three years could mark the beginning of several major oil and gas projects: two LNG terminals (in addition to two already under construction), two oil pipelines, a carbon-capture facility, and the initial phases of oilsands expansions that could lead to an increase of up to a million barrels a day.
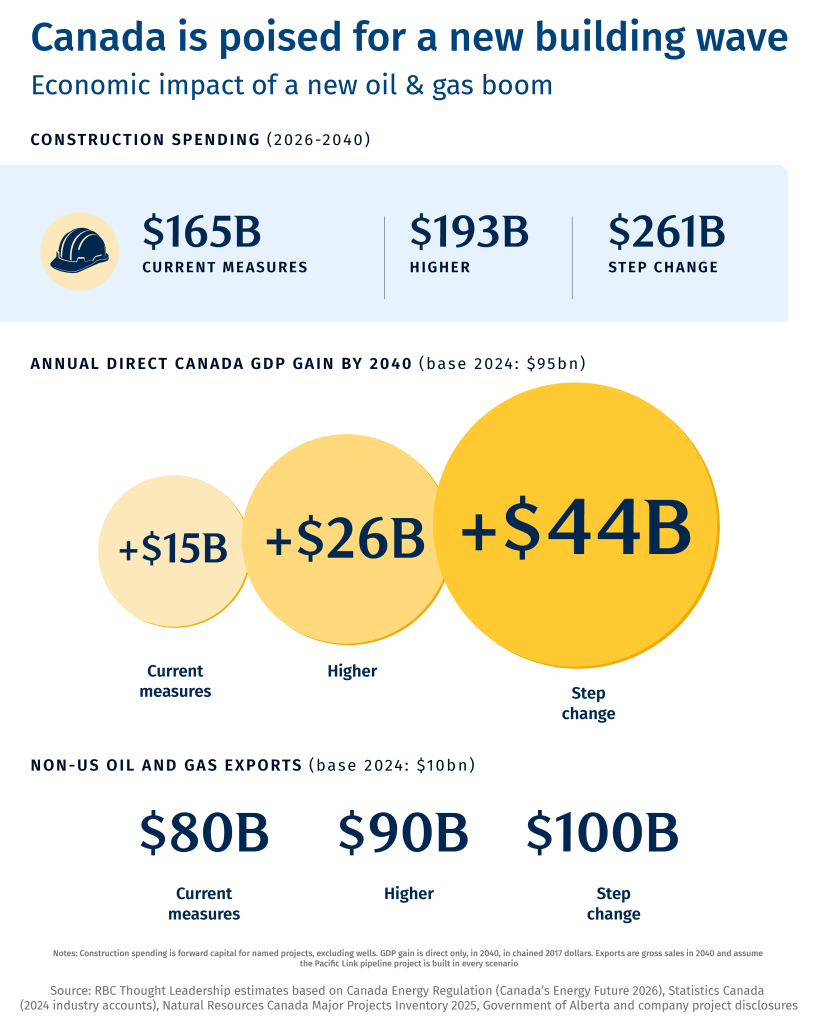
The slew of projects would anchor a total build of more than $200 billion through 2040,1 with economic impacts extending far beyond Alberta. Most of the construction would be in British Columbia with material demand running from Ontario steel plate to Saskatchewan line pipe. By 2040, an expanded oil and gas industry could add $44 billion more a year to Canada’s GDP, nearly a 50% increase from its current contribution of $95 billion.2
The timing matters. RBC Thought Leadership’s recent work with McKinsey & Company found foreign direct investment is becoming scarcer and more concentrated in future-shaping industries, energy key among them. Canada’s weak link for years has been speed–specifically, how long it takes to permit and build.3 But governments have taken some positive steps: Ottawa capped federal reviews at two years, and Alberta and B.C. have shortened and merged their own processes.4 It’s early days, but the signals are promising with two multi-billion dollars projects going ahead: the government-backed Alberta-to West Coast Pacific Link oil pipeline, and the private sector-led LNG Canada Phase 2.
What remains is the equally hard task of building at pace: having certified trades in the right place, ready supply of steel and pipe, a non-U.S. market for the barrels, and the logistics to ensure the economy can level out the fluctuations.
What’s proposed is not necessarily a bigger version of the last major energy boom between 2006-2014. At its peak, this build is a smaller share of the economy than the oilsands were in 2014, and Alberta’s own pace of growth is relatively ordinary, at least compared to 2006-2014.5
What makes it more of a nation-building effort this time around is that the build would run for 15 years, spanning more than one commodity, with much of the construction in B.C. The projects would tap the labour market around the same time other large-scale projects will be underway across the country. That’s assuming, of course, things go to plan. The last time the industry was in the building boom, it spent twice what Alberta’s own review had forecast and produced 12% less than projected.6
Getting things right requires careful management of three distinct but interconnected parts. Production without pipelines discounts every barrel; pipelines without production are empty; and growth of this size may not fit under Alberta’s oilsands emissions limit without carbon capture at scale (+16mt beyond the 100mt emissions “cap”). That will be spearheaded by the Oil Sands Alliance, comprising the country’s top five oil companies, to build the Pathways Project, a carbon dioxide (CO2) transportation network and storage hub.
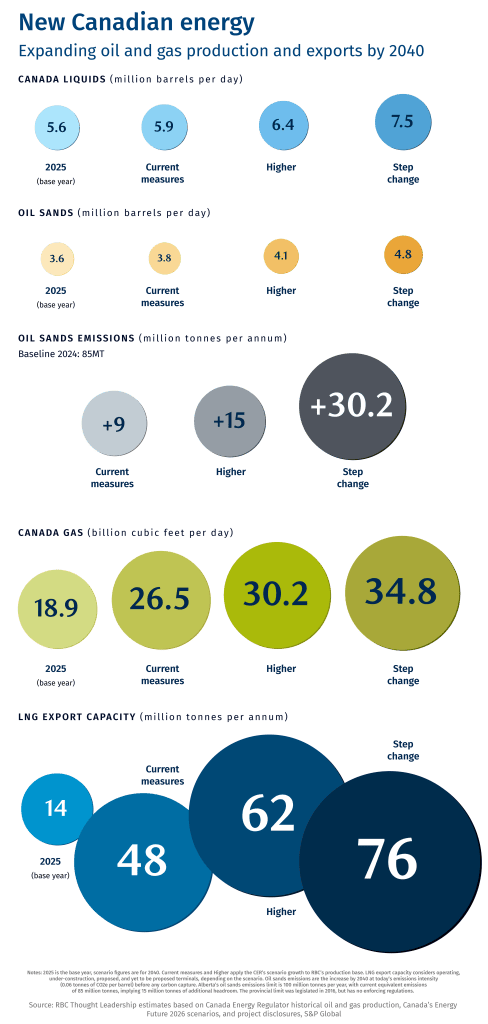
This paper sets out what these three Ps could deliver, and what Canada must navigate to make it all work. Three growth scenarios are used; the Canada Energy Regulator’s Current Measures and Higher Growth scenarios as outlined in the 2026 Canada’s Energy Future publication, and a third Step Change scenario, based on CEF Higher Growth but adapted to align with prior analysis as detailed in RBC Thought Leadership’s Capital Gains report. In this Step Change scenario, Canada’s oil output rises by almost two million barrels a day by 2040, and its gas output nearly doubles.7 The values quoted in this report come from the Step Change scenario (more detail is provided in the Statistical Appendix).
The opportunity: Three Ps, one build
Production: Build now, and create a larger industry with recurring national benefits
LNG Canada Phase 2 is going forward, while the First Nations-backed Ksi Lisims LNG is targeting an investment decision by the end of 2026. South Bow’s Prairie Connector is targeting a decision by mid-2027, and the Pacific Link (formerly the West Coast Oil Pipeline), bringing a million barrels a day from Alberta to a deepwater port in southern B.C., was recently fast-tracked by the federal government with an expected construction start date of September 2027.8
Assuming these projects proceed, construction across Alberta and B.C. would peak at an estimated $30 billion a year around 2030, with about $170 billion of the total built in B.C. That’s far greater than what the province built between 2018 and 2024.
The barrels, meanwhile, will come mostly from expansions at sites already in operation, not from new oilsands mines: Alberta’s oil output grows by about 118,000 barrels a day each year, a little under its average since 2001.5
The result: oil and gas would become a permanently larger industry, and Alberta alone would gain about 52,000 permanent oil and gas production jobs.2 For perspective, the direct gain to GDP is about twice the combined contribution of Canada’s auto and steel industries.9 And these are conservative measures: real dollars (not nominal), direct effects (excludes indirect) and excludes the one-time construction spending that often is attributed to GDP values.2
Pipelines: The hunt for a second customer
More than 90% of Canada’s crude exports and virtually all its natural gas exports are destined for the U.S. The new slew of projects—LNG terminals on the West Coast, the existing TMX pipeline, and the new million-barrel oil pipeline to a Pacific port—would put Canadian energy in front of Asian buyers, potentially lifting non-U.S. oil and gas exports from about $10 billion in 2024 to about $100 billion in gross export sales by 2040. It could also create more opportunities for liquefied petroleum gas to Asia.
That would account for 33% of non-U.S. exports, economy-wide, advancing Prime Minister Mark Carney’s pledge to double non-U.S. exports to $300 billion. The Pacific Link’s submission to the Major Projects Office estimates a second Asia-bound oil pipeline would narrow the discount at which Canadian heavy crude sells to the U.S. benchmark by up to US$3 a barrel, on every heavy barrel Alberta exports basin-wide.10 A narrowed heavy oil discount could generate an additional $7 billion in economic value to Canada, annually.
Indigenous Nations will be critical partners in this build. As capital owners, the Haisla Nation are holders of a majority stake in Cedar LNG and the Nisga’a Nation is a partner in Ksi Lisims LNG. As labour, Indigenous workers made up about a tenth of the Trans Mountain and Coastal GasLink workforces when they were being built.11 Canada has also pledged to offer a minimum of 10% of the Pacific Link to Indigenous communities through Canada and Alberta’s Indigenous loan guarantee programs.
Pathways: The opportunity to spark energy innovation
Pathways, the carbon-capture network major oilsands producers have agreed in principle with Ottawa and Alberta, will allow oilsands production to grow without breaching Alberta’s emissions limit.
Pathways could also transform the Prairies into a climate tech and engineering hub. Alberta’s emissions sit in two clusters, the oil sands and the Industrial Heartland, with storage beneath both, which is a rare starting point for a thriving carbon-management industry, rather than a carbon-management project.
Five issues Canada must navigate
The three Ps depend on five critical elements: investment certainty, labour availability, fabrication of key inputs (steel and equipment), project execution (delivered on time and on budget), and the creation of new markets
1. Investor Certainty: Fiscal terms need permanence
Capital requires certainty. Alberta announced three royalty revisions from 2007 to 2016, essentially all within one growth cycle. B.C. changed its royalty terms in 2022, four years after LNG Canada’s final investment decision (FID), and announced a new price-sensitive gas regime this year, effective January 1 2027.
The moves drew concerns from producers and risks making B.C. a higher-risk jurisdiction.12 Each rule change, delay and permit condition eats into internal rates of return. Investors require certainty for the life of the investment cycle.
The recent federal productivity mega deduction is seen as a template, given its application across industries. Simple and “permanent” is likely a successful recipe for royalties as well.
Proponents are also seeking carbon price stability. Alberta’s Technology Innovation and Emissions Reduction (TIER) system’s headline price rises to $130 a tonne by 2035, but carbon credits still trade around $30 today. The Canada–Alberta agreement set a credit floor rising to $110 by 2040, which Alberta must enact by year-end, and the Pathways deal is non-binding until its definitive agreements are signed.13
Pathways is cheap per barrel at about $2 before public support (cost attributed across all produced barrels, basin-wide), but expensive per tonne captured. Still, its value is more likely in the growth it permits, and not the tonnes it removes.
At today’s emissions per barrel, we estimate about 16 million tonnes of capture is required by 2040 to stay under Alberta’s 100 million tonne (Mt) oil sands limit (assuming no dramatic decreases in upstream emissions intensities). Alberta’s 100Mt oil sands emissions cap was never actually enacted, which can create further regulatory uncertainty especially for foreign investors.14
Permanence is an oft-cited requirement for investors, and arguably one even greater valued in today’s world of heightened geopolitical and energy disruptions, such as the pandemic, Ukraine-Russia war, and the Strait of Hormuz blockade.
2. Labour Availability: Certified trades, headcount and housing
At peak build, the boom will require 130,000 construction workers on site and in the direct supply chain, roughly twice the historical average.15 Alberta is short of certified workers. And nine in 10 of the required construction hires over the next decade will simply replace retirees. Trades wise, gaps cluster in 2027–31 among boilermakers, welders, pipefitters and millwrights. That’s because an apprentice who starts training in 2027 will only be certified in 2030–31 at the earliest, with only about half certifying within six years.16
Alberta imported much of its workforce to solve the labour crunch last time. Out-of-province workers in Alberta doubled between 2004 and 2008, with about 40% of the required labour force from Atlantic Canada. That source is thinner now: Newfoundland and Labrador’s unemployment rate has fallen from 15% in 2006 to 10.1%. And the province is expected to have its own construction peak in 2031 with the $14 billion offshore oil project Bay du Nord $70-billion Churchill Falls hydropower project expansion. It also expects to lose 30% of construction workers to retirement. And that says nothing of the fact that other regions in the country are bidding for the same trades.17
Ontario, where unemployment is higher today than it was in 2006, could be part of the answer. But this could clash with Ontario’s own construction sector’s hiring spree, brought on by growing electrification, mining, and industrial projects.18
While temporary foreign workers could provide an interim solution, importing labour while unemployment among young Canadians is roughly twice the national rate would be a missed opportunity.19 A solution may lie in a national service-style program, “come work for—and build—Canada,” that creates incentives for labour mobility. As our recent report Smarter Immigration notes, the federal government estimates more than 1.4 million new trades workers will be needed by 2033 as a wave of retirements hits, and the report lays out ideas for a nimble and market-driven immigration system to help address the shortage.
Canada will need to manage the labour requirement rollercoaster as it embarks on a spate of transformative projects beyond oil and gas. The Major Projects Office alone oversees 18 projects nationwide valued at $194 billion. That would create jobs for 300,000, requiring housing, roads, schools, and social services. Managing that ebb and flow of labour requirements would require federal agencies, provinces and the private sector to work together and ensure they do not trigger wild fluctuations in the cost of homes, talent and services.
Immigration has to be part of the answer, but it has to be smarter than the last round. This could be achieved by leaving targeted trades streams to the provinces and territories, which know their local shortages, and keep federal Express Entry focused on top scorers instead of piling on categories. Skilled, vetted temporary workers could be the on-ramp to permanent residency, because the work-first, stay-later route produces the best long-term outcomes. Retention matters, too: five-year retention runs from 39% in Prince Edward Island to about 94% in Ontario and Alberta, so jobs, wages and settlement support must keep people in the regions that need them. Pair all of that with a steady population growth target near 1% and real-time labour data, and we can build at scale without repeating the 2022 to 2024 surge that strained housing and services.
3. Fabrication and Procurement: A national plan for a national build
Canada makes few of the large components a build-out of this magnitude requires. It has one large-diameter line-pipe mill, in Regina, and a sole producer of steel plate, Algoma, in Ontario. More than half of steel plate is imported. LNG Canada’s 215 modules came from China and Cedar LNG’s floating hull is being built in South Korea.20 For each Alberta oil and gas construction dollar, only nine cents become GDP in another Canadian province, and 21 cents goes to imports. And the industries that could supply this build domestically (such as steel and aluminum) will likely remain under pressure from U.S. tariffs even over the long-term.
An industrial policy can anchor the construction and manufacturing boom and keep count of capacity such as supply chains, intellectual property and local employment. This can include retooling existing mills, in Ontario for example, toward the plate and line pipe the projects need while placing orders early enough for mills to plan. Ottawa lowered the project value threshold for Canadian content to be used from $25 million to $5 million in 2025 to stimulate the domestic labour market. Project proponents’ workforce commitments could also include apprenticeship ratios and regional training partnerships to build capacity.
The trade-off will be whether this contributes to cost inflation beyond a threshold that proponents would then deem as uncompetitive. Balancing this against the benefit of expanding the GDP add beyond just a mere nine cents per committed dollar of construction could be, on paper, a more timely discussion amongst policy makers given current heightened industrial policy and activity.
4. New Markets: Finding a second customer needs a fulsome strategy beyond laying pipe
Asia is Canadian energy’s largely untapped frontier. Cementing Canadian heavy oil barrels in Asia’s growing mega-refinery complexes for jet fuel and petrochemicals can secure the longevity of Canadian fossil fuels over time.
But the benefits could extend far beyond that. Efforts to boost trade ties with ASEAN nations, including Japan, South Korea, Vietnam, and Canada’s 40-country Indo-Pacific Strategy targeting 65% of the world’s population and 50% of global GDP by 2040, could help diversify Canada’s energy and wider exports. Oil and gas exports could prove to be the tip of the export spear that creates an opening for other goods and services, from canola to climate-tech.
The benefits of energy exports to Asia will show up in Canada’s current account, which ran a $30 billion deficit in 2025. But it can be further leveraged. At a minimum, this could be increasing trade marketing for Canadian LNG and crude in Asia—a region expected to be the largest source of economic growth this century—to further new agreements with customer nations to expand Canadian trade, generally.
A greater economic relationship likely generates greater cross-border investments, both for consumers/producers to secure and enhance their value in upstream/downstream supply chains. Ports and marine terminals are part of the build, and an opportunity to attract Asian foreign direct investment (FDI) for Canada. Many Asian sovereign wealth funds, pension managers and institutional investors are looking to reduce their exposure to the U.S. and seeking to park a portion their funds in stable and promising jurisdictions.
5. Project Execution: From approvals to a clearing house
Permitting processes in the past were gummed up in layers of approvals and permits from various forms of governments that frustrated proponents, added to the costs, and discouraged new capital. All eight Western Canada megaprojects of the last two cycles ran over budget and behind schedule: Trans Mountain’s investment costs quadrupled to $34 billion, and Coastal GasLink costs (LNG Canada’s feeder pipe) more than doubled.
This time around, sequencing could prove to be the most impactful determining factor. Governments cannot fund everything at once, and no entity is yet mandated to rank projects against what host regions and suppliers can absorb. Alberta once had such a function, when it created an oilsands secretariat after the 2006 Radke Report and produced regional infrastructure plans for two of the three oilsands regions. However, the secretariat was dissolved in 2016.
The new Major Projects Office compresses approvals and coordinates financing, and the 2025–26 federal–provincial agreements carry fiscal terms, carbon terms and timelines, but nothing on host capacity.4 But many view the role of Major Projects Office as a bridge to trust, rather than a permanent solution. The sequencing challenge today could arise when proponents set their own priorities leaving small and mid-sized projects feeling excluded.
A clearing house could help. A standing Ottawa–B.C.–Alberta table could put sequencing and permitting in one room: a tight-knit group of senior figures from each government, including Indigenous representation, weekly, to raise complaints that stall projects in a coordinated fashion. A similar set up was used for the Trans Mountain expansion, successfully. That included commitments to 129 Indigenous communities to explore economic participation, procurement and contracting opportunities, environmental monitoring and employment and training opportunities.
The trade-off is speed against thoroughness. Consultation and monitoring exist for reasons, and governments cannot reasonably be co-investors in everything. Defining the “national interest” and a framework in how to rank projects allows governments to allocate and prioritize competing demands accordingly. Early visible wins, such as data centres that bring their own power, can show a community a benefit as demonstrated in Alberta with key major announcements this year.
A carbon management superpower
For the two CER-modelled growth scenarios, the strain on development is lighter, but so is the economic prize. In our Step Change scenario, a new oil pipeline is needed by about 2033, alongside a full Pathways build-out. Key decisions are already upon the nation: Pathways agreements, another likely LNG FID (Ksi Lisims) and Alberta’s credit floor for TIER by year-end.
Canada must unlock its full potential as an energy superpower.21 The country must chart its own path differentiated from its global competitors. Canada needs to demonstrate it can build, let alone build fast.
Sparking an energy innovation revolution
Digging resources up and exporting them raw, means building industries around the barrel. Alberta’s engineering and geoscience regulator reports about 71,000 registrants, which is a start. Climate-tech startup such as Carbon Engineering (bought by a U.S oil major in 2023), Eavor, Entropy and Qube are among Calgary companies advancing clean-tech. What has been missing are anchor buyers that commit to buying the services, goods and technologies of promising enterprises, and helping them scale. A build-out of more than $200 billion could prove to be one such opportunity.
An Alberta research agency’s test facility proved steam-assisted drainage (SAGD), and the technology now delivers more than half of the oilsands output.22 Houston had no space industry when NASA chose it for its human-spaceflight centre in 1961 and moved about 750 staff there; NASA’s fixed-price contracts later gave SpaceX a market to build for. Norway’s early-1970s supplier preferences built an oil-services industry that now sells abroad, at a measurable cost in efficiency. Calgary’s engineers have the capability, but need the support to scale and become part of a new breed of national, tech-savvy champions.
Carbon capture won’t scale until there is a credible price signal. Credits trade near $30 a tonne, below what most capture costs. Alberta has committed to legislate by year-end a credit floor that reaches $60 a tonne in 2030, a long way away from implied Pathways’ costs of likely well over $300 a tonne before public support.13 The Canada Growth Fund’s 15-year contract with Entropy pays $86.50 a tonne.23 There’s a need for a price predictability that investors can factor in their investment decision. Canada mostly pays toward construction: a federal tax credit and an Alberta grant cover about half of Pathways’ capital. That’s different from the U.S., which pays per tonne stored, US$85 per tonne for industrial capture and US$180 for direct air capture, making it more attractive and lucrative for proponents.24
However, storage capacity is a Canadian advantage, with the 240-kilometer Alberta Carbon Trunk Line (ACTL) running at about a tenth of its capacity.22
The plants followed the price. Carbon Engineering, founded in Calgary and sold to Occidental Petroleum in 2023 for US$1.1 billion, is building its first large plant in Texas, where U.S. law pays per tonne stored.25 Eavor tested a prototype in Alberta but built its first commercial plant in Bavaria, backed by an EU grant and Germany’s feed-in tariff for geothermal power.26
For methane, the rules exist, but suppliers are not settled. Alberta reported a 52% cut from 2014 levels by 2023, but aircraft measurements in 2021 put oil and gas methane emissions about 1.5 times the official figure.27 The March agreement-in-principle with Ottawa builds in the check: federal rules would stand down if Alberta reaches a 75% cut by 2035, independently assessed.28 Buyers are moving the same way. Europe will require importers to show equivalent measurement from 2027, and Japan’s JERA and Korea’s KOGAS, two of the world’s largest LNG buyers, have launched a coalition to make methane emissions in LNG supply chains more visible.29
The larger stake is permanent jobs. Construction is temporary. Our estimate of 52,000 permanent Alberta jobs holds productivity at today’s level, but industry has become much leaner: jobs per barrel fell by about a quarter between 2015 and 2024.2 If that level of decline continued, a build that added only barrels would create about 30,000 permanent jobs by 2040. Neither operators nor governments can close the difference alone. Operators, answerable to their shareholders, will keep seeking efficiency, so the roughly 20,000 jobs in between depend on other industries forming around the barrel: capture, monitoring, processing and the services that sell them abroad. Data centres do not close the gap. Meta’s one-gigawatt campus expects about 300 permanent staff.30 They are a customer for gas and power, already in our outlook, not a large employer.7
Canada’s ambition for the new project boom must be to sow the seed of innovation that extends beyond resources. A new energy boom in the era of artificial intelligence and high-tech manufacturing could spawn new industries and a tech-savvy workforce that can drive Canada’s next chapter of growth.
RBC project inventory: forward construction capital for named projects, 2026–40, at disclosed or inferred costs, excluding wells, spread evenly across disclosed construction windows. Total $261 billion is in the Step Change case with peak year spending of (2030) $31 billion across the western basin. Workers: Statistics Canada input-output multipliers (Table 36-10-0595-01, 2022), direct plus indirect, within province.
RBC analysis: Statistics Canada 2024 realized value added, employment and compensation per barrel (chained 2017 dollars), applied to CER volumes rebased to 2024. Direct effects only: $44 billion a year by 2040 in the Step Change case, on a base of about $95 billion. Supplier effects, about 1.5 times the direct gain (about $68 billion), come from Statistics Canada national input-output ratios and are indicative. Alberta: $29 billion and 52,100 permanent jobs at 2024 productivity (jobs per thousand barrels of oil equivalent a day fell from 28.2 in 2015 to 20.9 in 2024; RBC analysis of Statistics Canada employment and production data). Construction spending is one-time and is never added to the annual gain.
RBC Thought Leadership and McKinsey & Company, Canada’s New Capital Playbook (8 September 2026).
Federal review capped at two years (Major Projects Office); Alberta’s 120-day approval timeline (Government of Alberta); B.C.’s combined assessment and permitting process (Government of British Columbia). Radke review (2006). The Government of Alberta. Lexology (September 2012) on the regional infrastructure plans. Canada–Alberta MOU (27 November 2025) and Implementation Agreement (15 May 2026).
RBC analysis (project inventory, note 1): B.C.-located construction of about $170 billion against $83–113 billion for LNG Canada Phase 1, Coastal GasLink, Trans Mountain and Site C in 2018–24. Alberta liquids growth: CER, Canada’s Energy Future 2026; AER, ST98 2025; RBC analysis (118,000 barrels a day a year in the high-growth case over 2025–40, against 121,000 over 2001–25 and about 135,000 in the 2005–15 boom). B.C. oil and gas engineering construction in 2023 (about $21 billion): Resource Works (August 2026), derived from Statistics Canada data.
Radke review (Government of Alberta, 2006). Alberta Official Statistics, Oil and Gas Industry Investment (August 2015), citing Statistics Canada ($100.1 billion in 2006–11 against about $50 billion forecast). ERCB ST98-2013 (2011 bitumen output 12% below the review projection). Overruns are measured against each project’s first public estimate, from company disclosures. Alberta Petroleum Marketing Commission, annual report 2019–20 (Sturgeon refinery, $10.1 billion against $5.7 billion at sanction). TC Energy (February 2023). Parliamentary Budget Officer, Trans Mountain Pipeline – 2024 Report (November 2024). Government of Alberta, West Coast Oil Pipeline submission to the Major Projects Office (2 July 2026), for the route and the proponents.
RBC analysis. CER, Canada’s Energy Future 2026 (Current Measures and Higher scenarios). Step Change is RBC’s modelling of 7.1 million barrels a day of liquids by 2035 as published in Capital Gains, extended linearly to 2040. By 2040 Canada’s liquids rise from about 5.5 to 7.5 million barrels a day and its gas from 18.9 to 34.8 billion cubic feet a day.
EnergyNow (June 2026) on LNG Canada Phase 2. Proponent schedules for Ksi Lisims, the Prince Rupert Gas Transmission pipeline and Coastal GasLink Phase 2 (targets). South Bow, Q2 2026 results (Prairie Connector). Government of Alberta, West Coast Oil Pipeline submission to the Major Projects Office (2 July 2026). Canada–Alberta–Oil Sands Alliance MOU (2 July 2026). Peak-year spending: RBC project inventory (note 1).
Direct GDP of Canada’s auto and steel industries, about $21–23 billion combined. Auto: Innovation, Science and Economic Development Canada, Canadian automotive industry (updated 20 April 2026), $16.8 billion (2024); Trillium Network for Advanced Manufacturing, Cars & Canola, $19.2 billion (2024). Steel: Canadian Steel Producers Association, $4.2 billion (undated). Comparison is for scale only.
CER export data (2024: crude exports of 4.20 million barrels a day worth US$100.7 billion, 93% to the United States; gas exports 99.9% to the United States). Government of Alberta, West Coast Oil Pipeline submission to the Major Projects Office (plain-language summary: “up to US$3 per barrel”). CER, Canada’s Energy Future 2026 (benchmark prices: the heavy-oil discount is held at US$12.50 a barrel through the outlook, down from US$18.30 in 2023, before the Trans Mountain expansion entered service). CAPP, Understanding the WCS–WTI Differential (April 2026). Government of Alberta, Budget 2026 (US$1 of differential is worth about $670 million a year to the treasury).
Cedar LNG; Ksi Lisims LNG. Trans Mountain Final SEEMP (November 2024); Coastal GasLink SEEMP Report No. 11 (October 2023 data).
Government of Alberta, New Royalty Framework (October 2007); Modernized Royalty Framework, announced 29 January 2016, effective 1 January 2017. Government of British Columbia, royalty review (2022). LNG Canada final investment decision (October 2018). B.C.’s new price-sensitive gas royalty regime, announced in March 2026 and effective 1 January 2027: Bloomberg, “British Columbia Finalizes Gas Royalty Overhaul as LNG Industry Weighs Impact” (24 April 2026); EnergyNow, “British Columbia Sparks Angst Over Gas Tax Change Amid LNG Race” (April 2026).
Canada–Alberta Implementation Agreement (15 May 2026): headline price schedule ($95 a tonne in 2026, $130 in 2035), credit target and credit floor ($60 in 2030, $80 in 2035, $110 in 2040), which Alberta must enact by 31 December 2026. Canada–Alberta–Oil Sands Alliance MOU (2 July 2026): non-binding until the definitive agreements, targeted for 15 November. Pathways unit cost: $1.95 a barrel before public support, $1.07 after the federal investment tax credit and Alberta’s grant program. Implied carbon cost of Pathways “well over $300/t) is calculated specifically as ~$425 per tonne, which assumes capital costs of ~$25 billion for Phase 1 (6mt), with a 9% cost of capital plus operating expenses of $50/tonne.
Oil Sands Emissions Limit Act (2016). Government of Alberta. Parkland Institute (February 2017) on exclusions and regulations. Environment and Climate Change Canada, National Inventory Report 2026. On the Act’s basis (excluding cogeneration electricity and up to 10 million tonnes from new upgrading and experimental schemes), Alberta-reported emissions are about 85 million tonnes. RBC analysis at an illustrative 0.06 tonnes of CO2e per incremental barrel is about 9 million tonnes added by 2040 in Current Measures, 15 million in Higher and 31 million in the Step Change case, against about 15 million tonnes of cap space implying a need for 16 million tonnes of capture. Canada–Alberta–Oil Sands Alliance MOU (2 July 2026): Pathways’ first phase captures 6 million tonnes a year from 13 facilities by 2035, escalating to 11 million by 2040.
RBC project inventory and Statistics Canada input-output multipliers (Table 36-10-0595-01, 2022), direct plus indirect, within province: construction jobs in the busiest year (2030) are about 132,000 in the high-growth case, roughly twice the 2026–40 average of 74,000.
ESDC Job Bank, Economic Scan – Alberta (200,900 unemployed in 2025). Government of Alberta, Annual Alberta Labour Market Review 2006 (about 70,000 unemployed, derived). BuildForce Canada, Alberta 2026–2035 (20 July 2026): 48,800 construction hires against 43,700 retirements. Energy Safety Canada / Careers in Energy, National Labour Market Outlook to 2035 (11 June 2026).
Statistics Canada 11F0019M no. 350 (67,333 out-of-province employees in Alberta in 2004; 133,061 in 2008); the Atlantic share is derived from Statistics Canada source shares. Newfoundland and Labrador Statistics Agency (unemployment 15.0% in 2006, 10.1% in 2025). BuildForce Canada, Newfoundland and Labrador 2026–2035 (July 2026): the province’s own construction peak comes in 2031.
Ontario unemployment rate, 6.4% in 2006 and 7.7% in 2025: Statistics Canada Labour Force Survey. BuildForce Canada, Ontario 2026–2035 (20 July 2026): Ontario construction needs 126,100 hires by 2035, 92,000 to replace retirees and 34,100 for growth.
Statistics Canada, Labour Force Survey: unemployment rates for youth (aged 15 to 24) and for all ages
CBSA/CITT, NQ-2016-001 (2016). Trans Mountain, “EVRAZ: A World Leader in Pipe Manufacturing” (25 February 2022, with correction). Imperial and Kiewit (Kearl). Fluor (18 July 2023). LNG Canada (August 2025). Offshore Energy (5 June 2026) on Samsung Heavy’s Geoje yard. Statistics Canada Table 36-10-0595-01 (2022): of each dollar of Alberta oil and gas construction, 9 cents become GDP in other provinces and 21 cents goes outside Canada. US Bureau of Labor Statistics producer price index for steel pipe and tube (WPU101706), a North American proxy. US Section 232 steel tariff (June 2025).
Prime Minister of Canada, remarks announcing the forthcoming National Electricity Strategy (14 May 2026): “We have to unlock Canada’s full potential as an energy superpower.” pm.gc.ca.
Government of Alberta, Alberta’s Energy Heritage: Underground Test Facility (AOSTRA created 1974; test facility opened 1987, where the first well pairs proved steam-assisted gravity drainage). ERCB ST98-2013 (in situ overtook mining in 2012). AER, ST98 2025 (in situ 52% of raw bitumen in 2024). RBC analysis (capital cost per flowing barrel: $15,000–40,000 in situ against $88,000–117,000 for 2006’s mines and upgraders). Radke review (2006), p. 40 (upgrading: about 0.9 million barrels a day arrived against 1.4 million expected). Alberta Petroleum Marketing Commission, annual report 2019–20 (Sturgeon refinery). Wolf Midstream (Alberta Carbon Trunk Line: capacity of 14.6 million tonnes a year, about 1.6 million carried). IISD (2023) compilation of capture costs (about $21–48 a tonne from concentrated streams such as gas processing, fertilizer and hydrogen); Robertson and Mousavian, IISD (2022), for Quest (about $200 a tonne from oil sands flue gas).
Finance Canada and Canada Growth Fund (20 December 2023): $200 million investment in Entropy and the Fund’s first carbon contract for difference, at $86.50 a tonne for up to 9 million tonnes over 15 years, including output from the second phase. Entropy (30 July 2026): Glacier Phase 2 commissioned, about 192,000 tonnes a year in total (company figures).
26 U.S.C. § 45Q as amended by the 2025 reconciliation act (Public Law 119-21): US$85 a tonne for industrial capture and US$180 for direct air capture, geologically stored, with equal values for utilization. Global CCS Institute, “U.S. Preserves and Increases 45Q Credit in One Big Beautiful Bill Act” (2025). Canadian support: see notes 13 and 23.
Occidental, announcement of the Carbon Engineering acquisition (15 August 2023; US$1.1 billion). Occidental, second-quarter 2026 earnings call: Stratos direct air capture plant, Ector County, Texas, to be fully commissioned around the end of 2026, with operations in 2027. U.S. credit: see note 24.
Eavor, first electricity at Geretsried, Bavaria (4 December 2025). POWER, “Eavor’s First-of-Its-Kind Closed-Loop Geothermal Project Produces Grid Power in Germany”: EU Innovation Fund grant of €91.6 million, German feed-in tariff of about €250 a megawatt-hour, prototype at Rocky Mountain House, Alberta. Eavor Deutschland (2 May 2024): European Investment Bank financing of up to €45 million.
Government of Alberta, “Alberta’s methane emissions” (45% reduction target for 2025 against 2014; 52% reduction by 2023, based on operator-reported data). Conrad, Tyner, Li, Xie and Johnson, Communications Earth & Environment (2023): 1,337 kilotonnes a year measured by aircraft in 2021 against 909 in the federal inventory.
Prime Minister of Canada, “Canada and Alberta reach agreement-in-principle on methane equivalency” (25 March 2026): 75% below 2014 levels by 2035; federal regulations stood down in Alberta if equivalent reductions are achieved, as assessed by an independent, jointly selected third party; implementation by 1 January 2027.
Regulation (EU) 2024/1787: importers must demonstrate equivalent measurement, reporting and verification from 1 January 2027 for contracts concluded or renewed on or after 4 August 2024; crude oil and LNG are covered. JERA, “Launch of the methane emission reduction initiative (CLEAN) by KOGAS and JERA” (July 2023): the Coalition for LNG Emission Abatement toward Net-zero, to increase the visibility of methane emissions through dialogue with LNG producers.
Meta, newsroom (July 2026): C$13 billion, one-gigawatt data centre in Sturgeon County, about 3,000 construction jobs at peak and more than 300 permanent (company estimate).
RBC Capital Markets prepared the economic model for the West Coast Oil Pipeline submission referenced in this piece. Figures in the text are for the Step Change scenario. The Canada Energy Regulator’s Current Measures and Higher scenarios are shown for comparison. Gains to GDP apply Statistics Canada’s 2024 value added, employment and compensation per barrel to incremental volumes, in chained 2017 dollars, direct effects only. Supplier and household effects use national input-output ratios and are indicative. Construction figures are forward capital for named projects, several of them proposals, excluding wells, and are not added to the annual gains. The US$3 narrowing is the upper bound in the West Coast Oil Pipeline submission and is reported beside GDP, not within it. Pathways capital is a working figure inside an undisclosed $20–30 billion range. Emissions arithmetic uses an illustrative 0.06 tonnes of CO2e per incremental barrel.
This article is intended as general information only and is not to be relied upon as constituting legal, financial or other professional advice. The reader is solely liable for any use of the information contained in this document and Royal Bank of Canada (“RBC”) nor any of its affiliates nor any of their respective directors, officers, employees or agents shall be held responsible for any direct or indirect damages arising from the use of this document by the reader. A professional advisor should be consulted regarding your specific situation. Information presented is believed to be factual and up-to-date but we do not guarantee its accuracy and it should not be regarded as a complete analysis of the subjects discussed. All expressions of opinion reflect the judgment of the authors as of the date of publication and are subject to change. No endorsement of any third parties or their advice, opinions, information, products or services is expressly given or implied by Royal Bank of Canada or any of its affiliates. This document may contain forward-looking statements within the meaning of certain securities laws, which are subject to RBC’s caution regarding forward-looking statements. ESG (including climate) metrics, data and other information contained on this website are or may be based on assumptions, estimates and judgements. For cautionary statements relating to the information on this website, refer to the “Caution regarding forward-looking statements” and the “Important notice regarding this document” sections in our latest climate report or sustainability report, available at: https://www.rbc.com/our-impact/sustainability-reporting/index.html. Except as required by law, none of RBC nor any of its affiliates undertake to update any information in this document.