
Our current US outlook can be characterized as “stagflation-lite”—growth running below trend coupled with inflation that is uncomfortably heading higher into year-end.
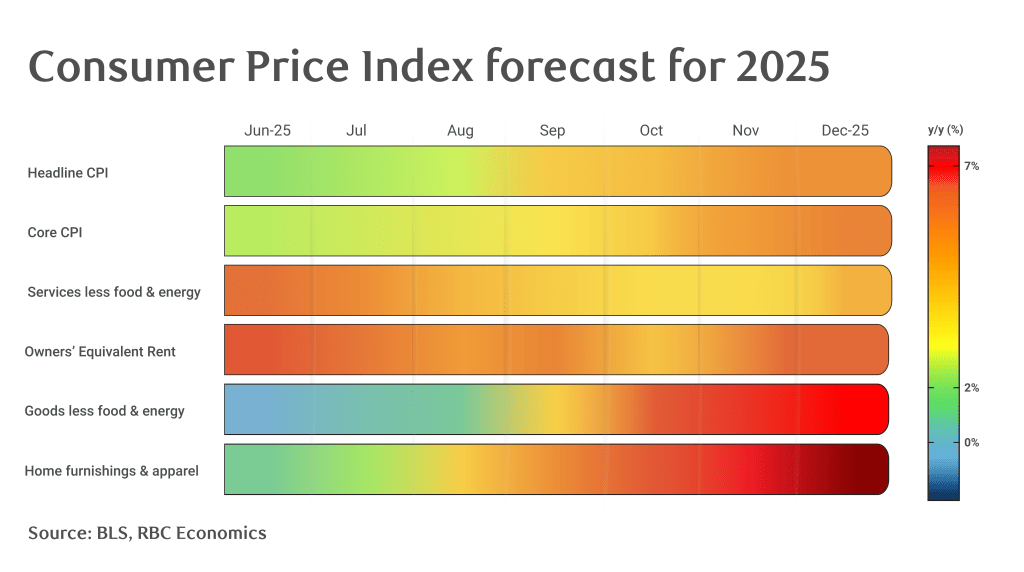
The latter is less of a shared view, particularly as recent inflation prints have suggested price pressures are calming. Looking ahead, however, we see the headline and core Consumer Price Index (CPI) reaching above 3% by the end of 2025.
Importantly, our view of higher inflation is only partly fueled by our assumptions around the impact of tariffs.
Core inflation slightly above 3% is a long cry from the more disastrous price shock during the pandemic. However, it will likely continue to weigh on most households, encourage the perspective that inflation is structurally higher post-pandemic, and further complicate the Federal Reserve’s dual mandate of price stability and full employment.
Some categories of inflation will see more mild year-over-year price increases such as food, or even year-over-year deflation like energy. But, we expect prices to accelerate across most CPI categories and for varying reasons. Within this broad array of influences, we see four particularly relevant areas worth monitoring for upside inflation pressures.
1. Owners’ Equivalent Rent is mechanical but meaningful
The mechanical calculation of Owners’ Equivalent Rent (OER) is less exciting than tariff shocks, but accounts for about one-third of the core CPI basket (one-quarter of the total CPI basket), and is a primary driver of our view that inflation will rise into year-end.
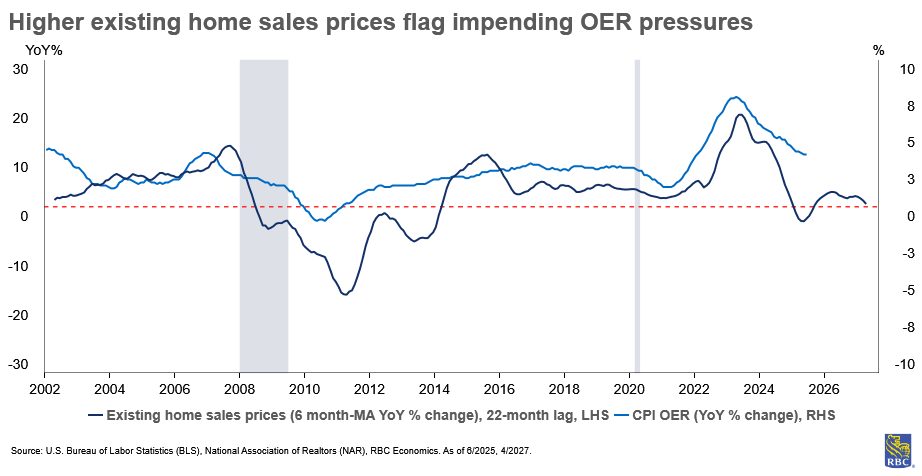
Leading indicators of OER suggest some near-term reprieve, but then, upward pressure through mid-2026, which will put a floor under how far CPI can fall.
Part of this story is technical as opposed to thematic. Home price trends tend to lead the CPI measure of OER1 by about 22 months. Home prices rose more than 4% year-over-year between November and June 2024 and are thus likely to put upward pressure on OER into year-end.
Importantly, the OER measure of housing inflation does not represent actual expenditures from consumers. Rather, it is an imputed representation of what homeowners would pay themselves to rent their homes. Effectively, this means the lock-in effect of low mortgage rates is largely discounted by OER, and homeowners have more real purchasing power than the core CPI basket suggests.
In brief, it reduces the value of the CPI as a “real-time” inflation indicator for households. For that reason, the core Personal Consumption Expenditures (PCE) measure of inflation, which weights the housing sector by about half, may be a better measure of real purchasing power for homeowners (more on that below). Nevertheless, if we are forecasting the path of CPI, we dutifully have to include the likely path of OER.
Unlike OER, rent inflation (as measured by rent of primary residence in CPI) represents a very real expenditure paid by renters, observed by signed lease agreements. Like OER, rent inflation has been trending lower, but we also expect to see a floor under it as affordability constraints prevent many prospective first-time buyers from purchasing homes.
Problematically, the annual change in renter-occupied housing units (2.5% y/y) is outpacing owner-occupied housing units (0.1% y/y). This suggests demand for rental units will remain strong in this high interest rate environment.
Add the high cost of new construction that is limiting new supply, and we see the potential for sustained upward pressure on both housing measures over the next few years.
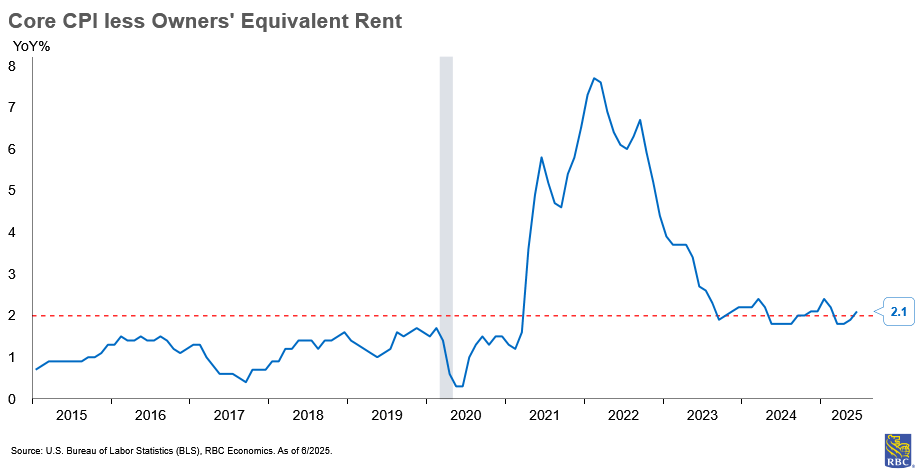
The natural question is whether the Federal Reserve should think about inflation excluding housing. In 2023, a focus on “supercore” inflation emerged—a measure of core services CPI that strips out food, energy and housing. It zeroes in specifically on services inflation where labor inputs play a large role. A return to this or another alternative measure of inflation without a housing component could be used to suggest inflation is much closer to the Fed’s target than the broader core measure implies and justify the need for rate cuts.
2. Labor costs are a floor under services inflation
Amid the more mechanical upward pressures on inflation is a broader critical structural theme: America needs workers, not jobs.
A structurally tight labor market is likely to mean there is limited downside for wages, and therefore, core services inflation ahead. Importantly, wages and compensation represent a majority of the input costs for the services sector.
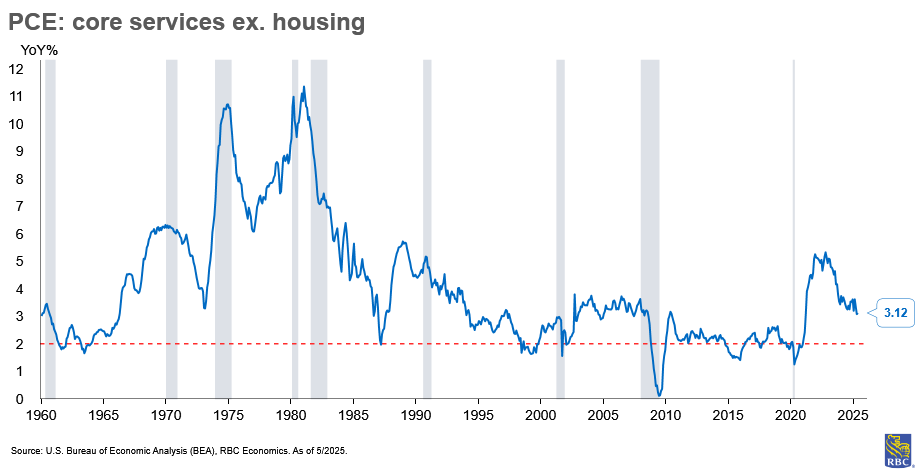
Just look at the data. In the entire history of core services ex-housing (dating back to 1959), the annual pace of price growth has never turned negative even during recessionary periods. The closest the US came to services ex-housing deflation was during the Great Recession in 2009, which saw some of the most severe job losses in recent cycles (outside of the pandemic, but that was for non-cyclical reasons).
Within the context of structural labor shortages, even with a mild recession or slowdown, we have difficulty envisioning a path for wages to be deflationary in this labor market—which will keep a floor under core services ex-housing.
3. No more core goods deflation with ongoing post-pandemic normalization
There’s another mechanical engine lifting inflation into year-end—the end of goods deflation and a “normalization” (excluding the impact of tariffs) of goods prices.
Following an aggressive 16% pandemic-induced rise in core goods prices between early 2020 to mid-2023, core goods prices reversed course thereafter, falling 13 out of 15 months between June 2023 and August 2024. Headline inflation decelerated in tandem.
Now, core goods are normalizing to more typical levels of annual growth (absent tariffs), particularly in the context of the weakening US dollar (i.e., adding upward pressure to import prices) and sustained consumer demand.
So far, these price increases aren’t out of historical norms, but they are the end of a major disinflationary force that supported weakening inflationary pressures in the past two years.
4. Tariffs timing and magnitude are uncertain but direction is clear
As we covered in depth in our tariff transmission framework, there are several known unknowns about the timing and magnitude of price pressures from tariffs.
When and where inflation materializes is going to depend on (a) how long it takes for pre-tariffed priced inventories to be drawn down, and (b) how what share of the tariffs businesses absorb or pass on to households.
Our assumptions suggest core goods prices—particularly import-exposed products like home furnishings and supplies—will begin rising in late Q3/Q4. Apparel and recreation commodities will also likely rise.
We expect tariffs to impact core goods prices initially in the second half of 2025, but we also expect that into 2026. We will see some spillover to services with a lag. An example is as auto parts and equipment become more expensive, auto repairs will likely cost more and, in time, so will the cost of auto insurance.
The difference between CPI and PCE inflation
This analysis focuses primarily on the Consumer Price Index, but there are other measures of inflation on both the producer and consumer side.
Notably, the Federal Reserve’s preferred measure of inflation is the Personal Consumption Expenditures index. Thematically, core inflation as measured by PCE and CPI has presented a similar story throughout 2025, but for much of the year, core PCE reported higher month-over-month changes compared to core CPI.
At the same time, the annual pace of inflation has been persistently higher when measured by core CPI. The divergence is due to several key differences between how each series is measured. For example:
-
Scope—CPI excludes employer contributions to medical expenses.
-
Weighting—CPI has approximately double the weight of housing compared to PCE.
-
Formula—CPI assumes a fixed quantity bucket while PCE accounts for substitution.
-
Coverage—CPI covers urban consumers, while PCE covers all consumers.
-
Data sources—CPI is used as an input for many PCE estimates, but some components are estimated using other sources such as PPI.
We do expect to see a gap persist between the two measures, but feel confident that they will both trend higher into year-end.

About the Authors
Frances Donald is the Chief Economist at RBC and oversees a team of leading professionals, who deliver economic analyses and insights to inform RBC clients around the globe. Frances is a key expert on economic issues and is highly sought after by clients, government leaders, policy makers, and media in the U.S. and Canada.
Mike Reid is a Senior U.S. Economist at RBC. He is responsible for generating RBC’s U.S. economic outlook, providing commentary on macro indicators, and producing written analysis around the economic backdrop.
This article is intended as general information only and is not to be relied upon as constituting legal, financial or other professional advice. The reader is solely liable for any use of the information contained in this document and Royal Bank of Canada (“RBC”) nor any of its affiliates nor any of their respective directors, officers, employees or agents shall be held responsible for any direct or indirect damages arising from the use of this document by the reader. A professional advisor should be consulted regarding your specific situation. Information presented is believed to be factual and up-to-date but we do not guarantee its accuracy and it should not be regarded as a complete analysis of the subjects discussed. All expressions of opinion reflect the judgment of the authors as of the date of publication and are subject to change. No endorsement of any third parties or their advice, opinions, information, products or services is expressly given or implied by Royal Bank of Canada or any of its affiliates.
This document may contain forward-looking statements within the meaning of certain securities laws, which are subject to RBC’s caution regarding forward-looking statements. ESG (including climate) metrics, data and other information contained on this website are or may be based on assumptions, estimates and judgements. For cautionary statements relating to the information on this website, refer to the “Caution regarding forward-looking statements” and the “Important notice regarding this document” sections in our latest climate report or sustainability report, available at: https://www.rbc.com/community-social-impact/reporting-performance/index.html. Except as required by law, none of RBC nor any of its affiliates undertake to update any information in this document.
