
Economists are making a range of assumptions about how tariffs may work their way through the economy without relevant historical precedent. Using our own set of assumptions, we expect tariffs will weigh on the labor market and put upward pressure on inflation, exacerbating our view that the US economy is in a stagflation-lite scenario1.
But, when and where those pressures show up will ultimately come down to two core questions: How much inventory has accumulated in the system ahead of the implementation of tariffs, and how much of the cost of tariffs businesses will pass to consumers.
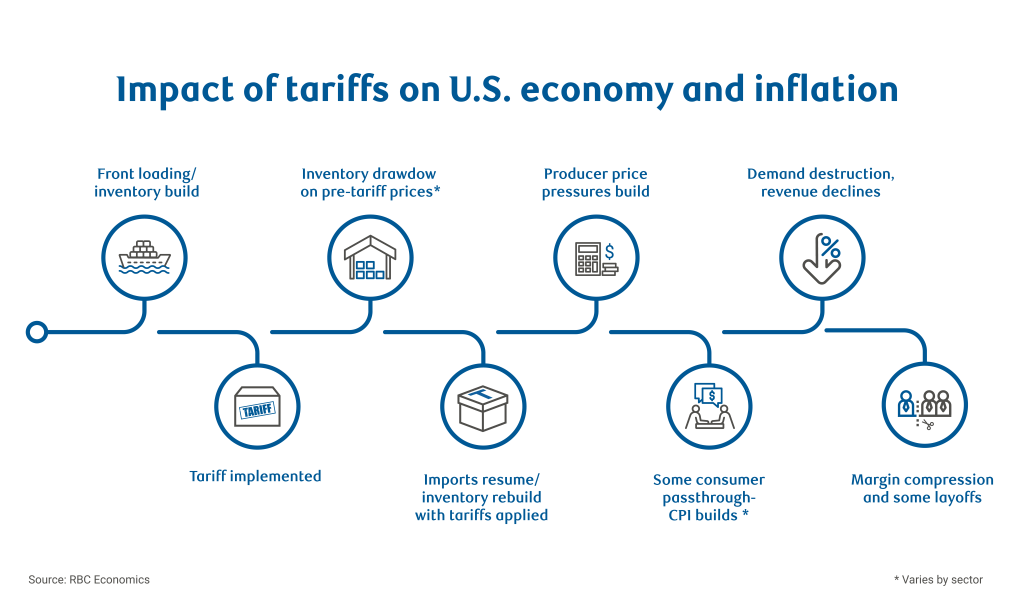
As policies continue to evolve in the coming months and data begins to show evidence of the impact of tariffs, RBC Economics will be using a transmission framework as a roadmap to monitor the fallout.
Here’s a deeper look at how we are thinking about this historic economic shock:
The big inventory question: How much time do we have?
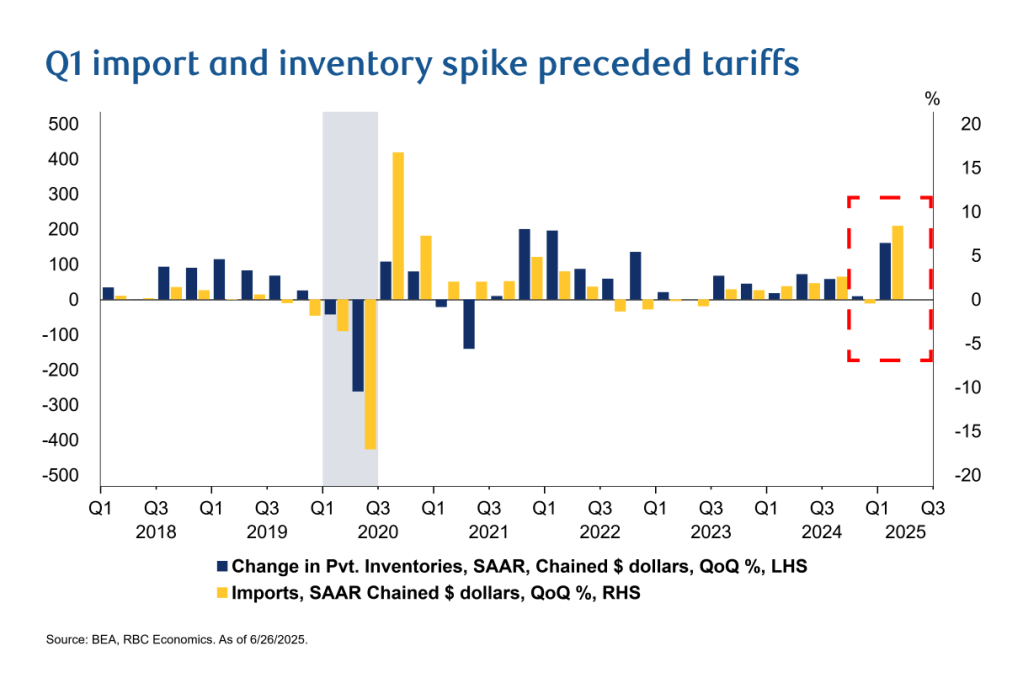
Q1 gross domestic product data shows us that businesses heavily front-loaded goods ahead of tariff implementation with a meaningful surge in imports and resulting jump in inventories.
Until those inventories are drawn down, the impact of tariffs on the economy are stalled as businesses sit on and sell goods at pre-tariffed prices. As long as inventories remain bloated, it will be premature to claim definitively that tariffs will not slow growth or push up prices.
How long will it take for inventories to be fully used up? Problematically, it isn’t straight forward to get a clean read.
Durable inputs like metals or motor vehicles and parts may be stored for much longer than non-durable goods like food products, which do not have a substantial shelf-life.
The Monthly Advanced Report on Durable Goods showed fabricated metal products as well as electrical equipment and appliances both reported upticks in recent months. Though, we suspect the report is understating the full magnitude of the buildup and expect to see more upward revisions as new data becomes available.
The national accounts data showed the real US trade balance fell to close to $1.4 trillion in Q1, and yet real inventories ramped up by (a still sizeable but much smaller) $160.5 billion.
Interestingly, the Advanced Report on Durable Goods has yet to show a meaningful ramp-up in inventories that matches the national accounts data. The data being recorded by businesses and collected by government agencies may not fully align, which could instigate a delay in imports being reported as inventories.
Additionally, as tariffs are implemented, the use of bonded warehouses may further complicate the reporting process, because goods in bonded warehouses are not cleared by customs for domestic distribution.
We expect it will take time to get an accurate picture of the magnitude of the inventory build on a sector basis, and there will likely be significant revisions throughout this process.
Stronger consumer activity will result in a faster depletion whereas a pullback in consumer spending and/or business investment could lead to a more prolonged drawdown.
Recent retail sales reports reflect sustained demand for consumer goods, but also signal pre-tariff front-loading by consumers as well (notably in autos). That could imply that recent consumer demand won’t be sustained. Importantly, we continue to expect high-income consumers will dominate consumption activity and have much higher levels of resilience.
Based on data we have now, we estimate the aggregate economy has as much as a five months of inventory buildup. In non-durable products like pharmaceuticals which expire, for example, that horizon is shorter.
Imports will ultimately resume at higher prices—where will we see price pressures first?
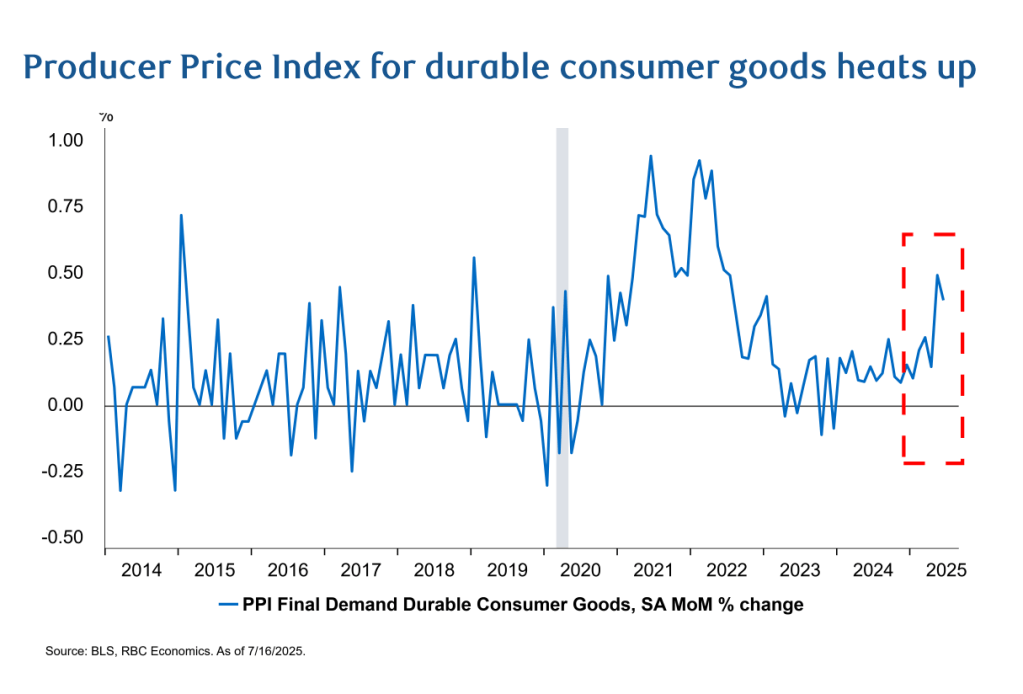
Once inventories are largely depleted and imports resume at tariffed prices, we expect to see higher producer prices, for example, in the Produce Price Index (PPI.).
Helpfully, PPI is structured by stage of production, which allows us to see price pressures emerge in raw materials, intermediate inputs and final goods, giving an indication of potential increases to consumer prices (reflected in consumer price index) in the coming months.
So far, headline PPI seem innocuous, but this is in part because services deflation has been offsetting early upward pressure from goods. Importantly, month-over-month price changes in finished durable consumer goods are heating up, particularly in furniture, household appliances and electrical equipment prices.
Going forward, we also expect to see pressure build in trade services PPI, which measures margins, specifically, the difference between selling and acquisition prices of a good sold to non-manufacturing industries. We have not seen this yet, but trade services PPI will give us a gauge of the extent that margin compression is occurring outside of manufacturing.
Businesses will pass tariffs to consumers, absorb costs or do both
Tariff revenue has already soared by about $50 billion year-to-date—doubling from a year ago. Those tariffs will need to be paid by some segment(s) of the economy.
Where the buck stops have different implications for growth, employment and consumer prices. Again, the outcomes are likely to vary by product. In its most simplified form, there are two paths the tariff burden can follow.
➔ If businesses absorb the tariff, jobs are at risk. The idea that tariffs will not be inflationary is largely based on the concept that businesses will absorb the higher costs, which would certainly be inflationary for them. While that might imply less pressure on consumer prices, we’d caution against the idea that this is a good outcome for the US economy.
If businesses carry the costs themselves, they’ll face margin compression and need to cut costs elsewhere. Labor is a good candidate. Compensation reflects roughly 48% of gross value added by businesses, suggesting that for every dollar of value generated by a business, 48 cents of that goes to staff.
Clearly, there would be implications for households from job cuts but businesses as well. As we’ve covered in depth here, employers are facing structurally lower labor supply that is complicating their relationship with workers, and there are likely limitations to how weak the labor market can become as a result. Firms may need to spread cost reductions out, including to capital investment, for example.
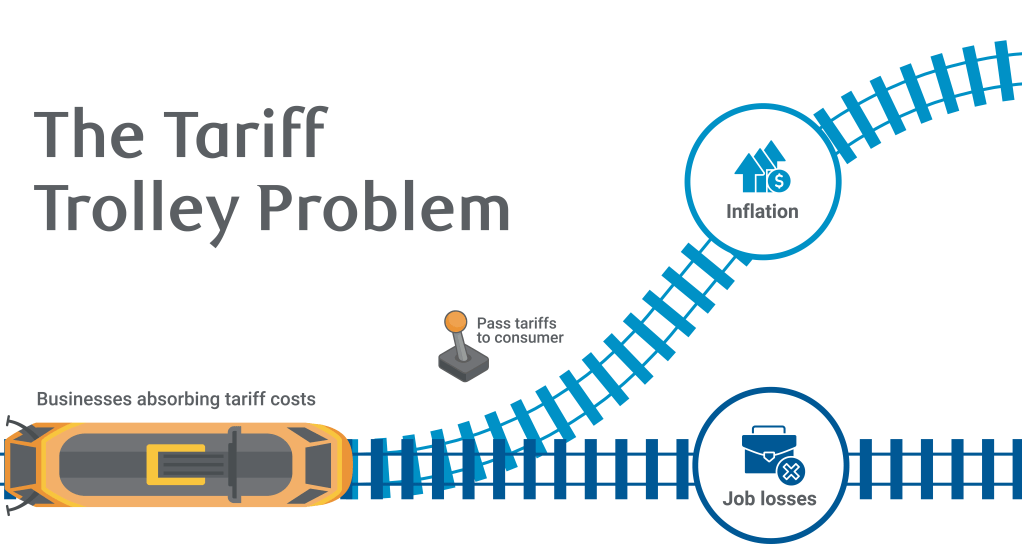
➔If businesses pass on tariffs to consumers, prices are at risk. The businesses that can and will pass tariffs onto consumers will likely vary quite a bit by sector and end-consumer. We continue to expect it will be much easier to pass on price increases to higher-income households than lower- and middle-income ones, who are in a more precarious economic position.
How will we know when and where consumers are absorbing higher costs? We’ll first see evidence of consumers absorbing tariffs via import-exposed sectors. Think core goods prices first, specifically household furnishings and supplies, where the import share is roughly 50%.
Apparel and recreation commodities are largely imported from Asia and especially exposed to tariffs. Later, should sector-specific tariffs on copper, semiconductors and pharmaceuticals be announced, we would also see higher prices for electronics, communications equipment and medical care products.
We would see prices rise in core goods first, but we’d also expect to see it spillover to services with a lag. For example, as motor vehicle parts and equipment become more expensive, auto repairs will cost more, and in time, the cost of auto insurance will be adjusted to account for higher repair costs.
If wages are constant or lower (as we expect), consumers facing higher prices on tariffed products will have to make a choice: Buy less of the tariffed product or buy less of something else.
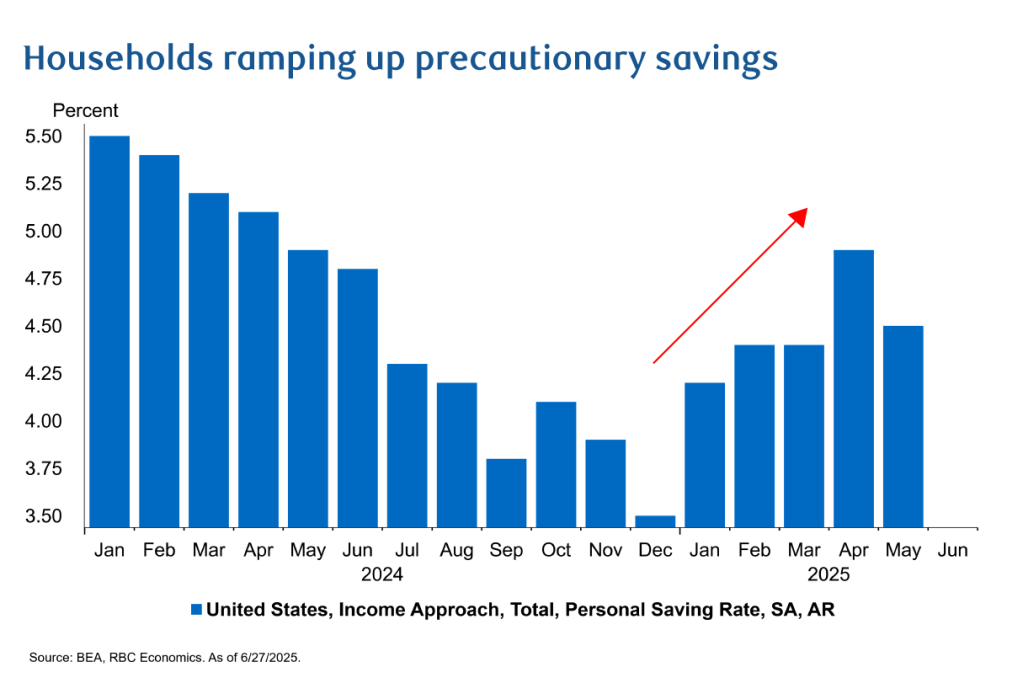
We believe households are more likely to prioritize services consumption at the expense of discretionary goods. But either way, real demand would likely fall, and the difficult reality is that if tariffs derail consumption in pockets of the economy (i.e. demand destruction), business profits weaken, and businesses will also look to cut costs. Consumers may already be preparing for these choices as precautionary savings are already rising.
Ultimately, it’s likely that both channels of transmission come into play—with some drift higher in the unemployment rate coupled with higher consumer prices. We expect to see core goods inflation approach 3.4% by year end as the unemployment rate rises towards 4.5%.
Our concerns are more tilted to the inflation side of the picture, because there are other inflationary pressures in the economy, and low- and middle-income households have yet to recover from the pandemic era inflation shock.
Given the significant variability of outcomes, however, we’ll be closely following this transmission framework and updating our forecast as needed.

About the Authors
Frances Donald is the Chief Economist at RBC and oversees a team of leading professionals, who deliver economic analyses and insights to inform RBC clients around the globe. Frances is a key expert on economic issues and is highly sought after by clients, government leaders, policy makers, and media in the U.S. and Canada.
Mike Reid is a Senior U.S. Economist at RBC. He is responsible for generating RBC’s U.S. economic outlook, providing commentary on macro indicators, and producing written analysis around the economic backdrop.
- We assume current policy holds with the average effective tariff rate at its current level of 13.8%. Specifically, we consider 50% tariffs on steel and aluminum (with the exception of the UK which faces a 25% rate), 25% tariffs on motor vehicles and parts, and a reduced Liberation Day tariff of 10% for most countries while the 90-day pause is in effect with the exception of China that currently faces a 30% import tariff. ↩︎
This article is intended as general information only and is not to be relied upon as constituting legal, financial or other professional advice. The reader is solely liable for any use of the information contained in this document and Royal Bank of Canada (“RBC”) nor any of its affiliates nor any of their respective directors, officers, employees or agents shall be held responsible for any direct or indirect damages arising from the use of this document by the reader. A professional advisor should be consulted regarding your specific situation. Information presented is believed to be factual and up-to-date but we do not guarantee its accuracy and it should not be regarded as a complete analysis of the subjects discussed. All expressions of opinion reflect the judgment of the authors as of the date of publication and are subject to change. No endorsement of any third parties or their advice, opinions, information, products or services is expressly given or implied by Royal Bank of Canada or any of its affiliates.
This document may contain forward-looking statements within the meaning of certain securities laws, which are subject to RBC’s caution regarding forward-looking statements. ESG (including climate) metrics, data and other information contained on this website are or may be based on assumptions, estimates and judgements. For cautionary statements relating to the information on this website, refer to the “Caution regarding forward-looking statements” and the “Important notice regarding this document” sections in our latest climate report or sustainability report, available at: https://www.rbc.com/community-social-impact/reporting-performance/index.html. Except as required by law, none of RBC nor any of its affiliates undertake to update any information in this document.
