
Last Friday, the labor market story changed substantially following the release of the July employment report. The previously published payroll numbers in May and June saw historic revisions (some of the largest downward revisions to payrolls outside of the Covid-pandemic) that stirred serious concerns about visibility into and the direction of the US economy. On net, the revised data fits into our RBC economics base case, as we continue to expect job losses in trade-reliant sectors resulting from the tariff uncertainty. Here’s a cheat sheet on what you need to know about revisions.
1. How significant were the payroll revisions over the past few months vs. a typical revision? Have we seen anything like this before?
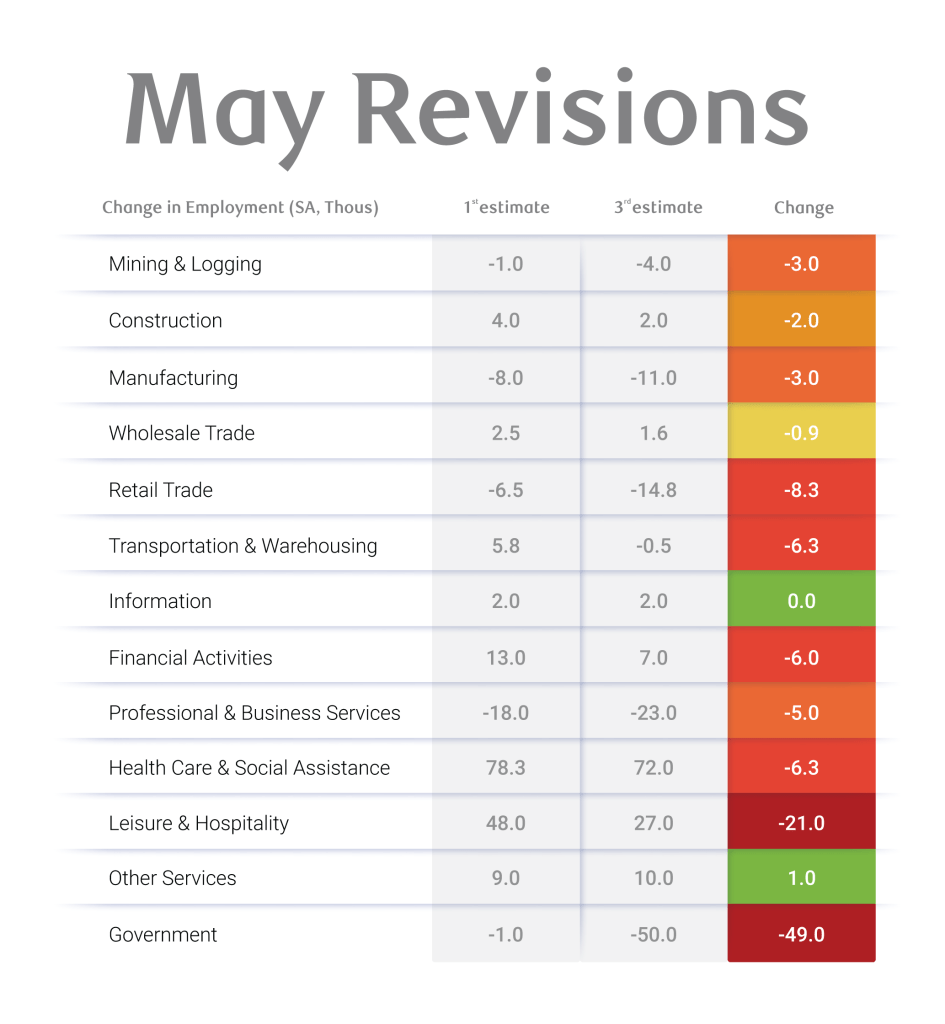
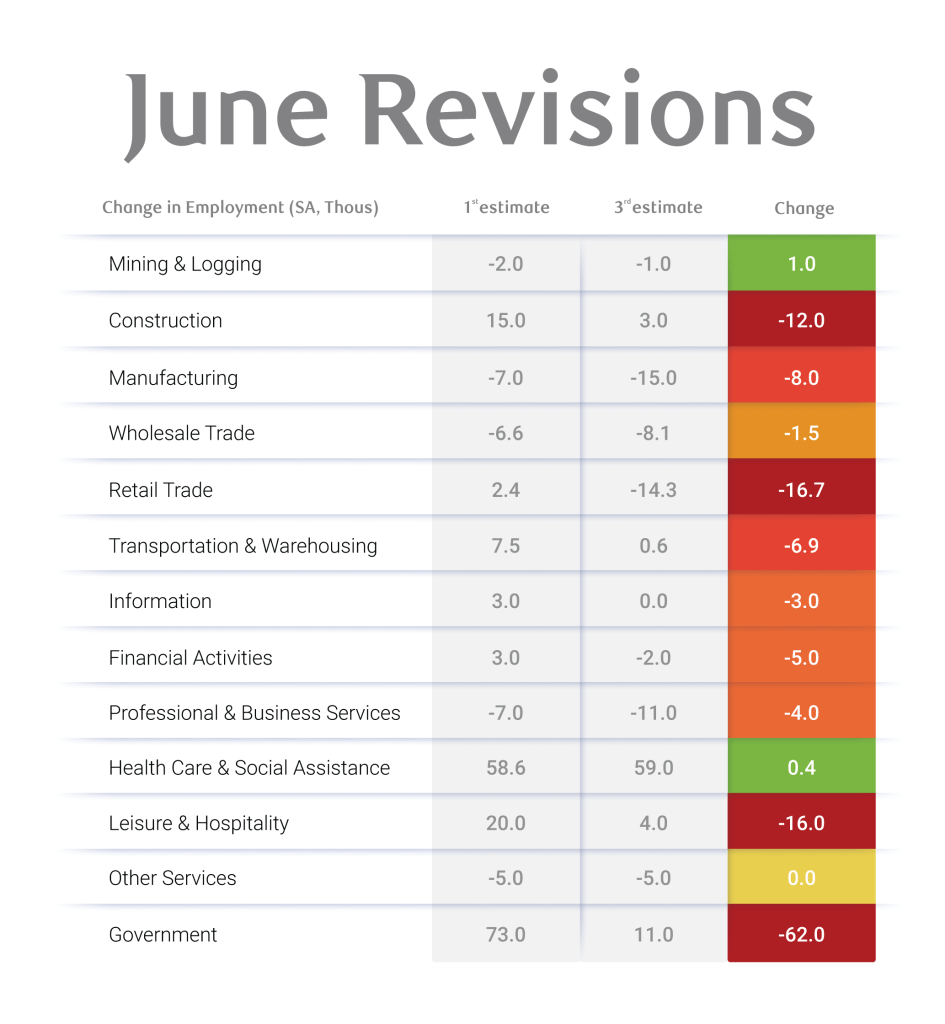
Prior to the July employment report, we were under the assumption that the US economy added 291k jobs between May and June. In actuality, the US economy only added 33k jobs over the two months – a downward revision of 258k. This is a significant revision that changes our near-term assessment of the US labor market.
This is not the first time we have seen significant revisions to payroll data, but it is atypical outside of labor market turning points (i.e., recessions). Outside of the pandemic (2020 and 2021 were riddled with revisions), we last saw successive revisions of 100K or more in August and September 2011 when preliminary revisions understated jobs numbers. This was caused by a major telecommunications strike in August 2011 alongside low initial response rates amidst a recovery from a slowdown earlier in the year. Outside of this, we saw significant revisions during the GFC in 2008 – another turning point lower in the labor market. And while the data revisions have mostly been negative since 2023, the magnitude of the final May revision is among the largest reported since 1990.
2. Why does payroll data get revised each month? How is this done?
The BLS provides a first, second, and third (final) estimate of monthly Current Employment Statistics (CES) payroll data. After the initial release, the data is subject to two monthly revisions until the annual benchmark adjustment (using the Quarterly Census of Employment and Wages – QCEW). The primary reason why data is revised on a monthly basis is that additional survey responses come in after the initial release. To that end, post-pandemic data collection has been challenging. In fact, the initial response rate has been declining from between 70-80% prior to Covid to 50-60% post-pandemic, which means a greater reliance on modeling techniques is necessary to estimate missing data. In short, the revisions are due to growing discrepancies between the model assumptions and the final reported survey data.
The BLS counts monthly payroll jobs using both survey data and modeling techniques as part of the CES program. For timeliness, the CES does not survey al US employers; instead, it collects data from approximately 121,000 businesses and government agencies every month. The data that is collected is used as a representative sample of the labor market and scaled using weights. Weights are determined annually using data from the QCEW. Additionally, a birth-death model adjustment accounts for newly opened and closed businesses.
3. Do we have any insight into why we could get such significant monthly revisions in the July payrolls report?
The easiest explanation is that businesses were slower to respond than usual, leading to a larger share of assumptions being used in the initial data release. Uneven response patterns across industries and regions can lead to significant revisions, notably in trade-exposed sectors grappling with atypical hiring patterns. Lastly, data collection and processing changes could also impact the estimates as BLS faces staffing shortages.
4. Which sectors contributed the most to recent payroll revisions?
Trade-exposed sectors posted the most pronounced revisions alongside the government sector. The manufacturing sector reported 60% more job losses in the final estimate for May than in the second estimate and cut twice as many jobs in June than were initially reported. Similarly, retail trade shed twice as many jobs in May as we initially thought, and June job gains that were initially published were reported as significant losses once the revisions were published. Moreover, professional and business services employment – a sector which includes temporary help services, often used to backfill manufacturing jobs – cut a significant number of jobs in both May and June. The government sector also contributed to the downward revisions. But surprisingly, the driver was not Federal layoffs (i.e., the DOGE cuts), but rather sizable downward revisions to local government hiring, stemming from job losses in local education.
5. What could this mean for future payrolls reports? Are we more likely to see significant revisions going forward?
It is likely that downward revisions continue in 2025, especially if initial response rates remain low and we are at a turning point in the labor market hiring trends. Additionally, we are likely to see more significant revisions during the benchmarking process. Once a year (in March), the BLS conducts an annual benchmark adjustment where they compare their estimates against QCEW data – and that data is showing payroll growth slowing below 1% YoY in September 2024 compared to the CES data, which has been trending above that pace. In this situation, if we are seeing relatively higher levels of businesses dissolving and lower levels of business creation compared to what the birth-death model assumes, then the CES payrolls are likely overstating monthly job gains.
6. What could this mean for the labor market this year and how could the Fed react?
Chair Powell has emphasized in prior meetings that there is time to exercise patience. While we still have one additional payroll data release ahead of the September FOMC meeting, if we see additional downward revisions to June and July data, the Fed may need to return from the sidelines and begin cutting interest rates.
For context, we estimate the US economy needs to add ~100K new jobs each month in order for the unemployment rate to hold steady (i.e., the breakeven pace). A number below this signals an uptick in the unemployment rate is likely. Our expectation is for the unemployment rate to continue to move higher, reaching 4.5% by year-end. If anything, the July payrolls report adds to our level of conviction that the US labor market is on a path to weaken throughout the year as trade-reliant sectors continue to shed jobs.
At the same time, we will get two additional inflation reports. Should we see an uptick in the pace of core inflation, the Fed will be put in a tough spot. A re-acceleration in prices may limit how quickly the Fed can return rates to neutral in the short-term. Our RBC Rates Strategists, Blake Gwinn and Izaac Brook write, “[…] This wasn’t a good print, and unquestionably puts September back on the table, but we aren’t pulling our first cut forward from December (yet).”
About the Authors
Mike Reid is a Senior U.S. Economist at RBC. He is responsible for generating RBC’s U.S. economic outlook, providing commentary on macro indicators, and producing written analysis around the economic backdrop.
Carrie Freestone is an economist and a member of the macroeconomic analysis group. She is responsible for examining key economic trends including consumer spending, labour markets, GDP, and inflation.
This article is intended as general information only and is not to be relied upon as constituting legal, financial or other professional advice. The reader is solely liable for any use of the information contained in this document and Royal Bank of Canada (“RBC”) nor any of its affiliates nor any of their respective directors, officers, employees or agents shall be held responsible for any direct or indirect damages arising from the use of this document by the reader. A professional advisor should be consulted regarding your specific situation. Information presented is believed to be factual and up-to-date but we do not guarantee its accuracy and it should not be regarded as a complete analysis of the subjects discussed. All expressions of opinion reflect the judgment of the authors as of the date of publication and are subject to change. No endorsement of any third parties or their advice, opinions, information, products or services is expressly given or implied by Royal Bank of Canada or any of its affiliates.
This document may contain forward-looking statements within the meaning of certain securities laws, which are subject to RBC’s caution regarding forward-looking statements. ESG (including climate) metrics, data and other information contained on this website are or may be based on assumptions, estimates and judgements. For cautionary statements relating to the information on this website, refer to the “Caution regarding forward-looking statements” and the “Important notice regarding this document” sections in our latest climate report or sustainability report, available at: https://www.rbc.com/community-social-impact/reporting-performance/index.html. Except as required by law, none of RBC nor any of its affiliates undertake to update any information in this document.
