
As was widely expected, the US government shutdown started at midnight on October 1st. The US federal fiscal year runs from October 1st to September 30th and government funding is allocated on a fiscal year by fiscal year basis. This means that in order for the government to fully re-open, Congress must pass 12 separate appropriation bills that allow for US federal agencies to allocate and spend funds on their operations. Until those bills are passed, an estimated 750,000 Federal workers will be furloughed, comprising nearly all employees who collect and analyze economic statistics. As such, the widely watched employment report, CPI, retail sales, and GDP, among others, will not be reported until the government reopens. Below, we outline what this shutdown could mean for the economic data and growth moving forward, as well as some alternative, private data sets we will be monitoring in the absence of government data.
How will the shutdown and furloughs impact the economy? Should we be worried about growth?
Past studies of government shutdowns indicate a modest drag on headline GDP growth, with estimates ranging from -0.1 to -0.3 ppt. Largely, the drag on growth is mechanical – a function of how government services and compensation are measured in the national accounts. In fact, on January 16, 2019, the President signed a bill into law that guaranteed back pay to furloughed and excepted workers, meaning that there is no impact on the current measure of Federal compensation in the national accounts. Another area we could see an impact is the unemployment rate, but timing matters. If the shutdown concludes before the 12th of the month, there would likely be no impact on the unemployment rate. But, if the shutdown were to continue through Oct 17 (the reference week for the employment report), we estimate it could push the unemployment rate up to 4.8%, which would account for the 750k furloughed employees being classified on temporary layoff (it’s worth noting that exempted workers – those federal workers who report to work but are not paid – are not counted as unemployed). Assuming the shutdown concludes by the end of October, this would simply be a blip in the data that we expect would revert by November.
However, the longer the shutdown drags on, the greater the risk to the private sector, the unemployment rate, and other spillover effects. For example, contractors that rely on government spending may opt to furlough workers who would then face a greater risk of losing income and reducing spending (in contrast Federal workers do receive backpay). This means that we would expect to see a drag on indicators like consumer spending and business investment resulting from a prolonged shutdown. While there is no precise relationship between the duration of shutdowns and the drag on the economy, in this environment, the risk of slower growth stems from reduced visibility into the economy in an already uncertain period, and less so from the shutdown itself. Data distortions stemming from import surges and inventory build-up are starting to unwind, job growth is slowing, and inflation remains sticky. How might the lack of data deter certain types of spending? In that light, the important question to ask is how to we continue to monitor these trends in the absence of government data?
The economic impact of past government shutdowns has been mixed
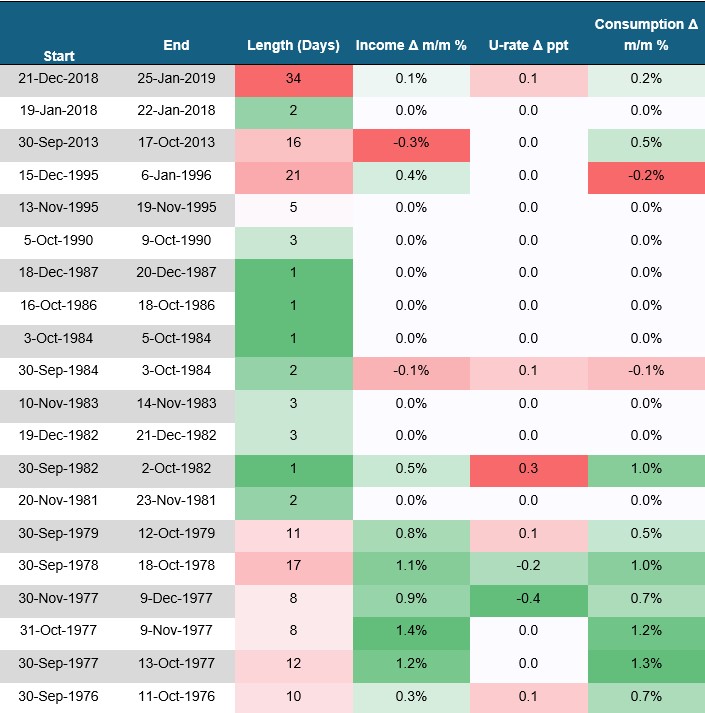
*The changes in the table represent the m/m change between the start and end month. For those shutdowns that
lasted a few days, the changes are 0 because the shutdown did not extend beyond the start month.
What data can we use to monitor the health of the US economy during the shutdown?
Historically, government shutdowns create data disruptions, not economic ones. During a government shutdown, only essential government operations continue – and much to our dismay – most statistical agency employees are not considered essential. This means that economic data that is reported by statistical agencies such as the US Census Bureau, Bureau of Economic Analysis, and Bureau of Labor Statistics cannot be collected and analyzed for release during the shutdown.
Already, we expect the employment report (scheduled for release on Oct 3) will be delayed and expect more serious delays will impact measures like CPI, retail sales, and GDP scheduled for release later this month. In the meantime, we are turning our attention to private sector data, including the ADP Employment Report to fill in the gaps left by the shutdown. While ADP has a large sample for a private-sector survey (~26 million employees), it has had an unreliable and choppy history as a leading indicator for payrolls and tends to oversample large-sized businesses. We have listed a variety of other labor market indicators from Challenger job cuts and WARN notices to Indeed Wage Tracker data. While these indicators help shape our narratives for different segments of the US labor market, the data cannot be used as a perfect substitute for NFP. Depending on the duration of the shutdown, there is a good chance that the NFP data still lands before the FOMC meets on Oct 29th, but there is more uncertainty surrounding whether CPI and retail sales will be released in time, since workers must prepare the data for release upon their return. Where CPI is concerned, the shutdown will also likely impact the collection process for October data (released in November) – since two-thirds of CPI price collection is done by BLS personal visits of data collectors to brick-and-mortar stores. Some data published by the Fed will be helpful in assessing parts of the economy, including business (Fed regional surveys), the financial sector (Senior Loan Officer Opinion Survey on Bank Lending Practices) and consumer spending (consumer credit). But even some estimates by the Fed will be delayed, notably for industrial production, which relies on Federal agency data inputs.
The timing of the government shutdown is not ideal for the Fed, and if no new data is reported, their decisions to hold or cut interest rates will be challenging. In our view, an increasingly data dependent Fed with limited visibility into the September data increases the probability of an October pause.

About the Authors
Mike Reid is a Senior U.S. Economist at RBC. He is responsible for generating RBC’s U.S. economic outlook, providing commentary on macro indicators, and producing written analysis around the economic backdrop.
Carrie Freestone is a U.S. Economist at RBC. She is responsible for monitoring and contributing to commentary on key economic indicators including GDP, inflation, and labor markets.
Imri Haggin is an economist at RBC Capital Markets, where he focuses on thematic research. His prior work has centered on consumer credit dynamics and treasury modeling, with an emphasis on leveraging data to understand behavior.
This article is intended as general information only and is not to be relied upon as constituting legal, financial or other professional advice. The reader is solely liable for any use of the information contained in this document and Royal Bank of Canada (“RBC”) nor any of its affiliates nor any of their respective directors, officers, employees or agents shall be held responsible for any direct or indirect damages arising from the use of this document by the reader. A professional advisor should be consulted regarding your specific situation. Information presented is believed to be factual and up-to-date but we do not guarantee its accuracy and it should not be regarded as a complete analysis of the subjects discussed. All expressions of opinion reflect the judgment of the authors as of the date of publication and are subject to change. No endorsement of any third parties or their advice, opinions, information, products or services is expressly given or implied by Royal Bank of Canada or any of its affiliates.
This document may contain forward-looking statements within the meaning of certain securities laws, which are subject to RBC’s caution regarding forward-looking statements. ESG (including climate) metrics, data and other information contained on this website are or may be based on assumptions, estimates and judgements. For cautionary statements relating to the information on this website, refer to the “Caution regarding forward-looking statements” and the “Important notice regarding this document” sections in our latest climate report or sustainability report, available at: https://www.rbc.com/community-social-impact/reporting-performance/index.html. Except as required by law, none of RBC nor any of its affiliates undertake to update any information in this document.
