
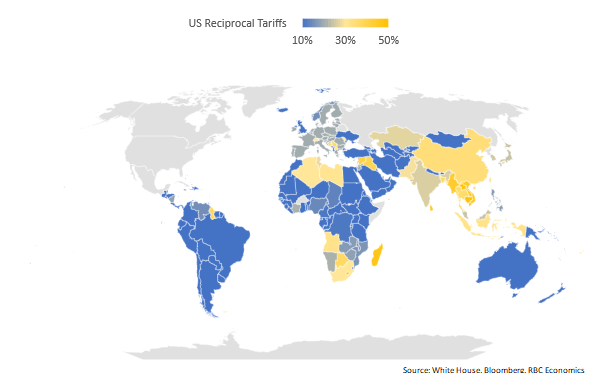
President Trump unveiled sweeping “reciprocal” tariffs on April 2 (“Liberation Day”) from the White House rose garden, imposing targeted measures on a wide range of trading partners and a blanket tariff on nearly all countries at a rate of 10%. Canada and Mexico emerged relatively unscathed, with USMCA exemptions still in effect. This time, Southeast Asian countries were the most significantly impacted. The announcement pushed the U.S. average effective tariff rate to 24%, from 6.2% in March (and 2.4% in 2024). With so many countries targeted, it is difficult to see an immediately accessible off ramp. Should these tariffs stay in place in the coming months, our expectation is to see significant upward pressure in inflation and negative shocks to growth. Below, we expand on how this could impact inflation’s path and weigh on U.S. growth in a range of possible scenarios.
| Top 15 import countries | Import Value ($USD Billions)- Total Imports | Share of US Imports | Trade Balance (USD Billions) | U.S. Reciprocal Tariff Rate |
|---|---|---|---|---|
| European Union | 605.8 | 18.5% | -235.6 | 20% |
| Mexico | 505.9 | 15.5% | -171.8 | 25%* |
| China | 438.9 | 13.4% | -295.4 | 34% |
| Canada | 412.7 | 12.6% | -64.2 | 25%* |
| Japan | 148.2 | 4.5% | -68.5 | 24% |
| Vietnam | 136.6 | 4.2% | -123.5 | 46% |
| Korea, South | 131.5 | 4.0% | -66 | 25% |
| Tiawan | 116.3 | 3.6% | -73.9 | 32% |
| India | 87.4 | 2.7% | -45.7 | 26% |
| United Kingdom | 68.1 | 2.1% | 11.9 | 10% |
| Switzerland | 63.4 | 1.9% | -38.5 | 31% |
| Thailand | 63.3 | 1.9% | -45.6 | 36% |
| Malaysia | 52.5 | 1.6% | -24.8 | 24% |
| Singapore | 43.2 | 1.3% | 2.8 | 10% |
| Brazil | 42.3 | 1.3% | 7.4 | 10% |
Source: U.S. Census Bureau, RBC Economics
Core inflation could approach 4% if current tariffs are prolonged
Roughly 10% of U.S. consumption is accounted for by goods and services imported from abroad. Considering the extent of sweeping tariffs, it will be relatively difficult for consumers to substitute away from imported goods in the near term. For example, U.S. technology in many cases requires chips from Asia and most textile factories are found beyond U.S. borders. We have elaborated on how 25% tariffs will impact the price of new cars here – but outside of the auto sector, “reciprocal” tariffs will show up in household furnishings (including Scandinavian furniture), recreation commodities (including children’s toys largely from Asia), and medical supplies from Europe among others. We expect to see a spike in core goods inflation as early as May. This would result in a notable increase in both core and headline inflation. Relative to our baseline forecast (prior to the announcement we had core inflation ending the year at 2.7% y/y), we have modeled two likely tariff risk scenarios:
-
10% tariffs across the board with 25% tariffs on autos and 20% steel and aluminum (*includes USMCA exemptions)
-
20% tariffs across the board with 25% tariffs on autos and 20% steel and aluminum (*includes USMCA exemptions)
Where tariffs are concerned, magnitude matters! In scenario (1), a 10% across-the-board tariff rate (aside from autos and steel and aluminum) could push core inflation as high as 3.5% y/y in Q2 and likely end the year at 3.3% y/y, well-above our base case scenario of 2.7%. A more aggressive scenario (2) – which is more closely aligned to the current environment – would mean inflation peaks at 3.8% y/y, and likely end the year stuck at 3.7% y/y, according to our models.
Higher inflation will stifle U.S. growth in 2025
Ahead of the tariff threats, U.S. growth was moderating but still firm. The uncertainty surrounding tariffs has derailed consumer confidence, creating a divergence between the “soft” and “hard” economic data. If the tariffs are lasting, it will likely result in a more permanent price shock that will close this hard vs soft gap, wherein a deterioration of the “hard” data would transpire. Upward pressure on prices will continue to squeeze consumer purchasing power and a further retracement in equity markets will likely soon dissuade high earners from spending viz a viz a negative wealth effect.
And in an inflationary environment, deflators will be crucial. Higher prices (and deflators that are larger in magnitude) will have ramifications for real growth. While nominal growth is reflective of consumer activity, after adjusting for higher prices, real growth will look much weaker. In scenario (1) we could see a meaningfully slower growth profile for 2025 where we could see flat growth for the year, whereas scenario (2) significantly increases the odds of a technical recession this year.
The Federal Reserve will be anxiously watching from the sidelines, for now
The Fed will be grappling with conflicting priorities – price acceleration and weaker growth – and will continue to be data dependent to determine which mandate requires an intervention sooner. While weaker growth (and a potential upward movement in the unemployment rate) would create a downside risk to the Fed Funds Rate, it would be difficult to envision the Fed cutting when core inflation is approaching 4% (not to mention the public will unlikely accept this as “transitory”). In assessing the direction of the policy rate, the Fed will have to weigh relative risks to determine which concern bears more weight. Until then, we expect FOMC members will be watching closely from the sidelines with rates on hold for the foreseeable future.
Mike Reid is a Senior U.S. Economist at RBC. He is responsible for generating RBC’s U.S. economic outlook, providing commentary on macro indicators, and producing written analysis around the economic backdrop.
Carrie Freestone is a member of the macroeconomic analysis group and is responsible for examining key economic trends including consumer spending, labour markets, GDP, and inflation.
This article is intended as general information only and is not to be relied upon as constituting legal, financial or other professional advice. The reader is solely liable for any use of the information contained in this document and Royal Bank of Canada (“RBC”) nor any of its affiliates nor any of their respective directors, officers, employees or agents shall be held responsible for any direct or indirect damages arising from the use of this document by the reader. A professional advisor should be consulted regarding your specific situation. Information presented is believed to be factual and up-to-date but we do not guarantee its accuracy and it should not be regarded as a complete analysis of the subjects discussed. All expressions of opinion reflect the judgment of the authors as of the date of publication and are subject to change. No endorsement of any third parties or their advice, opinions, information, products or services is expressly given or implied by Royal Bank of Canada or any of its affiliates.
This document may contain forward-looking statements within the meaning of certain securities laws, which are subject to RBC’s caution regarding forward-looking statements. ESG (including climate) metrics, data and other information contained on this website are or may be based on assumptions, estimates and judgements. For cautionary statements relating to the information on this website, refer to the “Caution regarding forward-looking statements” and the “Important notice regarding this document” sections in our latest climate report or sustainability report, available at: https://www.rbc.com/community-social-impact/reporting-performance/index.html. Except as required by law, none of RBC nor any of its affiliates undertake to update any information in this document.
