The Strait of Hormuz blockade has exposed two chokepoints amid the Middle East conflict: one for fossil fuels, and another for Western decarbonization policies. In many respects, it is China that’s leading the global energy transition. Emerging trade data highlights China’s often-underappreciated position in global clean energy supply chains, which has only accelerated with the Hormuz crisis.
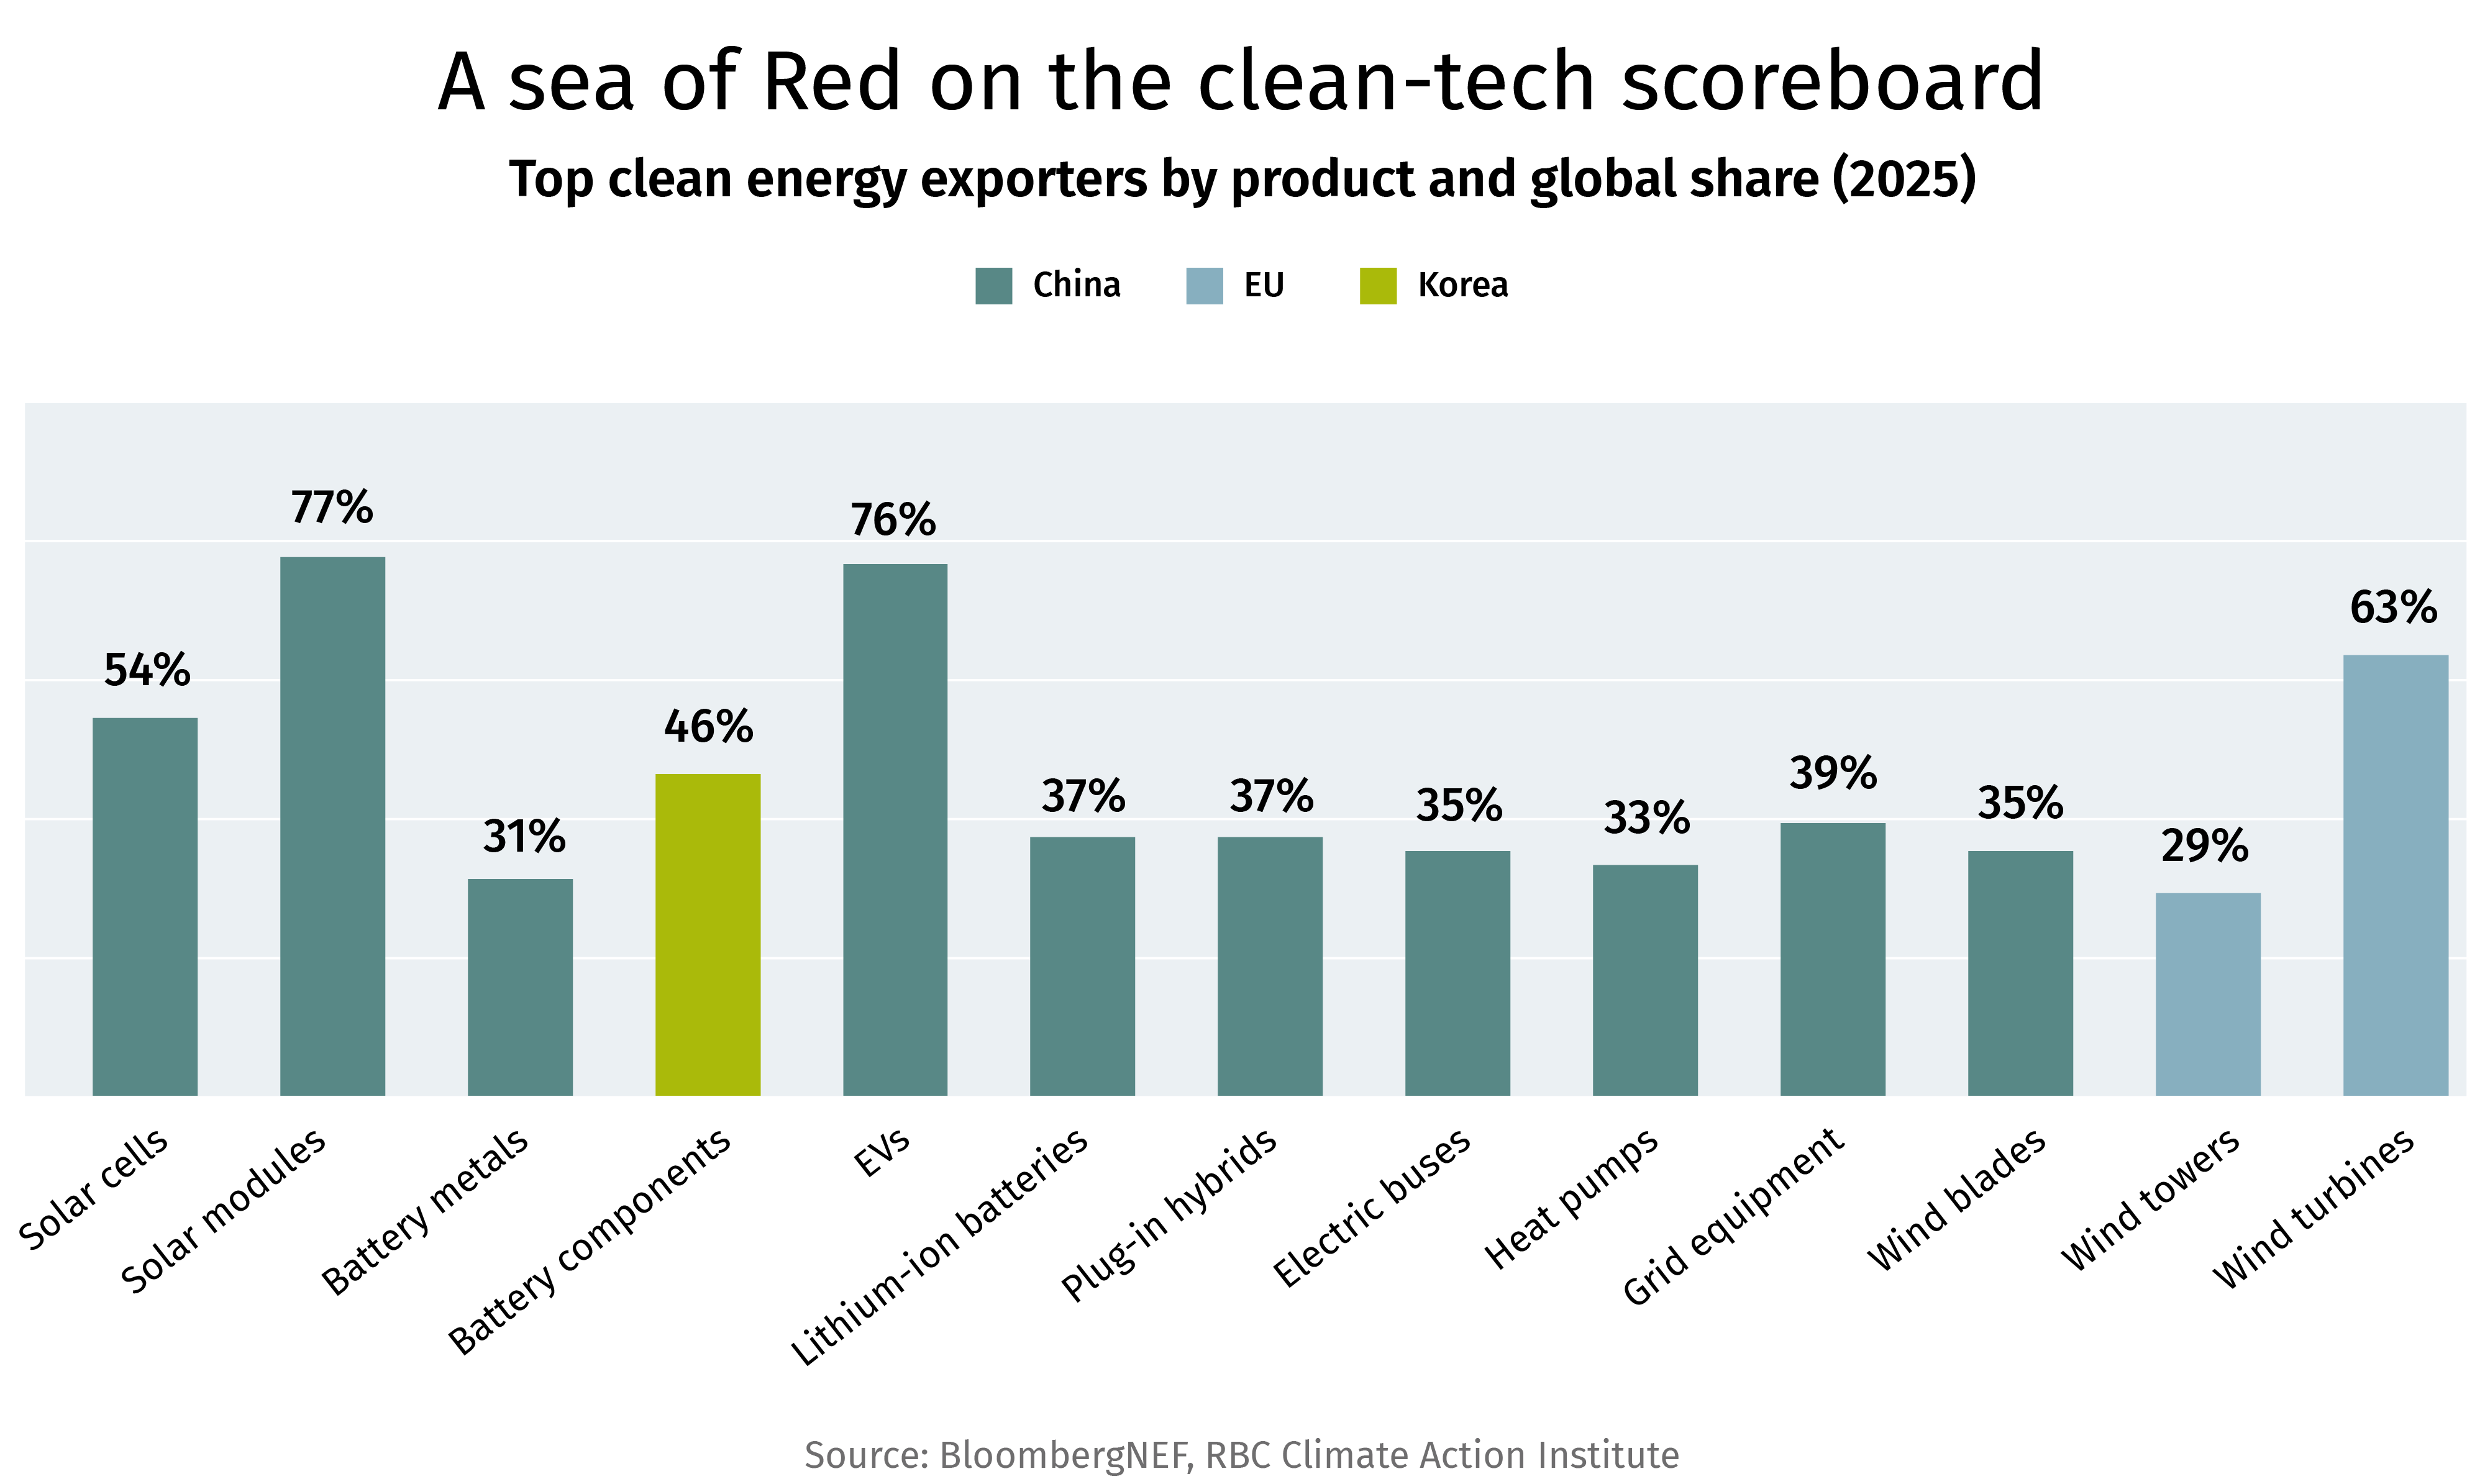
China is the largest exporter of almost every major clean technology, often by a significant margin. Non-Chinese leaders—the E.U. for wind towers and turbines, and South Korea for battery components—either source from, or invest alongside, China. In North America, geopolitical sensitivities (to date) have outweighed benefitting from China’s structural advantage.
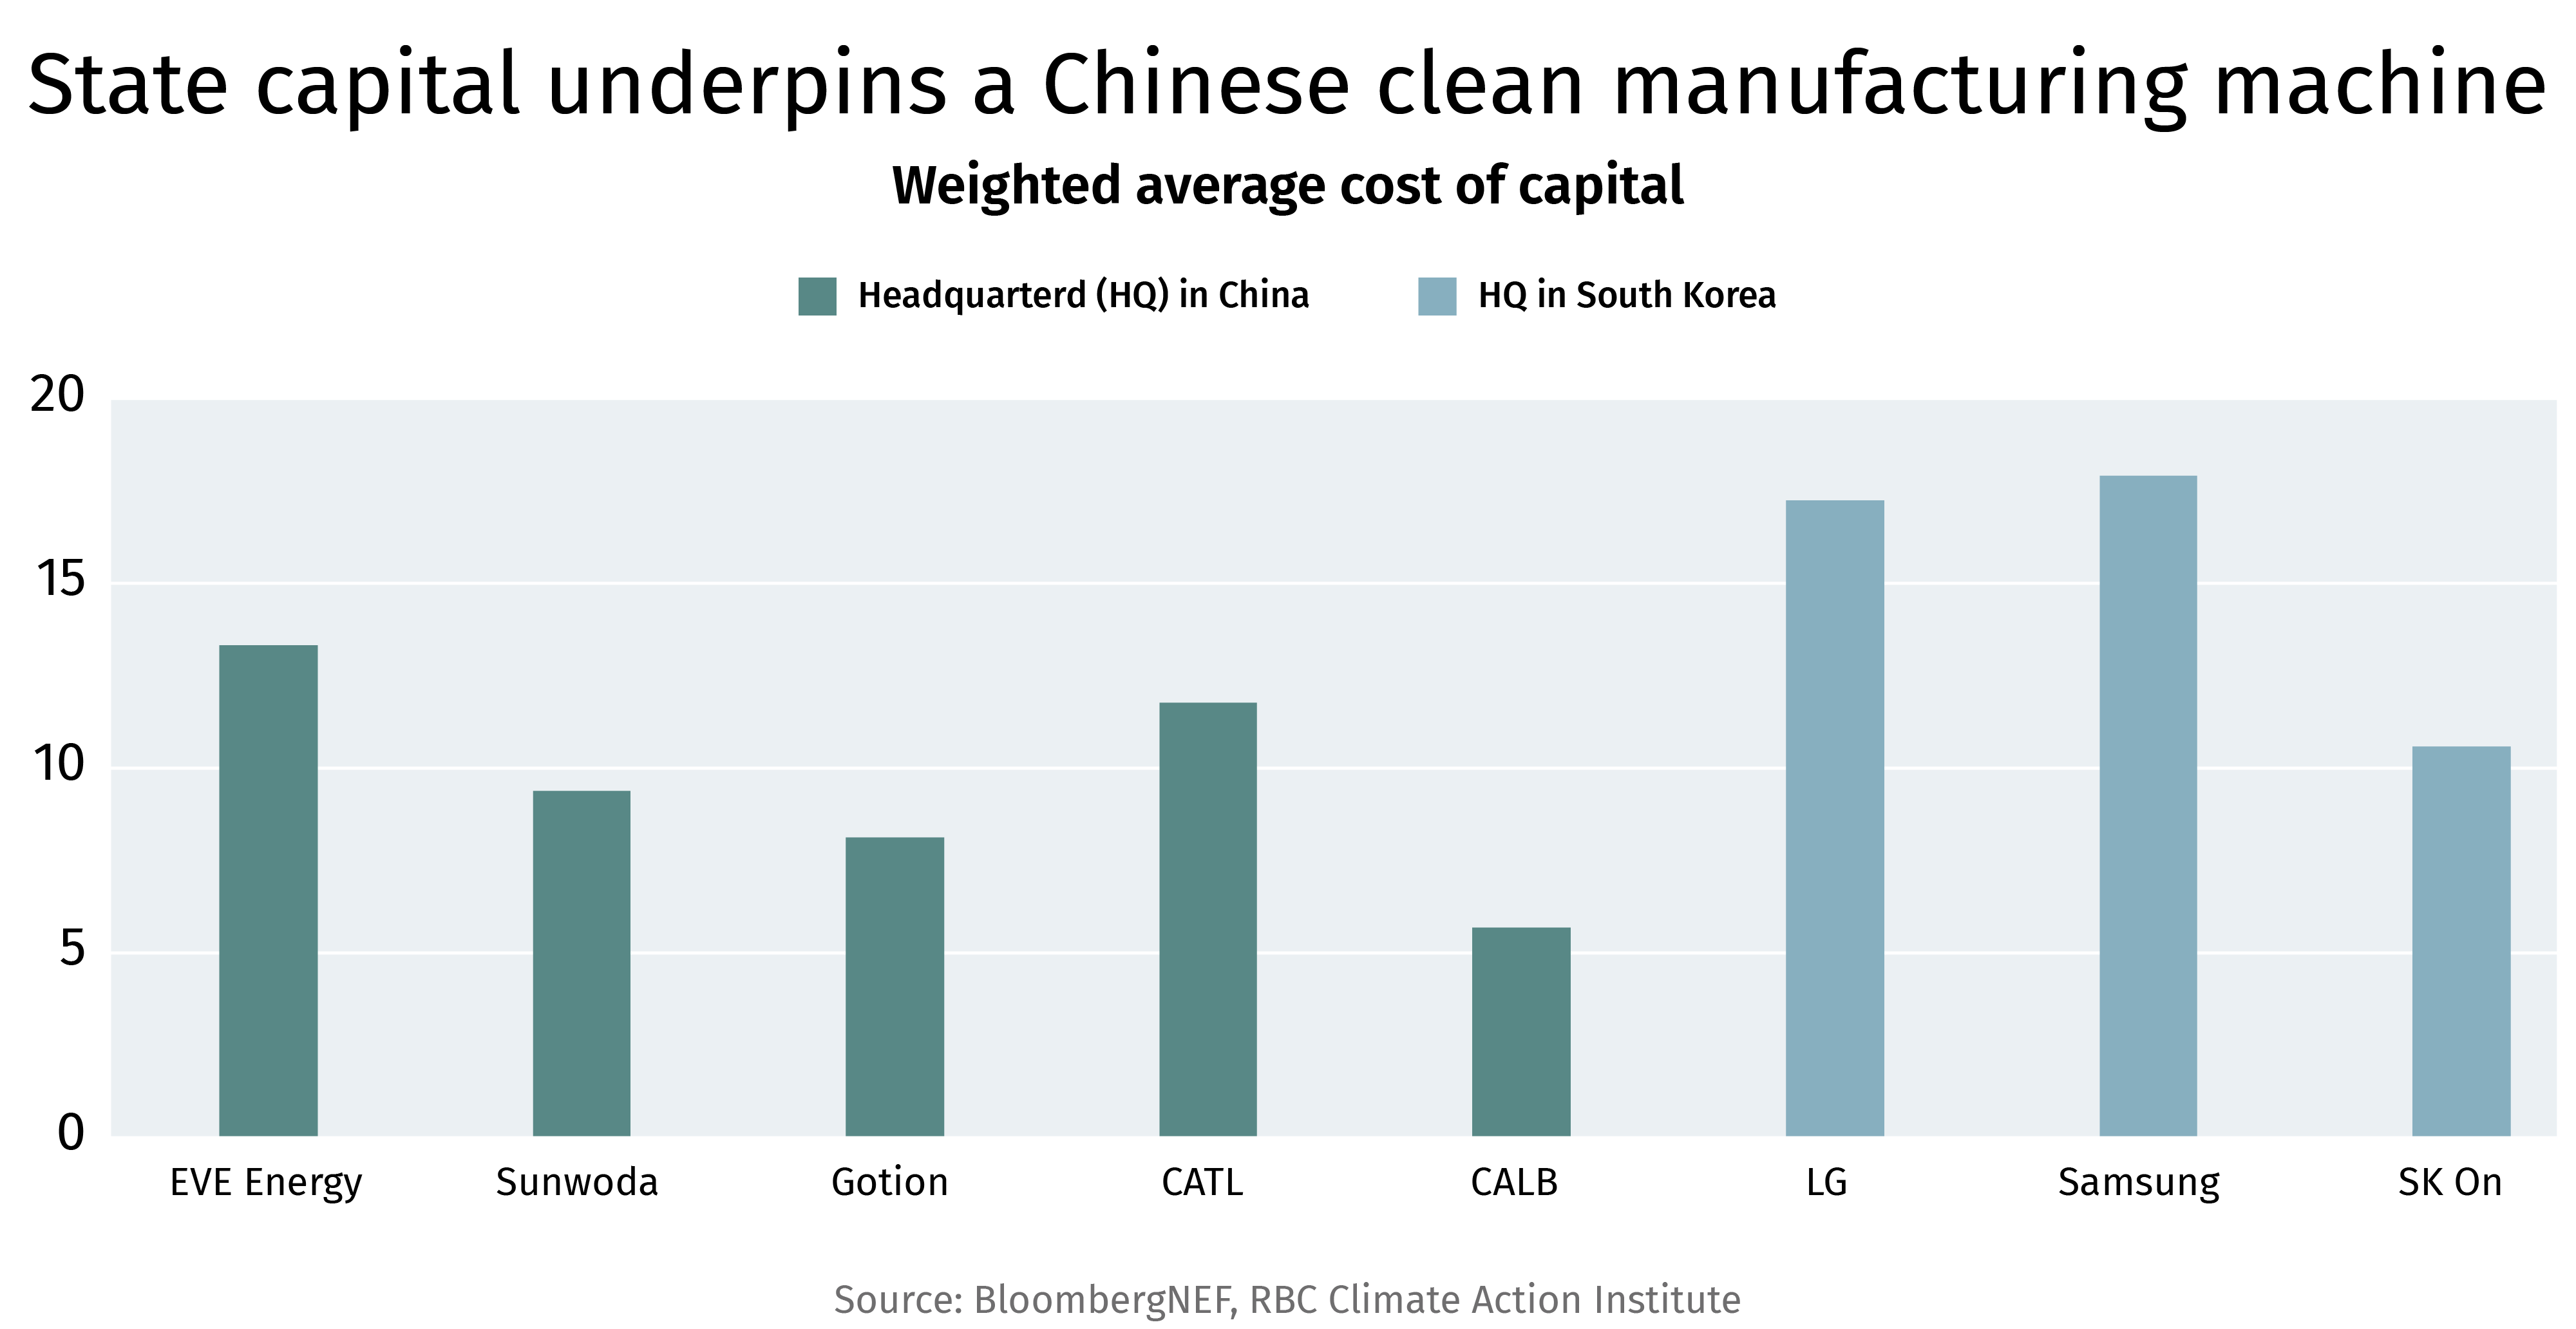
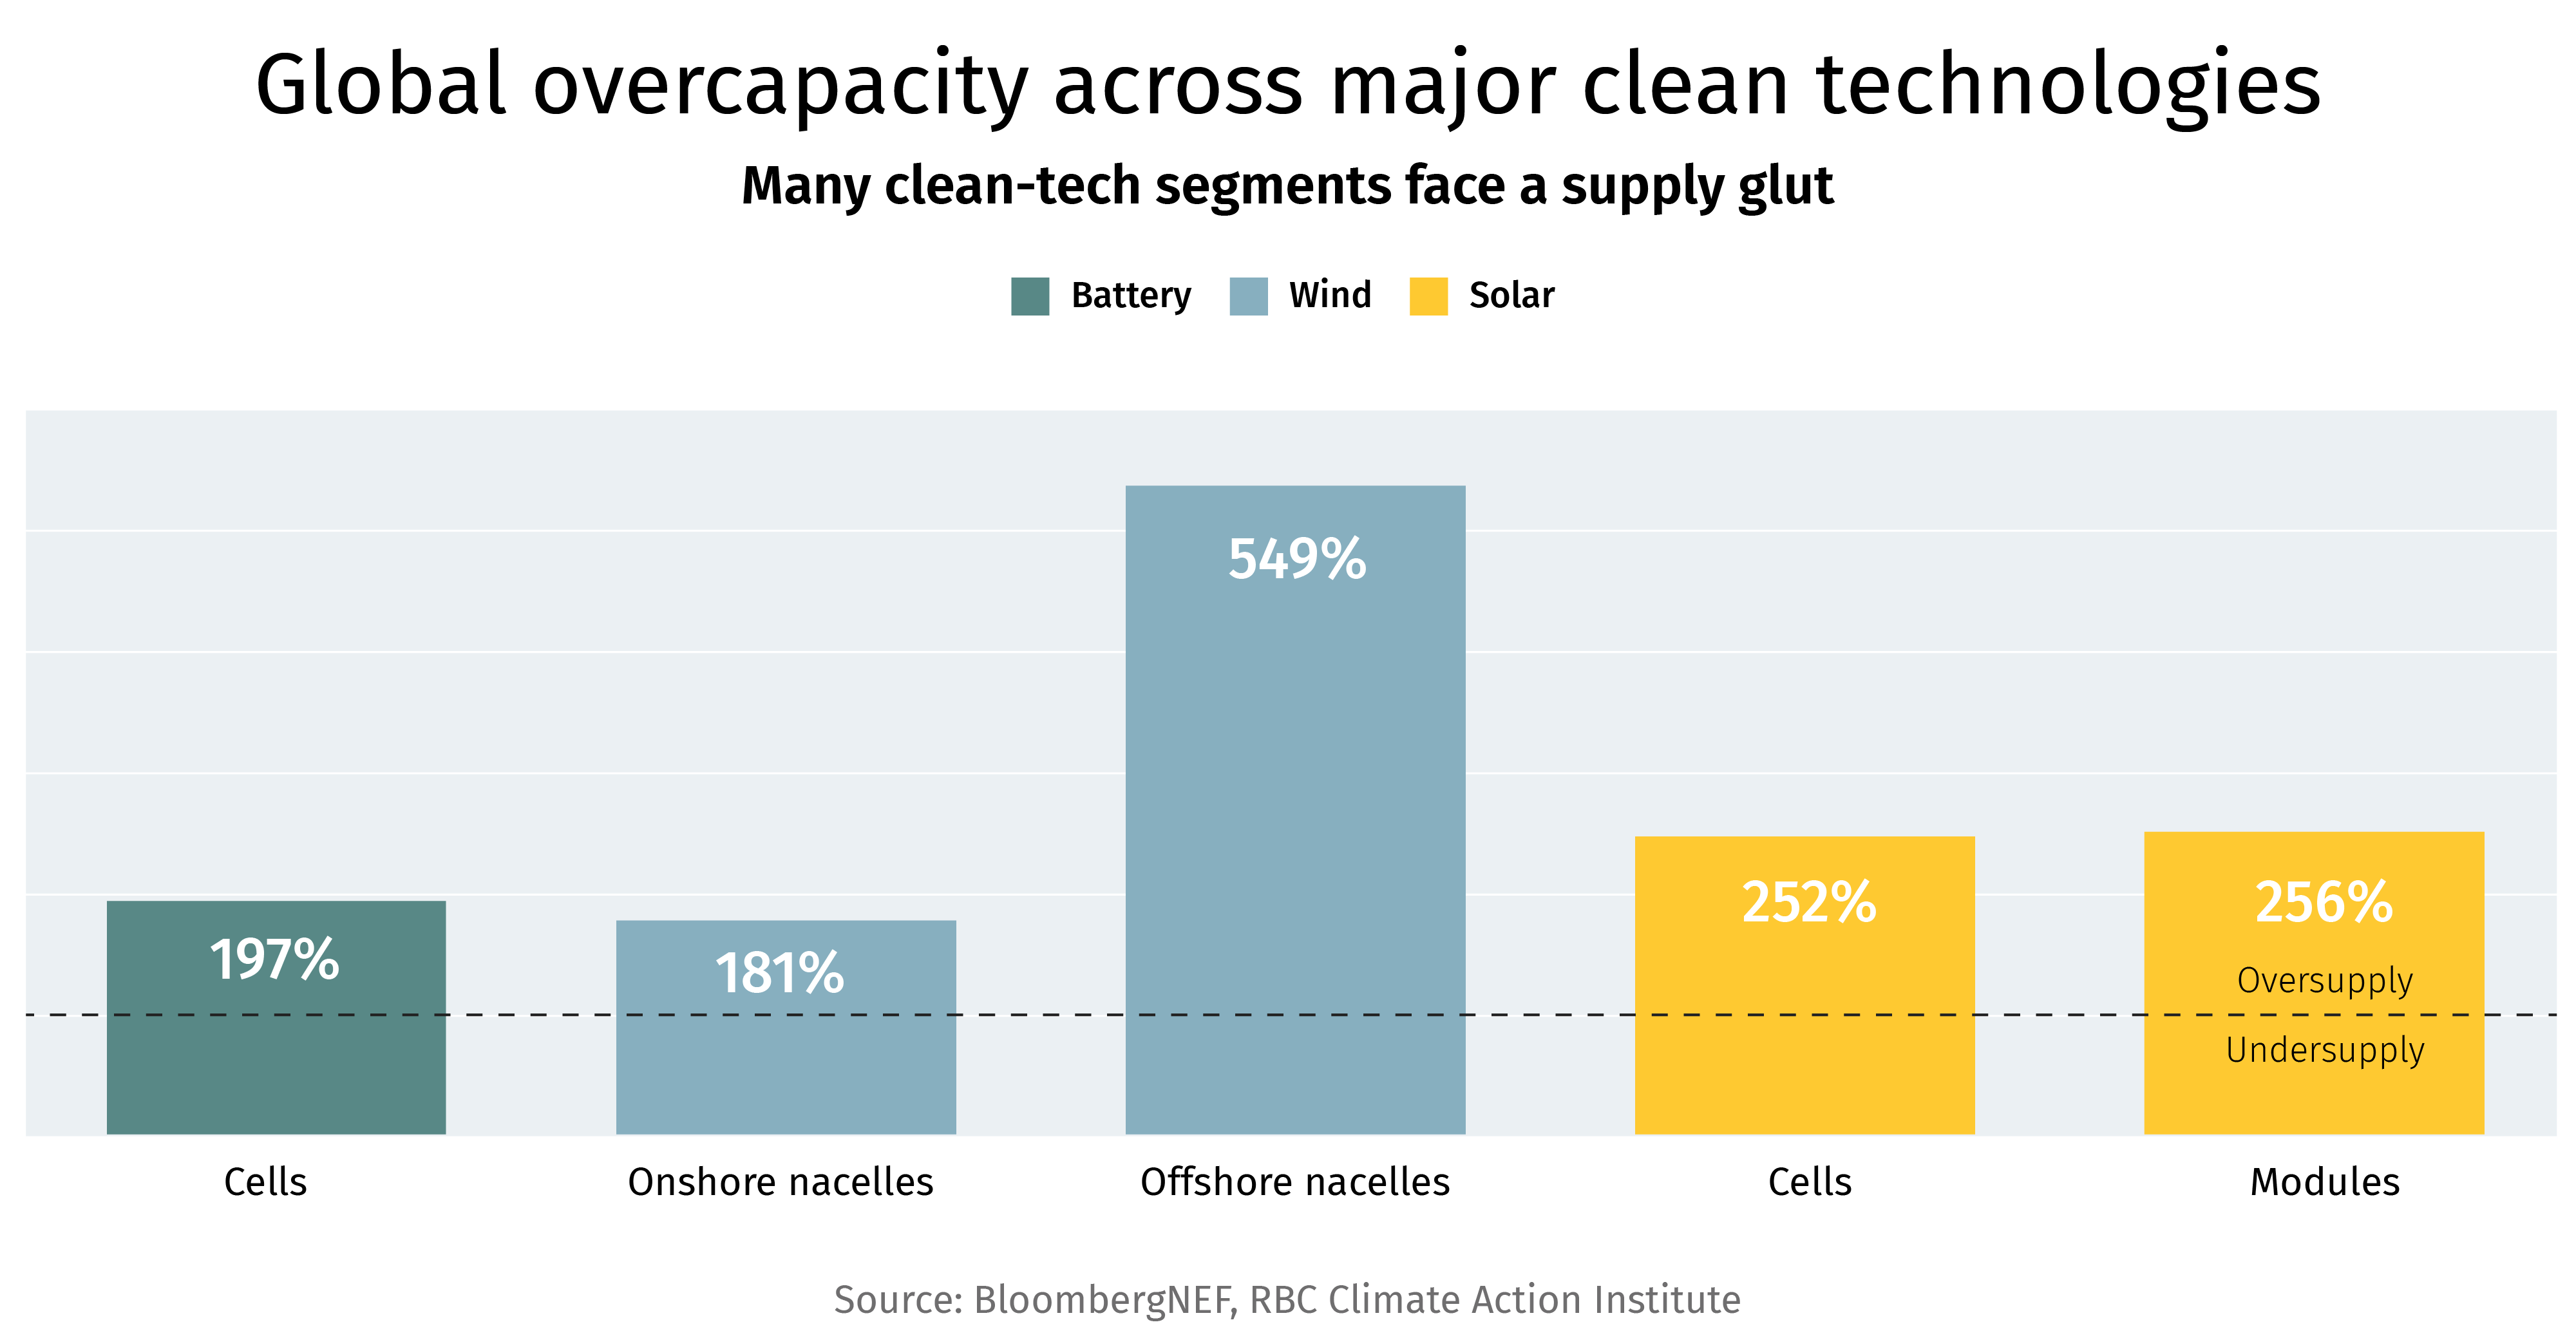
Chinese producers carry a structurally lower cost of capital than peers—state backing and preferential financing, which in turn often generates and perpetuates overcapacity at a scale private markets cannot, and would not, sanction. This creates a self-reinforcing cycle of fierce domestic competition where only the fittest survive, resulting in a cost floor that continues to fall. If and when demand responds, China is best suited to gain incremental market share given the overcapacity. China has since tried to slow this competition through self-discipline agreements among manufacturers, but thus far has been unsuccessful.
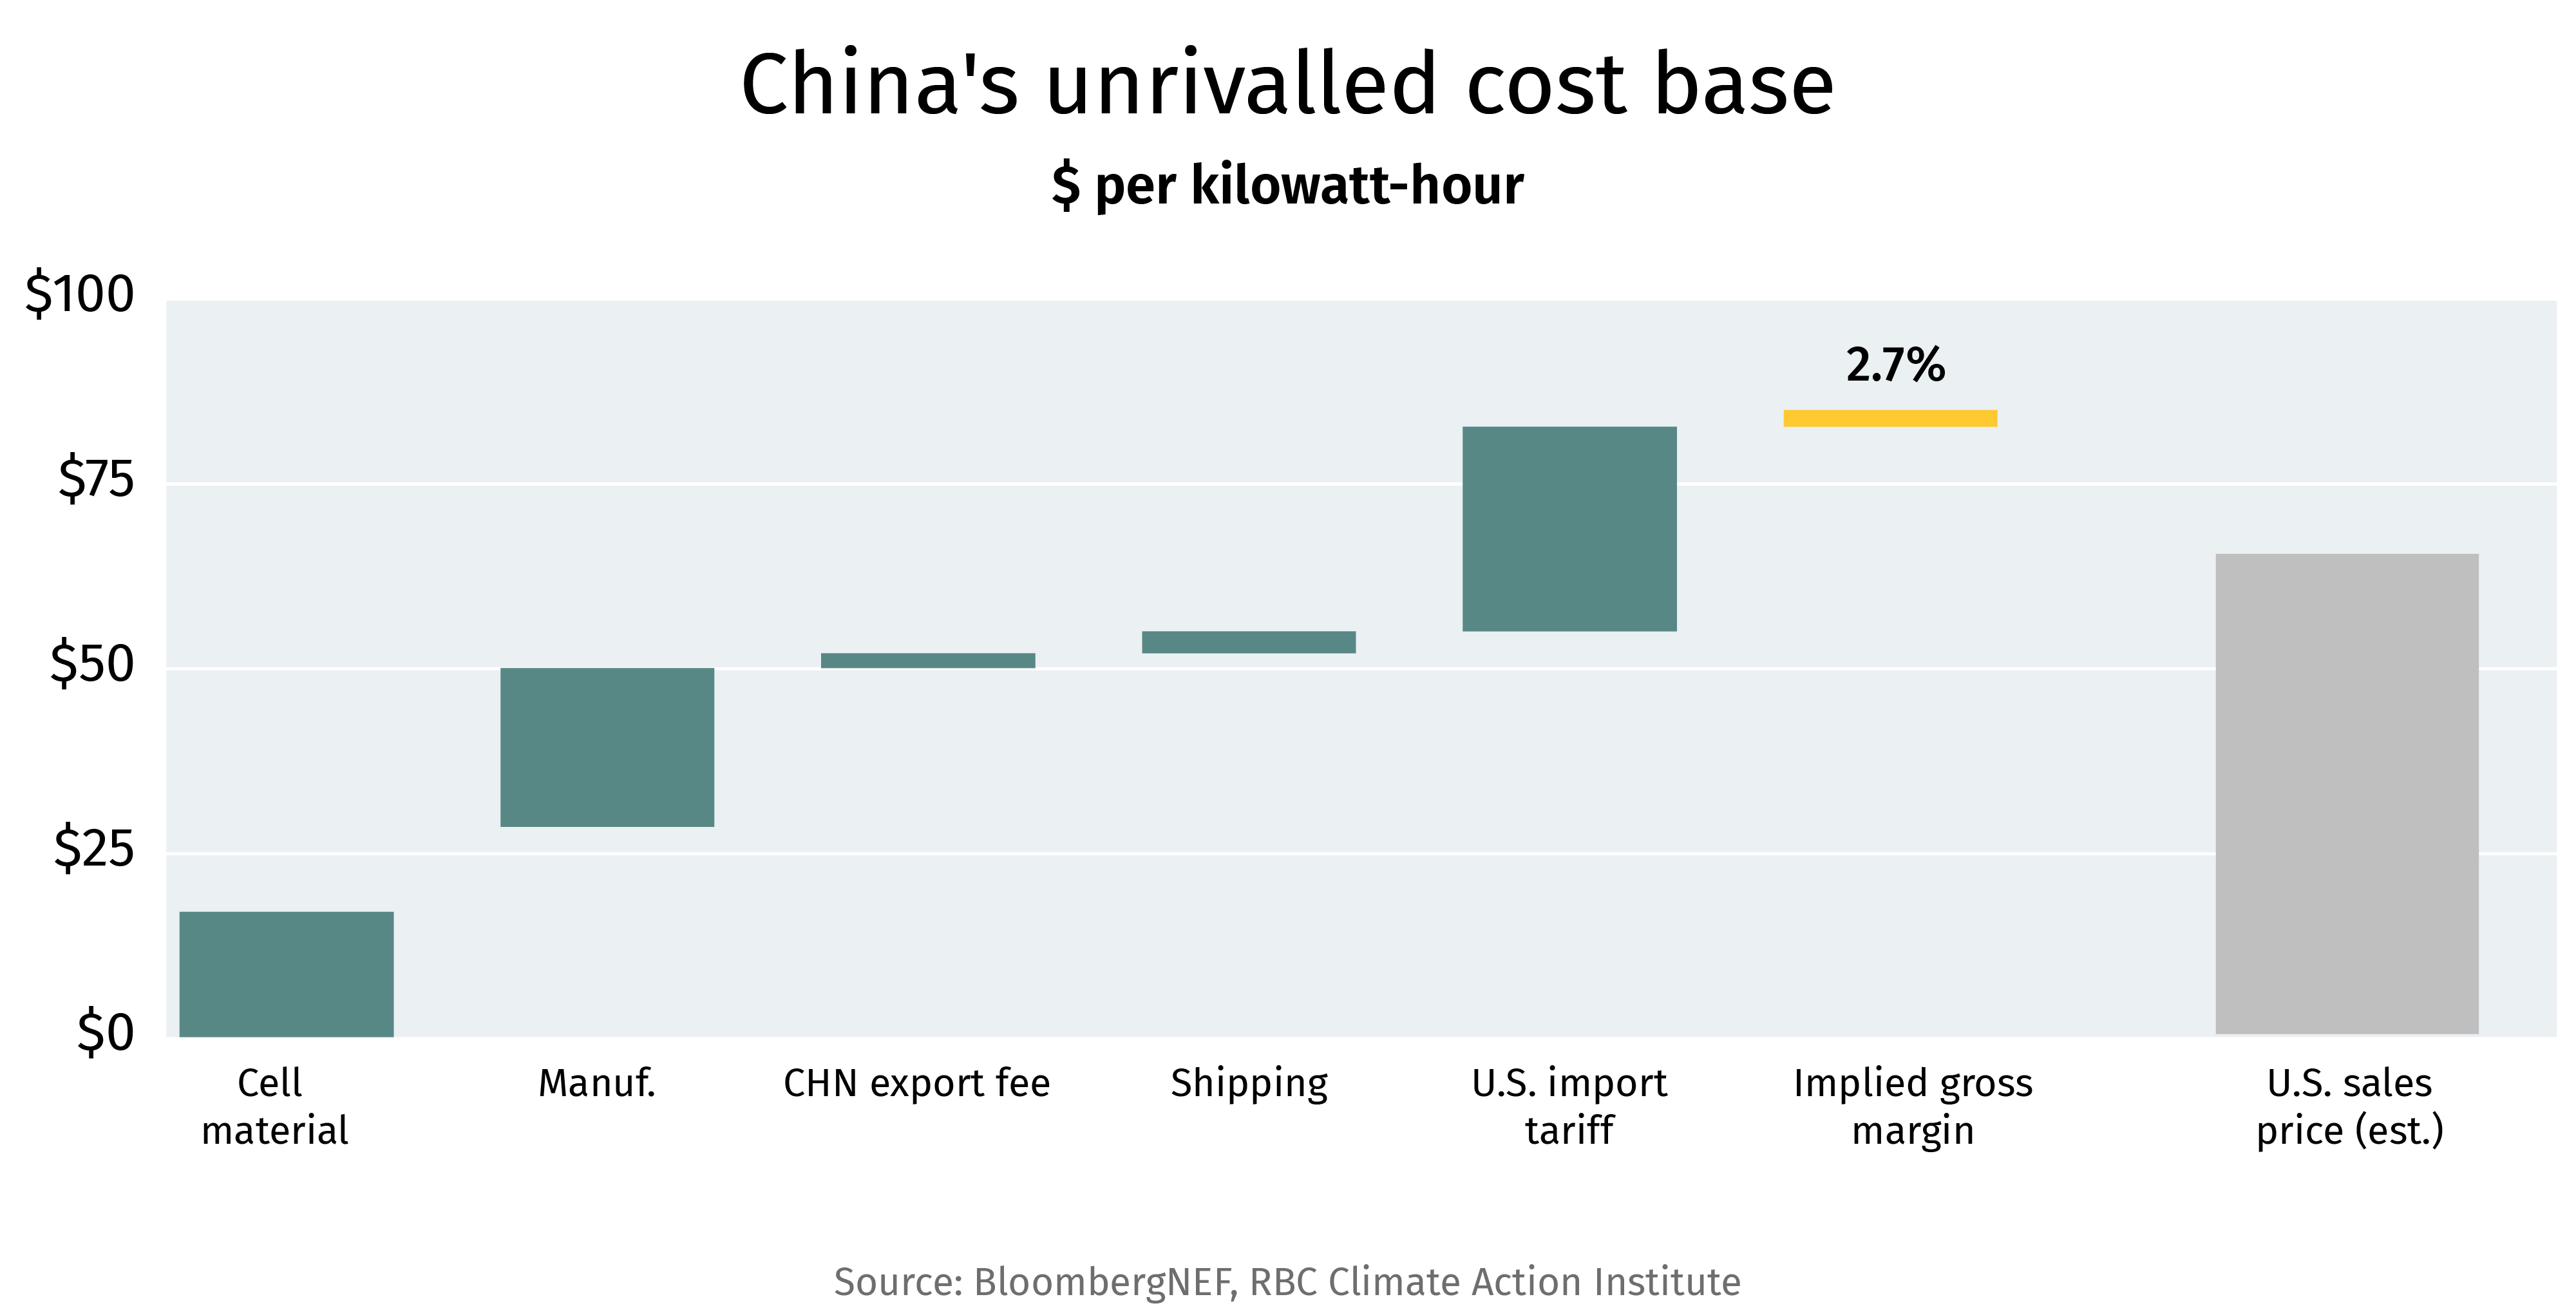
Chinese cell materials and manufacturing account for less than US$50 of an US$84 per kilowatt-hour (kWh) delivered cost for battery cells sold into the U.S. The import tariff adds US$27/kWh—more than China’s entire manufacturing cost. Still, Chinese exporters earn a 2.7% margin.
By comparison, S&P Global estimates North American NCM811 (nickel-cobalt-manganese) battery cells cost roughly US$95/kWh, around 90% more expensive than Chinese battery cost. To put this into context, a Tesla Model Y Standard Range carries a 60 kWh LFP (Lithium Iron Phosphate) battery pack. At median Chinese LFP pack prices of US$81/kWh (as per Bloomberg NEF data), a similar sized battery would cost roughly US$4,900 ($6,500), or about 13% of the Model Y’s Canadian sticker price.
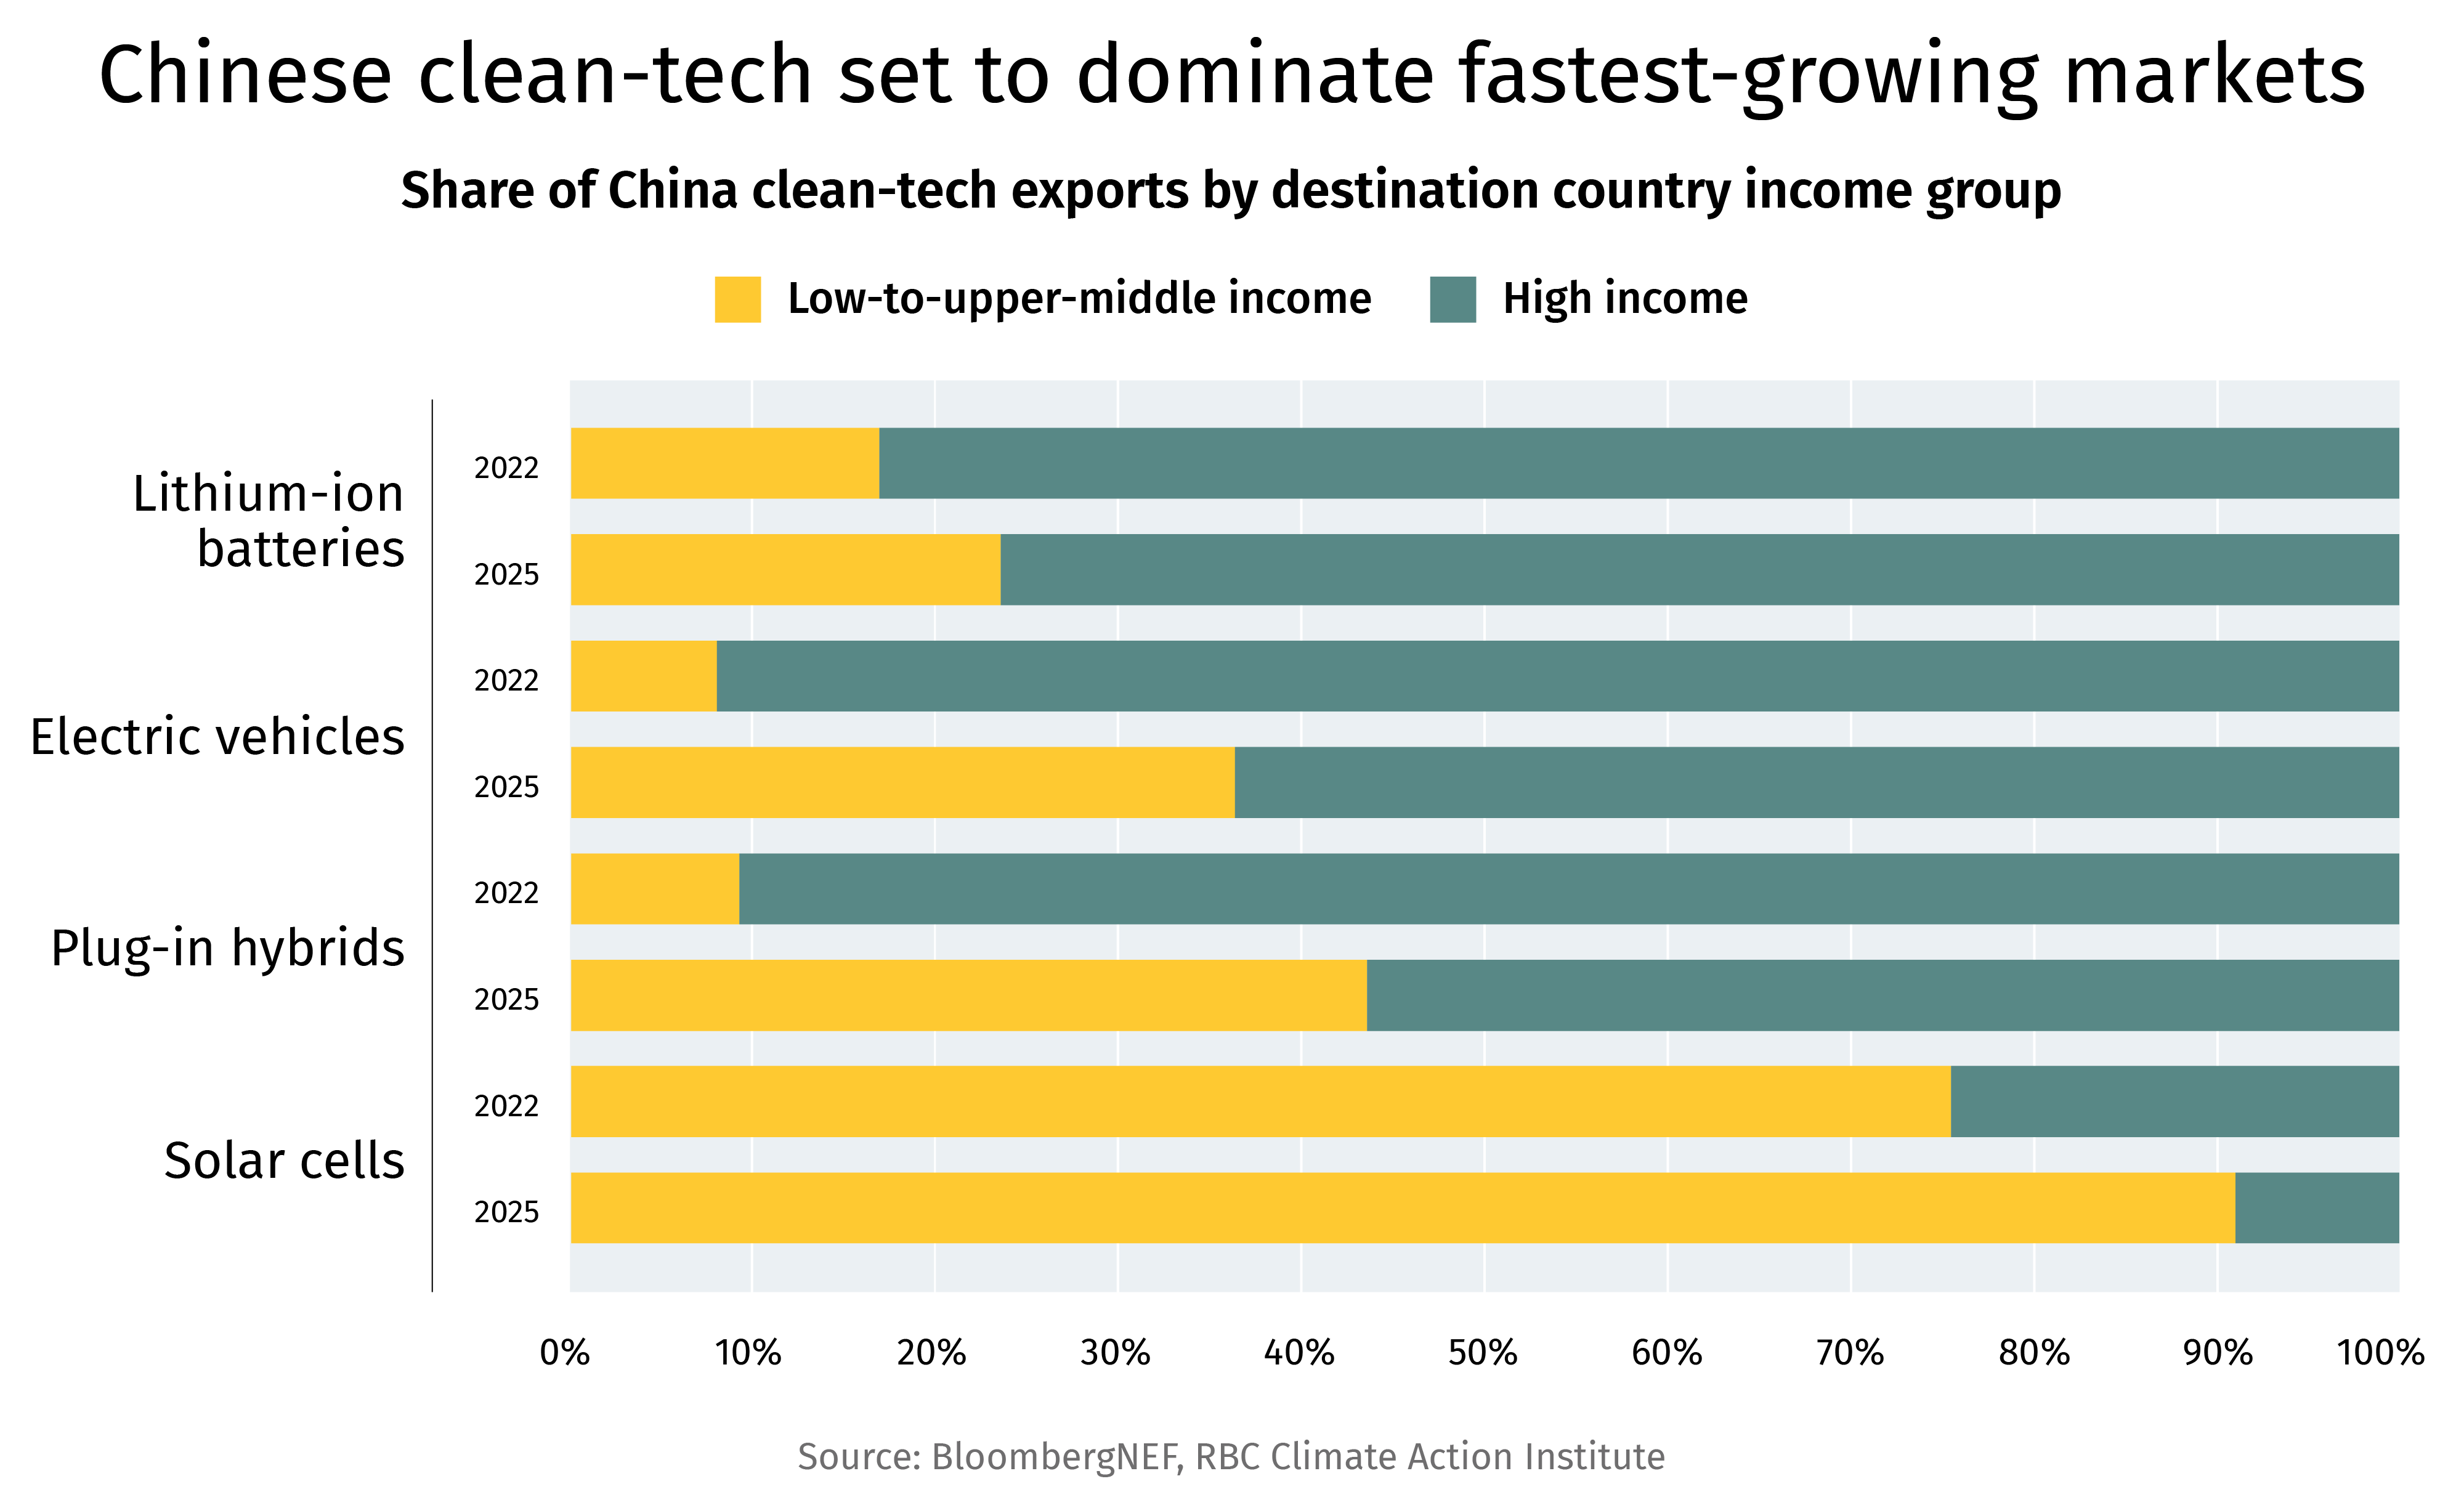
While the West is often fixated with the higher cost of clean technologies, roughly 40% of China’s EV exports and over 90% of solar cell exports went to lower-income countries in 2025. China’s cost base has unlocked a category of clean buyer no Western producer will likely ever reach—fast-growing markets, concentrated in Asia, where clean energy adoption is accelerating rapidly.
Pakistan added 18.3 GW of solar in 2025 alone—75% of Canada’s entire installed solar and wind capacity to date—mostly imported from China. Adoption of EVs in Vietnam and Thailand—countries where nominal GDP per capita is less than $10,000—run north of 40% and 20%, respectively (Canada’s EV adoption in 2025 stands at 11%). Vietnam and Thailand do not provide fiscal incentives for the purchase of electric vehicles.
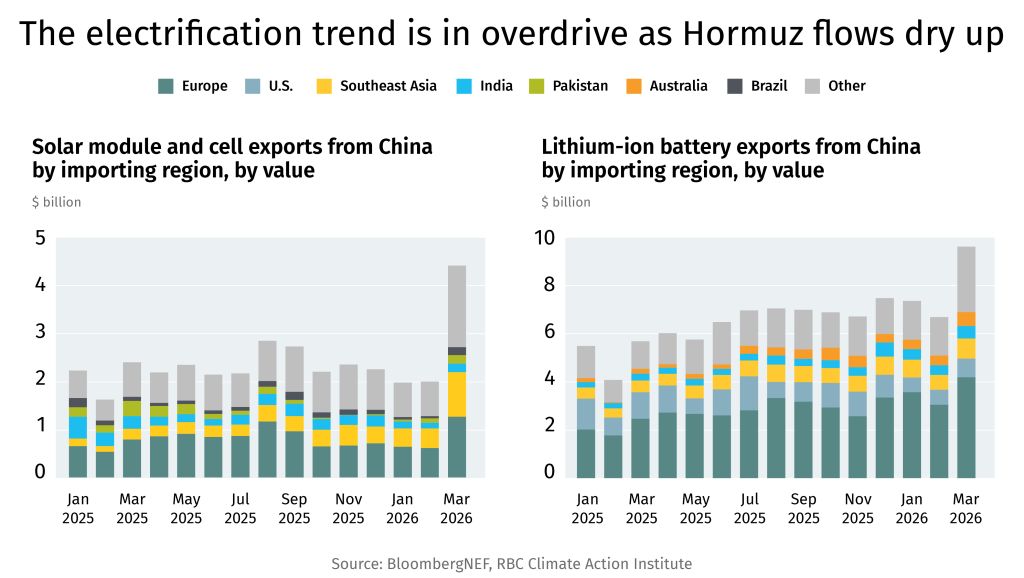
The Middle East conflict that choked the Strait of Hormuz brought the electrification trend into focus, with fossil-fuel importing countries accelerating their clean energy procurement.
As a result, Chinese battery exports reached nearly US$10 billion in March of 2026 alone, with Europe, Southeast Asia and the Middle East absorbing the volume. U.S. demand was just 8% of March exports.
The transition is happening on Chinese terms. South Korea and Europe have treated that as a sourcing and partnership question, rather than a binary one, and have advanced as a result. North America must also pursue strategies that find a balance between utilizing Chinese content but also building a domestic base that can compete and scale up to meet the opportunity offered by the global energy transition.
Shaz Merwat is Energy Policy Lead at the RBC Climate Action Institute
This article is intended as general information only and is not to be relied upon as constituting legal, financial or other professional advice. The reader is solely liable for any use of the information contained in this document and Royal Bank of Canada (“RBC”) nor any of its affiliates nor any of their respective directors, officers, employees or agents shall be held responsible for any direct or indirect damages arising from the use of this document by the reader. A professional advisor should be consulted regarding your specific situation. Information presented is believed to be factual and up-to-date but we do not guarantee its accuracy and it should not be regarded as a complete analysis of the subjects discussed. All expressions of opinion reflect the judgment of the authors as of the date of publication and are subject to change. No endorsement of any third parties or their advice, opinions, information, products or services is expressly given or implied by Royal Bank of Canada or any of its affiliates. This document may contain forward-looking statements within the meaning of certain securities laws, which are subject to RBC’s caution regarding forward-looking statements. ESG (including climate) metrics, data and other information contained on this website are or may be based on assumptions, estimates and judgements. For cautionary statements relating to the information on this website, refer to the “Caution regarding forward-looking statements” and the “Important notice regarding this document” sections in our latest climate report or sustainability report, available at: https://www.rbc.com/our-impact/sustainability-reporting/index.html. Except as required by law, none of RBC nor any of its affiliates undertake to update any information in this document.