
Bottom line:
CPI inflation continued to moderate in January. Headline inflation reported below expectations at 0.2% m/m while core came in at consensus 0.3% m/m. This was one of the lower core m/m prints in January in the post-Covid economy. But tariff pressures are being masked by declines elsewhere – most of the help in the core goods space came from a notable -1.8% m/m decline in used car prices, a sector that is insulated from tariffs.
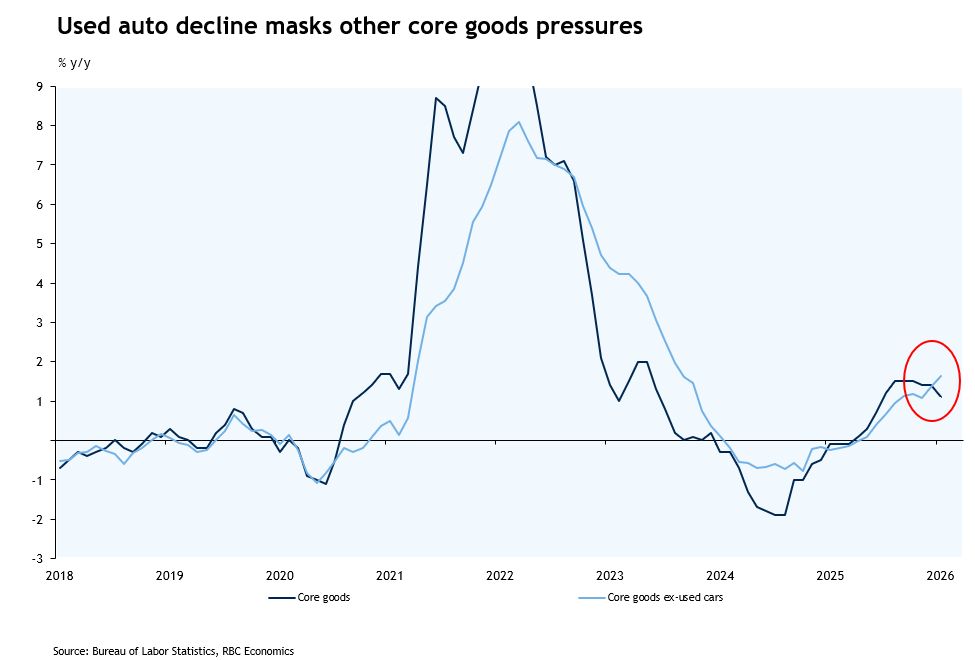
In fact, when we strip out used cars from the core goods basket, the trend is concerning: the core goods basket with used cars was flat in January, but without it was up 0.36% m/m. And on a y/y basis the measures are now moving in opposite directions suggesting that the outsized weight of used cars is offsetting the price increases in other core goods. Only two sectors in the core goods basket have seen price declines since April 2025: used cars and IT equipment. The latter can be influenced by quality adjustments – technological improvements are a factor in how BLS measures that sector. We are not calling for a massive re-acceleration in core inflation, but when you are looking at core services remaining elevated (0.4% m/m) and a core goods basket that will continue to grind higher, we continue to expect sticky inflation will remain an issue in 2026.
Here’s what stood out to us in this morning’s report:
1) Tariff pressures masked by used cars in core goods basket
-
Despite an upside to December PPI, businesses have yet to meaningfully pass on higher prices to consumers. Core goods were entirely flat in January (+0.0%) and continue to be outpaced by core services.
-
Still, the notable decline in used car prices (-1.8% m/m) helped offset increases elsewhere within the core goods basket. And used cars are not directly impacted by tariffs pressures. New car prices rose by a modest +0.1% m/m.
-
Looking at other trade-exposed sectors, we saw apparel and household furnishings report hotter price growth than other categories in the goods space at +0.3% m/m.
-
Recreation goods was elevated at 0.6% m/m, with pressure coming from electronics and sporting goods.
2) Housing continues to help core services – but additional disinflation will be limited in 2026
-
Shelter price growth continued to cool in January (+0.2% m/m) with the year-over-year pace now at 3.0% (it was at 3.6% just four months ago). But we cannot be entirely convinced that we are getting a clean read on the largest CPI sector, Owners’ equivalent rent (OER).
-
When October data was missing due the government shutdown, the BLS was forced to adjust its calculations – this creates challenges down the pipeline interpreting the monthly values and will continue to do so until the May data is released.
-
It may well be the case that OER is coming in lower than it otherwise would be, but we will not get a clean read for months. We caution against giving too much weight to the narrative of OER moderating, especially in an environment where core PCE (which weighs housing less heavily) is running hotter than CPI – this is exceptionally unusual.
3) Lower energy prices pressures helped headline inflation
-
A sizeable decline in energy commodities (-3.3% m/m) subtracted nearly one-tenth from month-over-month headline growth.
-
At the same time, cooler food prices (+0.2% m/m) should help buoy consumer spending – but elevated farmer input prices remain a key risk in pushing food higher.
-
Both factors meant headline growth registered unexpectedly soft (+0.2% m/m vs +0.3% m/m consensus). Amidst massive geopolitical uncertainty, oil prices continue to be a wild card.
4) The January CPI data adds conviction to our assumed Fed pause
-
A hotter core services print (+0.4% m/m) paired with the January downshift in the unemployment rate (now 4.3%) alongside a strong payroll gain, adds additional conviction to our assumption of a long Fed pause.
-
While core price growth undershot prior “January effects” (from 2021 to 2025, core CPI has averaged +0.36% m/m), inflation remains on a sticky trajectory. We expect that the Fed will be mindful of this when assessing optionality at the March meeting.
About the authors
Mike Reid is Head of U.S. Economics at RBC. He is responsible for generating RBC’s U.S. economic outlook, providing commentary on macro indicators, and producing written analysis around the economic backdrop.
Carrie Freestone is a Senior US Economist at RBC Capital Markets. Carrie is responsible for projecting key US indicators including GDP, employment, consumer spending and inflation for the US. She also contributes to commentary surrounding the US economic backdrop which she delivers to clients through publications, presentations, and the media.
Imri Haggin is an Economist at RBC Capital Markets, where he focuses on thematic research. His prior work has centered on consumer credit dynamics and treasury modeling, with an emphasis on leveraging data to understand behavior.
This article is intended as general information only and is not to be relied upon as constituting legal, financial or other professional advice. The reader is solely liable for any use of the information contained in this document and Royal Bank of Canada (“RBC”) nor any of its affiliates nor any of their respective directors, officers, employees or agents shall be held responsible for any direct or indirect damages arising from the use of this document by the reader. A professional advisor should be consulted regarding your specific situation. Information presented is believed to be factual and up-to-date but we do not guarantee its accuracy and it should not be regarded as a complete analysis of the subjects discussed. All expressions of opinion reflect the judgment of the authors as of the date of publication and are subject to change. No endorsement of any third parties or their advice, opinions, information, products or services is expressly given or implied by Royal Bank of Canada or any of its affiliates.
This document may contain forward-looking statements within the meaning of certain securities laws, which are subject to RBC’s caution regarding forward-looking statements. ESG (including climate) metrics, data and other information contained on this website are or may be based on assumptions, estimates and judgements. For cautionary statements relating to the information on this website, refer to the “Caution regarding forward-looking statements” and the “Important notice regarding this document” sections in our latest climate report or sustainability report, available at: https://www.rbc.com/community-social-impact/reporting-performance/index.html. Except as required by law, none of RBC nor any of its affiliates undertake to update any information in this document.
