
Diversifying exports outside of the United States has emerged as a critical offset to tariff pressures for Canada with higher gold exports exaggerating gains from foreign markets.
Total nominal merchandise exports declined by just 0.8% or $5.9 billion1 year-over-year, a comparatively modest outcome that defied initial concerns of severe losses.
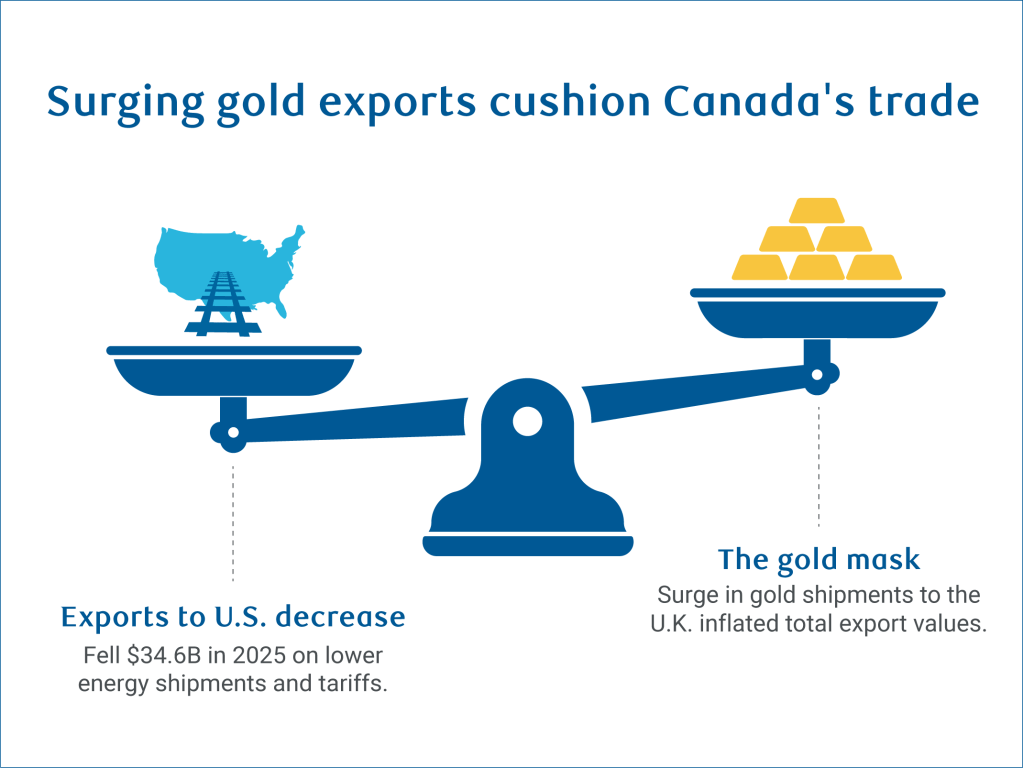
Much of the $34.6 billion, or 6%, year-over-year decline in Canadian merchandise exports to the U.S. in 2025 was offset by a $28.6 billion rise in exports to the rest of the world. It reduced the U.S. share of total Canadian exports from 76% in Q4 2024 to 68% in Q4 2025.
The caveat is these non-U.S. export gains didn’t come primarily from diversifying exports in highly tariffed sectors. Shipments of steel products, motor vehicles and parts, and wood products largely didn’t find alternative markets.
The increase had more to do with a price surge in gold exports, and the new TMX pipeline increasing export capacity outside of North America.
Manufacturing-heavy regions such as Quebec and Ontario bore the brunt of U.S. tariff pressures, while energy-producing and some agricultural exporting provinces benefitted more from offsetting gains outside the U.S.
All that glitters is gold but not when adjusting for prices
The United Kingdom accounted for a large share of Canadian exports outside of the U.S. with nominal exports rising $18 billion2. Its share of Canadian market climbed from just under 4% to above 6% from 2024 to 2025.
China, the Netherlands, and Germany also gained market shares expanding by 0.6, 0.3, and 0.3 percentage points, respectively. These gains collectively offset much of the 4 percentage point year-over-year decline in the U.S. share.
Much of the gain reflected gold price spikes as global investors diversified portfolios with precious metals amid heightened uncertainty.
Gold exports3 to the U.K. surged by a nominal $17 billion, or 76%, in 2025—making gold Canada’s second-largest export after crude oil—significantly cushioning declines in other goods.
In real terms4, however, total merchandise exports declined by about 2% ($12.4 billion) year-over-year. Real exports to the U.S. fell by an estimated $25 billion, or 6%, driven primarily by weaker energy exports as U.S. oil production rose, reducing demand for foreign crude, and tariffed goods.
Meanwhile, real exports to non-U.S. markets increased by $13 billion, or 10%.
The U.K. may not be final destination for gold exports
Elevated gold exports to the U.K. partly reflect its role as a global hub for gold trading and storage. A large share of global bullion is bought, sold, and held through financial institutions in London, which serves as a central clearing and custody point. Gold shipments to the U.K. can rise when investors and institutions adjust holdings, particularly during periods of heightened global uncertainty, or when gold is redistributed between storage locations. Importantly, these transactions may reflect financial repositioning rather than changes in production or consumption, given gold’s primary role as a store of value.
Similarly, higher aluminum exports to the Netherlands may reflect Rotterdam’s position as a major European shipping and distribution hub. Metals arriving at the port could be stored, and then redistributed to other regional countries.
Taken together, these trade flows could reflect how and where commodities are routed through global markets rather than changes in final demand in both the U.K. and the Netherlands.
Surge in gold shipments masks export hit in Ontario
The performance of exports by province varied greatly, reflecting differences in tariff exposure and ability to diversify.
Manufacturing-intensive provinces faced significant headwinds. Quebec’s nominal exports5 fell 2.4% year-over-year as aluminum and motor vehicle tariffs weighed on U.S. shipments. Increased aluminum exports to the Netherlands, iron ore to China, alongside stronger aircraft and parts to Germany, France and Australia only provided partial relief.
Ontario saw a $9.3 billion increase in total exports despite facing similar tariff pressures, reflecting higher gold exports to the U.K. Ontario’s exports fell 3.2% year-over-year (or $8 billion), excluding gold.
Manitoba also experienced steep export losses as marginal gains to non-U.S. markets couldn’t offset weaker pharmaceutical and machinery exports to the U.S.
Saskatchewan faced headwinds from both U.S. and Chinese tariffs with exports declining $3 billion and $1.5 billion, respectively (mostly canola products to China). The province partially offset these losses through greater market diversification for its mining and agricultural exports, including higher potash exports to Brazil, and canola seed to Japan and Mexico.
British Columbia’s exports were flat overall as weaker U.S. shipments of lumber and aluminum were offset by higher copper exports to China.
Energy-producing provinces tap other markets
Newfoundland and Labrador offset weaker U.S. demand through increased energy exports to the Netherlands, Germany, and the U.K.
Despite significant overall export declines partly due to lower oil prices, Alberta leveraged the first full year of the Trans Mountain pipeline expansion to access Asian markets, offsetting nearly half of its weaker U.S. exports, and with record crude volume exports in 2025.
Balancing tariff pressures with diversification goals
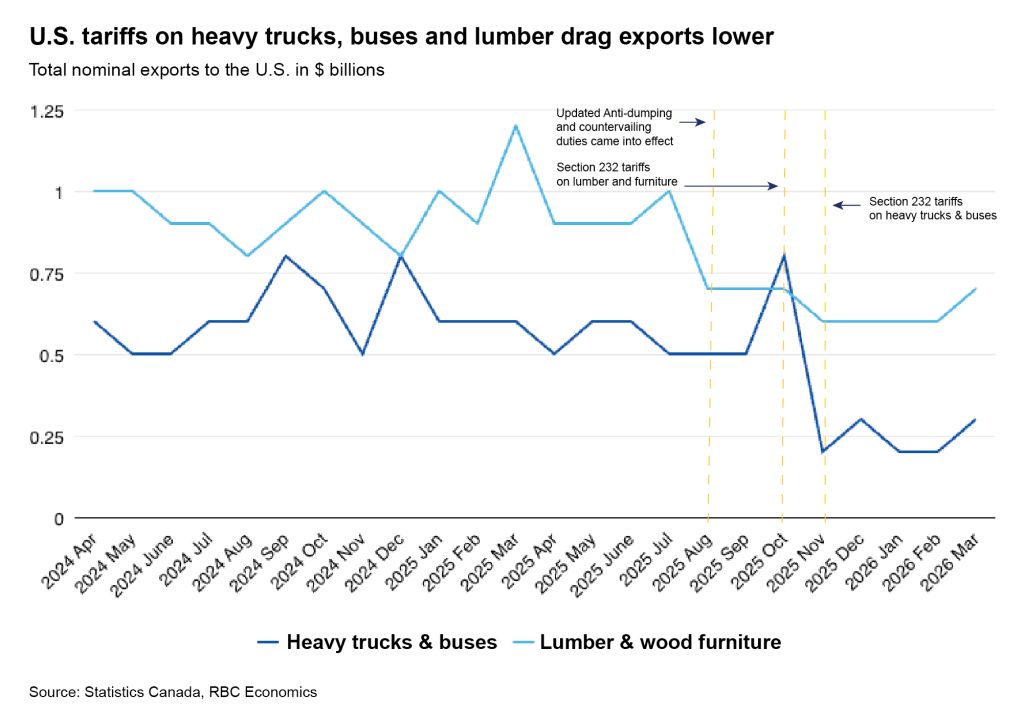
The effects of additional product-specific U.S. tariffs implemented late in 2025, particularly on heavy trucks, buses and lumber (accounting for roughly 3.2% of total Canadian nominal merchandise exports to the U.S. in 2024), are expected to become more visible in trade data this year if sustained.
Exports of these products have already declined notably since tariffs, anti-dumping and countervailing duties were implemented.
Revisions to tariffs on steel, aluminum, and copper derivatives from April 6 will also broaden the tariff base. Tariffs will now apply to the full value of some derivative products rather than only their embedded metal content, creating additional pressure for manufacturing provinces like Quebec and Ontario.
Though, some relief is emerging for agricultural exporters in the Prairies and Atlantic Canada.
Removal of some Chinese tariffs in early March, including a reduction in canola seed tariffs from 75.8% to 15%, has already supported a rebound in Canadian shipments. Canola seed exports to China rose in March to their highest since October 2024.
Near-term tariff impact is expected to remain concentrated on targeted products, but upcoming CUSMA review negotiations create uncertainty around how the agreement could evolve. The CUSMA exemption has proven mutually beneficial to the U.S. and Canada, and remains central to Canadian export resilience, making its preservation important to limiting near-term trade headwinds.
Continued efforts to diversify exports toward non-U.S. markets will remain critical to reducing reliance on a single trading partner while capturing growth opportunities elsewhere. Expanding LNG export capacity to Asian markets, deepening trade ties across the Indo-Pacific region, growing services exports, and efforts to bring more critical mineral supply to global markets could all support broader market diversification and strengthen Canada’s trade resilience over time.
About the Author:
Salim Zanzana is an economist at RBC. He focuses on emerging macroeconomic issues, ranging from trends in the labour market to shifts in the longer-term structural growth of Canada and other global economies.
- Total merchandise exports excluding special transactions trade ↩︎
- Total merchandise exports excluding special transactions trade ↩︎
- Gold exports under HS 7108 ↩︎
- Assumes total merchandise exports excluding special transaction trade on a customs basis, deflated using the Laspeyres export price index, constant 2017 dollars. ↩︎
- Total merchandise exports excluding special transactions trade ↩︎
This article is intended as general information only and is not to be relied upon as constituting legal, financial or other professional advice. The reader is solely liable for any use of the information contained in this document and Royal Bank of Canada (“RBC”) nor any of its affiliates nor any of their respective directors, officers, employees or agents shall be held responsible for any direct or indirect damages arising from the use of this document by the reader. A professional advisor should be consulted regarding your specific situation. Information presented is believed to be factual and up-to-date but we do not guarantee its accuracy and it should not be regarded as a complete analysis of the subjects discussed. All expressions of opinion reflect the judgment of the authors as of the date of publication and are subject to change. No endorsement of any third parties or their advice, opinions, information, products or services is expressly given or implied by Royal Bank of Canada or any of its affiliates.
This document may contain forward-looking statements within the meaning of certain securities laws, which are subject to RBC’s caution regarding forward-looking statements. ESG (including climate) metrics, data and other information contained on this website are or may be based on assumptions, estimates and judgements. For cautionary statements relating to the information on this website, refer to the “Caution regarding forward-looking statements” and the “Important notice regarding this document” sections in our latest climate report or sustainability report, available at: https://www.rbc.com/community-social-impact/reporting-performance/index.html. Except as required by law, none of RBC nor any of its affiliates undertake to update any information in this document.
