

 EN
EN 

While the U.S. and Mexico were kicking off bilateral talks on CUSMA (and announced two more sets of meetings in June and July, without a mention of Canada), Prime Minister Mark Carney was in New York making the country’s case to a business audience.
As the U.S. pivots to bilateral talks in its effort to reshape North American trade dynamics, we examine how Canada and Mexico have fared as the U.S. squeezed both with tariffs and other economic pressures.
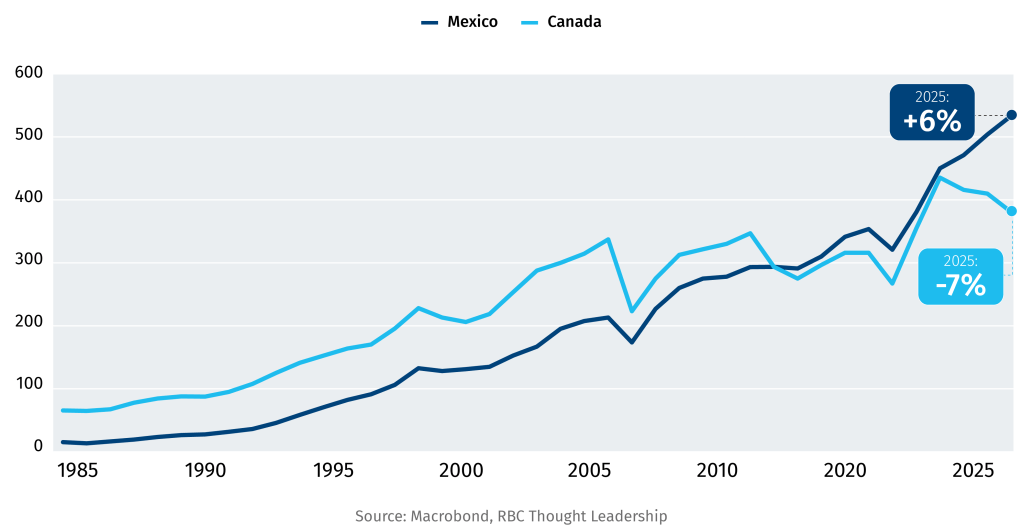
Mexico’s exports to the U.S. soared, Canada’s slipped in 2025
Annual U.S. imports from Canada and Mexico, billion US$
-
Despite one of the lowest effective tariff rates of ~3-4%, thanks to CUSMA shielding ~90% of Canadian exports, the U.S. imported nearly US$30 billion less goods from Canada—the second largest drop among U.S. trading partners behind only China.
-
Canada’s loss was almost identical to Mexico’s gain. It remains America’s largest import source and has extended its lead on the rest of the pack.
-
Both Canada and Mexico were at the epicenter of the tariff war, yet the divergence came down to the product mix, and new emerging trends, such as AI.
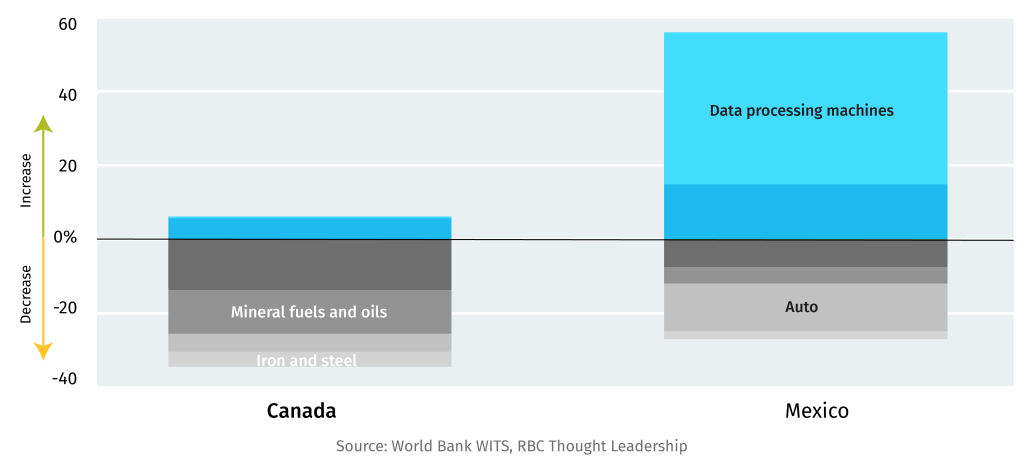
Tariff-hit sectors squeezed both countries, but AI lifted Mexico
Change in imports compared to 2024 by product categories, billion US$
-
Canada’s losses were broad-based. U.S. purchases from Canada fell across product categories that accounted for 84% of all imports from Canada. Lower oil volumes along with soft oil prices in 2025 accounted for a third of the drop in imports, with auto, steel and aluminum extending the decline by nearly as much.
-
Like Canada, Mexico reeled from the Section 232 tariffs. The U.S. imported US$13 billion less in auto and parts from Mexico, accounting for half of the decline.
-
The AI boom, however, lifted Mexico’s trade balance. The U.S. imported US$250 billion data processing units last year—almost double what it bought a year earlier—and Mexico was the single largest seller, supplying a third of that.
-
Data processing machines climbed to the top of the Mexico’s export ladder displacing passenger cars. Mexico’s share in global supply has doubled over the past two years, now supplying 18% of the US$550 billion global imports, and rapidly catching up to China and Taiwan.
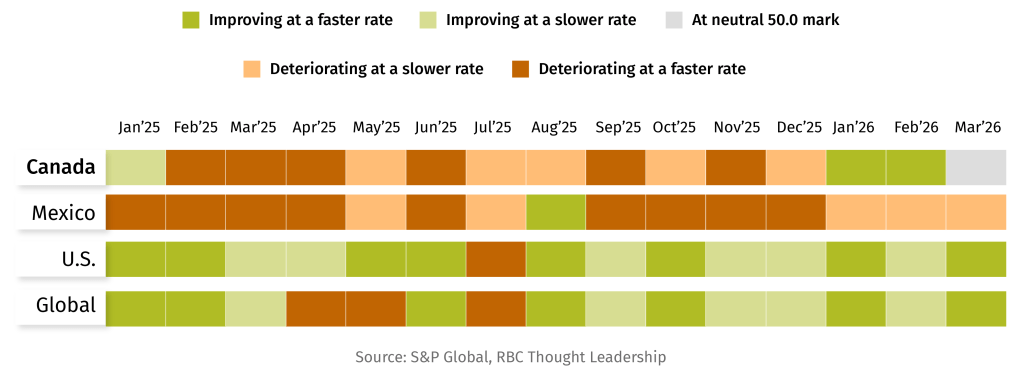
Manufacturing sector remained soft throughout 2025
Manufacturing Purchasing Managers’ Index (PMI)
-
Canada’s manufacturing sector, which makes up a tenth of the economy, took far more than a tenth of the pain, with GDP down 2.5% in 2025, marking a third consecutive decline. The squeeze was broad-based—14 of the 18 manufacturing subsectors contracted, from transport equipment and food & beverage to chemical and metal products.
-
Both countries shed factory jobs in 2025 but things are now diverging. Canada is regaining footing on its factory floor, with PMI climbing above 50 this year—seen as a level that signals expansion driven by new orders. Mexico’s manufacturing has been trending within the contraction zone for the past 22 months, long before tariffs were introduced, and shows no signs of immediate recovery.
U.S. tariff impact less damaging than feared for both Canada and Mexico
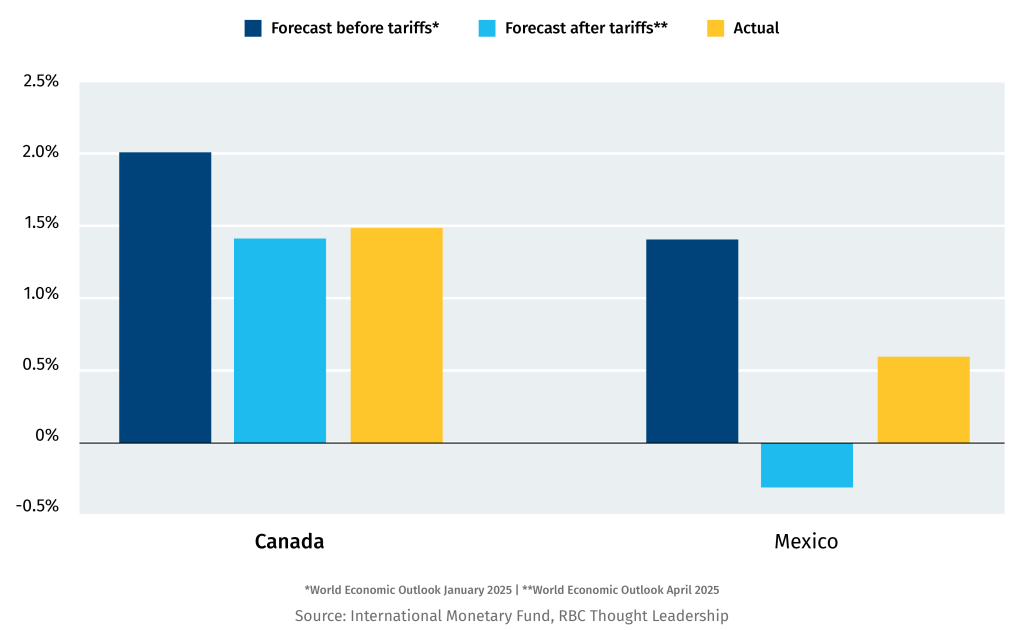
Projection and actual real GDP growth for 2025
-
Doom and gloom scenarios did not materialize thanks largely to CUSMA, though tariffs shaved off about a fifth of Canada’s pre-trade war growth expectations, and over half for Mexico.
-
Resilient consumer demand and fiscal policy provided a cushion for the Canadian economy. Mexico saw the opposite trend as the government tightened its budget. Meanwhile, remittances from the U.S. dropped 4.6%, partially due to an immigration crackdown and softening household consumption.
— Farhad Panahov, Economist
The week that was
Brussels prepares broader measures against Chinese imports
-
The European Commission signalled it will expand the use of import quotas and safeguard tariffs across entire sectors as concerns grow over Chinese overcapacity in chemicals, metals, clean technology, and manufacturing. Industry Commissioner Stéphane Séjourné said the EU’s trade deficit with China has reached roughly €1 billion per day, with policymakers increasingly framing the issue as a threat to European industrial competitiveness.
India sends largest-ever trade delegation to Canada
-
Indian Commerce Minister Piyush Goyal led an Indian trade and investment delegation as Ottawa and New Delhi look to accelerate free trade negotiations and target $50 billion in bilateral trade by 2030, up from roughly $10 billion today.
Shipping industry warns of rising costs and capacity constraints
-
Global shipping executives told the World Trade Organization that disruptions in the Gulf region and other maritime chokepoints are driving up costs across supply chains, while alternative transport corridors face growing capacity constraints. Industry leaders noted that a single container ship can carry the equivalent of roughly 70 freight trains.
ECB warns geopolitics are becoming a financial stability risk
-
The European Central Bank warned that the Iran conflict, volatile U.S. trade policy, and growing geoeconomic fragmentation are increasing risks to global financial stability. The Bank cautioned that markets may be underestimating the potential economic impact of prolonged energy disruptions, elevated sovereign debt levels, and renewed inflationary pressures stemming from geopolitical shocks.
—Thomas Ashcroft, Global Issues Policy Lead
This article is intended as general information only and is not to be relied upon as constituting legal, financial or other professional advice. The reader is solely liable for any use of the information contained in this document and Royal Bank of Canada (“RBC”) nor any of its affiliates nor any of their respective directors, officers, employees or agents shall be held responsible for any direct or indirect damages arising from the use of this document by the reader. A professional advisor should be consulted regarding your specific situation. Information presented is believed to be factual and up-to-date but we do not guarantee its accuracy and it should not be regarded as a complete analysis of the subjects discussed. All expressions of opinion reflect the judgment of the authors as of the date of publication and are subject to change. No endorsement of any third parties or their advice, opinions, information, products or services is expressly given or implied by Royal Bank of Canada or any of its affiliates.
This document may contain forward-looking statements within the meaning of certain securities laws, which are subject to RBC’s caution regarding forward-looking statements. ESG (including climate) metrics, data and other information contained on this website are or may be based on assumptions, estimates and judgements. For cautionary statements relating to the information on this website, refer to the “Caution regarding forward-looking statements” and the “Important notice regarding this document” sections in our latest climate report or sustainability report, available at: https://www.rbc.com/our-impact/sustainability-reporting/index.html. Except as required by law, none of RBC nor any of its affiliates undertake to update any information in this document.