
In this week’s edition: Signals from the U.S.-Japan deal, the cost of interprovincial trade barriers, and Trump sets his sights on supply management
The week that was
-
U.S. President Trump, who celebrated a trade deal with Japan earlier in the week, ended the week saying that he wasn’t sure a deal with Canada would be reached–and that the U.S. may unilaterally impose more tariffs on its neighbour.
-
One‑third of Canadian firms expect tariff‑related cost spikes, down from two‑thirds last quarter, due largely to USMCA exemptions. And half of firms already face higher costs, yet many can’t pass them on, squeezing margins.
-
In a joint statement, Canada’s premiers call on the Carney government to “improve the overall trade relationship” with China.
-
Algoma Steel, which sells about 60% of its output to the U.S., is seeking between $400 and $600 million in tariff relief from Ottawa.
-
U.S. President Trump indicates that 15% is as low as the U.S. is willing to go on tariffs.
When 15% is the new 35%
Tucked away in Japan’s trade deal with the U.S. was a US$550-billion pledge to create a sovereign wealth fund overseen by the U.S. President himself. Could that prove to be the blueprint for Canada and the EU, both of whom are angling to seal trade deals before Aug.1?
Details of the Japan fund are vague with both parties characterizing it very differently: The U.S. sees it as a 90:10 partnership in the U.S. taxpayer’s favour, with Washington dictating Japanese companies where to invest; Tokyo sees it as an investment pledge from Japan Inc. The U.S. is increasingly blurring the lines between creating an ecosystem that facilitates investments to what some are calling state intervention over business investments and activities. The most recent example: A US$400-million direct, China-style investment in rare-earth minerals company MP Materials by the Pentagon—a deal that has been criticized by industry competitors for its overreach.
The U.S. state creep poses a challenge for North American markets that are fair and free, but could start seeing U.S. federal-based entities coming to the fore—a new generation of government-backed entities that Western governments have criticized autocratic states for over the past several decades.
Canada has much to offer to the U.S. as an investor, but in the right circumstances. Canadian stock of U.S. foreign direct investment stands at US$812 billion, second only to Japan’s US$819 billion. In theory, more Canadian investments could be channeled into the U.S., structured to enrich Canadian domestic supply chains as well. The continued integration of Canada and the U.S., in public and corporate sectors, should result in positive spill-over effects for Canada in terms of investments, business activity and trade. There are also may be plenty of room for a slew of joint Canada-U.S. projects—in critical minerals, automotives, nuclear, fossil fuels and electricity, among others.
But if a joint fund of some description is on the table, it can’t be a blank cheque to Washington.
It’s crunch time for Canada, which is also facing 35% tariffs for all non-USMCA compliant goods if a deal is not struck (Both Carney and Trump have downplayed chances of a trade deal by Aug.1.) We may have to contend with 15%, which seems to be the going rate, as Europe appears to be resigning itself to that figure with Washington.
That could prove to be positive for Canada.
Assuming the USMCA preferred treatment remains intact, Canada seems poised to garner a ‘best-in-class’ access to the U.S. market. A possible weighted-average effective tariff rate of 2-3% is attractive both in absolute and comparative terms, assuming a 15% universal tariff rate on only 10%-20% of non-compliant USMCA trade. Essentially that’s similar to most-favoured nation tariff rates (traditionally 2.5%).
3 questions with…
In a week when Prime Minister Carney met with the Premiers, our Head of Thought Leadership Jordan Brennan reached out to Trevor Tombe, at the University of Calgary’s School of Public Policy, to discuss interprovincial trade barriers—and Trump.
Q: How much are interprovincial trade barriers costing Canada?
A: My research with collaborators suggests that Canada’s economy could increase by between 4.4% and 7.9% over the long-term—a gain of between $110 and $200 billion per year—if internal trade barriers are eliminated through mutual recognition policies. In specific sectors like trucking, these barriers add approximately 8.3% to freight rates, inflating business costs and reducing overall productivity. The smaller and generally lower income provinces, especially in Atlantic Canada, stand to gain far more than other provinces.
Q: What do you think the likely economic outcome of Bill C-5 will be?
A: Bill C-5 represents a significant federal effort to address internal trade barriers. However, we should be cautious about immediate GDP impacts. The $200-billion growth figure cited by some represents the upper end of estimates and assumes a massive levelling of trade barriers far beyond anything currently proposed. The real gains will come if provinces reciprocate with their own mutual recognition legislation, but we’re seeing considerable momentum in that regard.
Q: Prime Minister Carney seems to believe that removing internal trade barriers will offset the economic harm associated with Trump’s tariffs. How realistic is this belief?
A: The magnitude of interprovincial trade costs is larger than the costs of U.S. tariff disruptions but would take far longer to manifest. Over time, we could potentially more than compensate, but internal trade liberalization is not a sufficient short-term offset for immediate economic disruption.
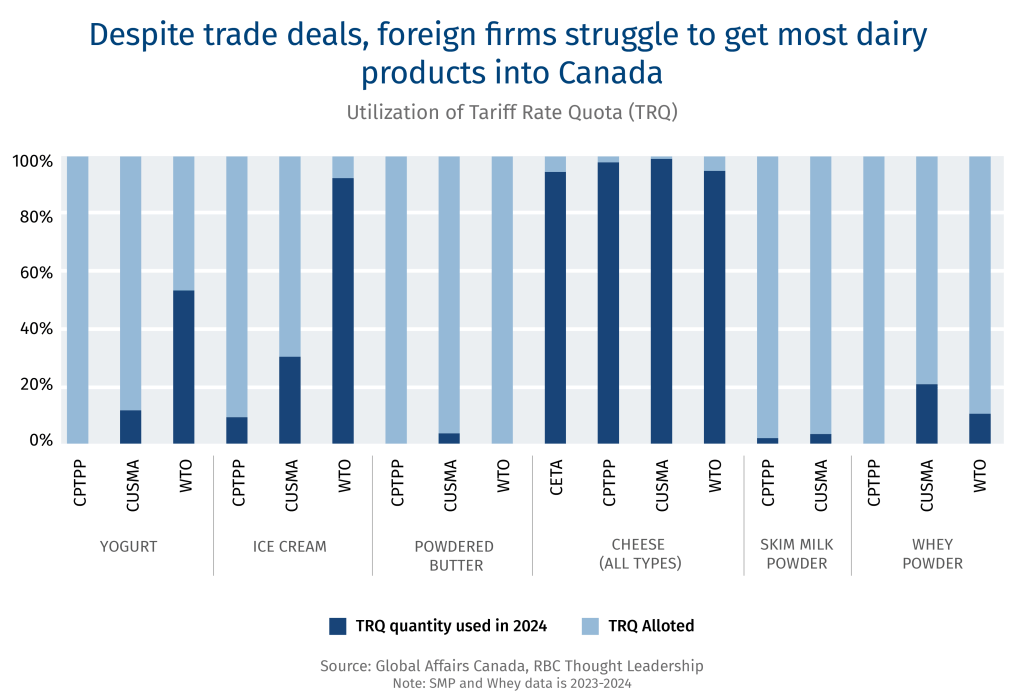
Import quotas – a pain point for the U.S.
Canada’s supply management has caught the eye of the Trump administration, again. Critics from south of the border are zeroing in on import quotas specifically for dairy products.
-
Canada’s supply management system is governed through import quotas, producer set prices, and production quotas for dairy, eggs, and poultry–a policy to guarantee farmers’ domestic market share and fair prices for products relative to farm inputs.
-
Import quotas are intended to limit imports within Canada’s supply management industries. In recent trade negotiations, however, Canada has made greater concessions. For example, in the Comprehensive and Progressive Agreement for Trans-Pacific Partnership (CPTPP) negotiations, Canada agreed to provide participating countries with an estimated 3.25% of Canada’s domestic dairy market.
-
As Canada-U.S.-Mexico-Agreement (CUSMA), the Canada-European Union Comprehensive Economic and Trade Agreement (CETA) and CPTPP are phased in over the next 10 years, Canadian foreign market access is expected to climb to roughly 10% of Canada’s dairy production.
-
But as Canadian processors hold most tariff import quotas, foreign importers have argued that they have limited access to Canada’s markets to fulfill their non-tariffed trade volumes negotiated in the agreement.
RBC Thought Leadership’s latest report, Supply Management Explained, explores the benefits and drawbacks of the system and its role in trade wars.
Resourceful ‘Northern America’
Canada and the U.S. ramped up their commodity exports over the past decade, as both countries leverage their resource riches. The latest report from UN Trade and Development (UNCTAD) shows the two countries—comprising ‘Northern America’—raised their combined commodity exports to 13.1% of the global total by 2023, from 10.8% a decade ago. Other regions barely grew or lost market share during the period.
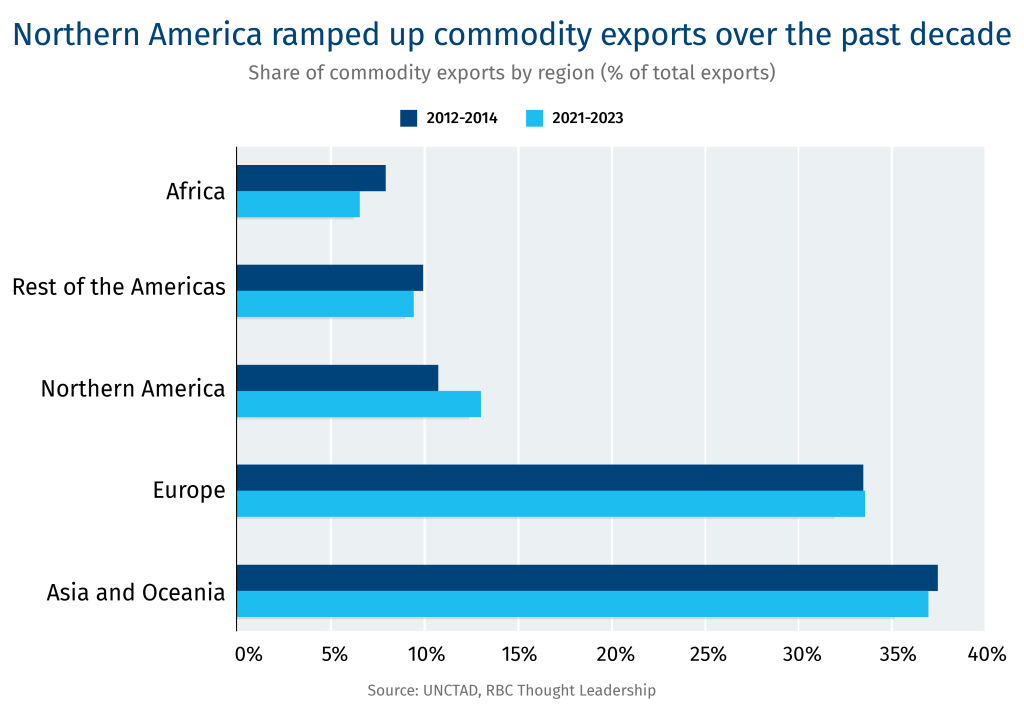
Commodity concentration: Canadian commodity exports—energy, mining and agriculture, as defined by UNCTAD—accounted for 55.8% of its total commodity exports in 2021-23, compared to 53.3% between 2012-14. The U.S. has become even more reliant: the three commodities made up 35.5% of all American commodity exports during the period, up from 29.5%. As both have earmarked energy, ag and mining as export priorities, they could become more dependent on the three commodities—and their price volatility.
Agriculture rising: For Canada, agriculture was able to grow its export market share from 14.7% to 16.7%, with energy, at 17.4%, up only marginally. For the U.S., it was all about the shale evolution and LNG revolution.
Commodity contraction: Globally, commodity exports now account for 32.7% of all international trade in value terms, down from 35.5% a decade earlier.
Strive to diversify. Countries mainly exporting raw materials could miss out on the broader benefits of global trade, driven by diversification, innovation and value-added production. While that UNCTAD warning was directed at developing countries, it should not be lost on Canadian businesses looking to expand mining, energy and agriculture sectors.
Final word
“It’s not our objective to have an agreement at any cost.”
—Prime Minister Mark Carney on negotiations with the U.S.
Contributors: Jordan Brennan, Shaz Merwat, Lisa Ashton, Reid Mckay, Yadullah Hussain, Caprice Biasoni
This article is intended as general information only and is not to be relied upon as constituting legal, financial or other professional advice. The reader is solely liable for any use of the information contained in this document and Royal Bank of Canada (“RBC”) nor any of its affiliates nor any of their respective directors, officers, employees or agents shall be held responsible for any direct or indirect damages arising from the use of this document by the reader. A professional advisor should be consulted regarding your specific situation. Information presented is believed to be factual and up-to-date but we do not guarantee its accuracy and it should not be regarded as a complete analysis of the subjects discussed. All expressions of opinion reflect the judgment of the authors as of the date of publication and are subject to change. No endorsement of any third parties or their advice, opinions, information, products or services is expressly given or implied by Royal Bank of Canada or any of its affiliates.
This document may contain forward-looking statements within the meaning of certain securities laws, which are subject to RBC’s caution regarding forward-looking statements. ESG (including climate) metrics, data and other information contained on this website are or may be based on assumptions, estimates and judgements. For cautionary statements relating to the information on this website, refer to the “Caution regarding forward-looking statements” and the “Important notice regarding this document” sections in our latest climate report or sustainability report, available at: https://www.rbc.com/our-impact/sustainability-reporting/index.html. Except as required by law, none of RBC nor any of its affiliates undertake to update any information in this document.