
A NATO laggard no more—is the message the federal government revealed on Monday when it announced a big increase in defence funding for the 2025-26 fiscal year.
The move will see Canada meet the 2% NATO spending target it agreed to work towards almost two decades ago in 2006. Yet, Canada’s relief may not last long. In two weeks, it looks likely that the NATO summit will start negotiating new targets in the 3%-plus range.
It has us wondering what billions of new defence dollars mean for the economy—including the government’s bottom line. Here are 10 key factors to consider.
1. Where does Canada stand right now with the NATO target?
NATO members committed to spend 2% of gross domestic product (GDP) each year on defence and 20% of total spending on major equipment purchases as of 2014. Eligible spending and GDP estimates are defined by NATO.
For 2024, Canada is estimated to rank 27th out of 31 NATO countries on defence spending as a share of the economy at 1.37%, and one of eight countries below the target. It would be the lowest among G7 NATO members, and considerably behind Russia-adjacent states like NATO spending leader Poland. Canada’s major equipment share of spending hovers just below the 20% target.
2. How much new spending has Canada committed?
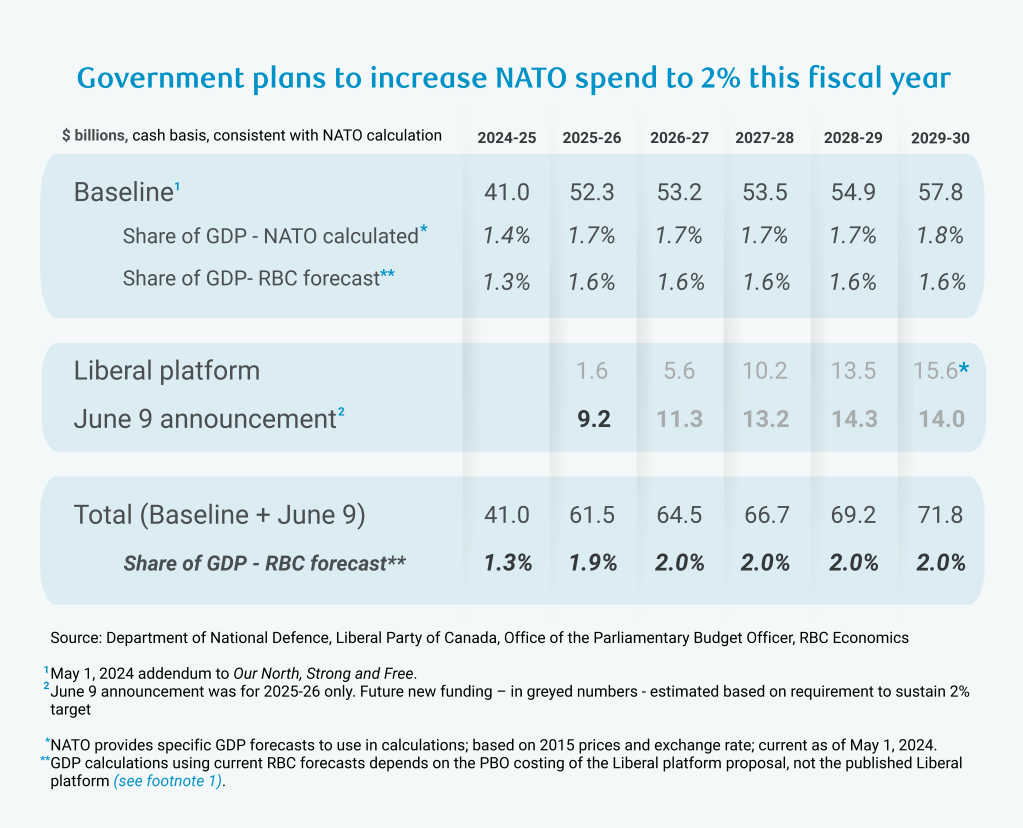
Spending planned in last year’s defence strategy update, Our North, Strong and Free: A Renewed Vision for Canada’s Defence, would raise Canada’s NATO spending to 1.76% of GDP by 2029-30 en route to the prior government’s commitment to meet 2% by 2032. This was based on NATO-mandated GDP calculations, which differ from both RBC’s current and 2024 forecasts.
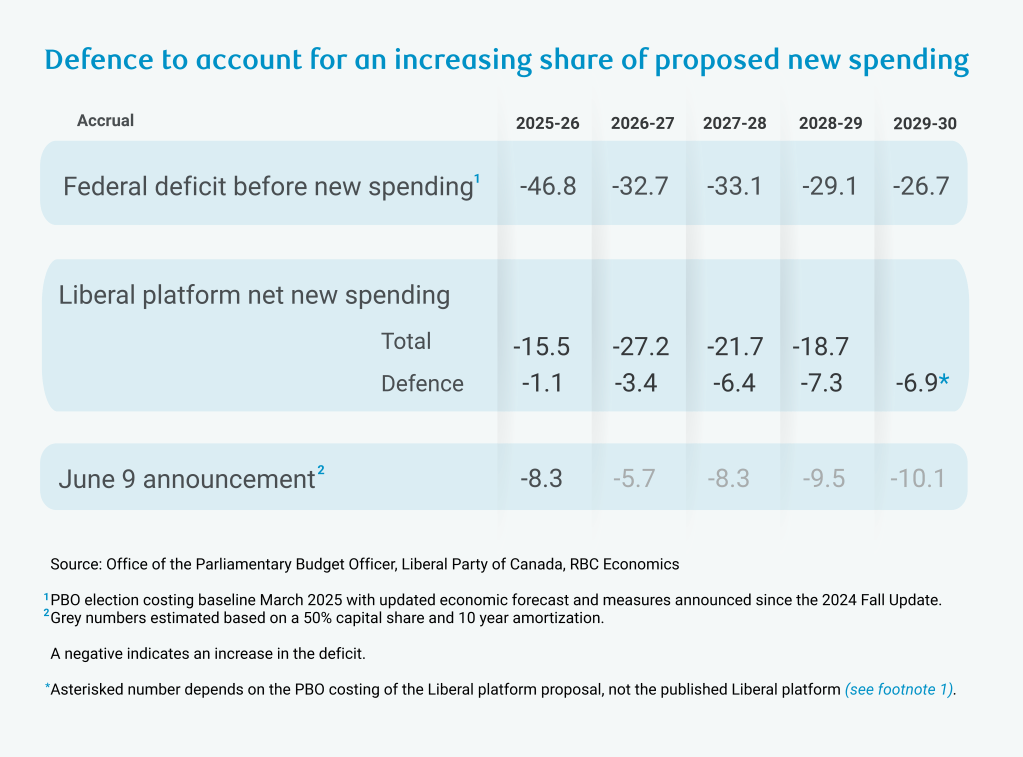
The current government’s election platform advanced that timeline to 2030 with proposed incremental NATO spending of $46.4 billion over five years1. Major equipment purchases would ramp up to over 30% of spending.
Now, the feds are completely changing the script with the June 9 announcement of $9.2 billion in additional funding in the current fiscal year that would take Canada’s spending up to the 2% target. The announcement only included new funding for 2025-26, but maintaining 2% spending going forward would require about $62 billion in incremental defence spending over the next five years (including 2025-26).
However, it’s important to keep in mind that plans can change and even multi-year funding strategies could look different from dollars actually spent.
3. Where will defence dollars be spent?
The type of spending matters greatly for its economic impact.
The Department of National Defence budget—about 80% of Canada’s NATO spending—has historically been fairly consistent in allocating 50% of spending to personnel, 25% to operations and readiness, 20% to capital and 5% to infrastructure2. This composition will likely shift with the planned scale up in major equipment purchases.
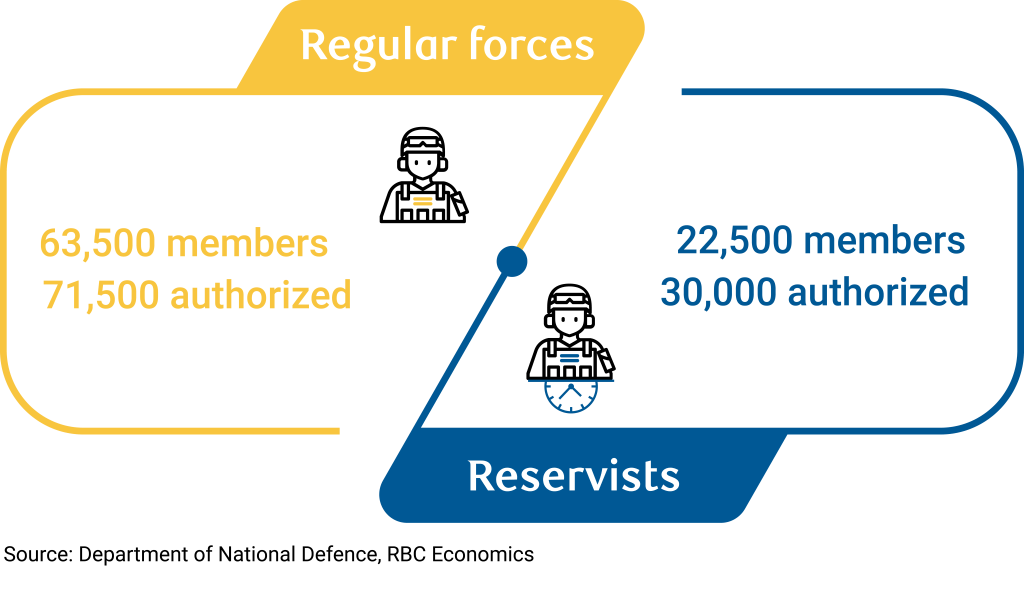
Last year’s defence strategy, the Liberal Party platform, and recent announcement emphasize sustaining Canada’s existing military assets, investing in new equipment and capabilities, and growing the defence production industry. Reports have highlighted a large share of unserviceable Canadian Armed Forces (CAF) equipment—including only one in four submarines being seaworthy. The CAF is also almost 16,000 members short of its authorized target strength and recruitment is a challenge, making personnel-focused measures a key focus.
4. What are the short-run economic multipliers for defence spending?
Defence services—which largely represents operating expenditures—has a total GDP multiplier somewhat higher than the economy-wide average and is on par with many other service sectors. Multipliers measure the ripple effects across the economy from a change in spending or activity in a sector.
Construction investment, machinery and equipment (M&E), and intellectual property (IP) largely cover capital spending. Multipliers vary with IP being the highest, while M&E is the lowest, given its high import content. Overall, these defence GDP multipliers are higher than for the private sector, on average, as are defence jobs multipliers.
These multipliers offer only a partial view. They’re a static snapshot of the economy and don’t factor in opportunity costs. The supply-demand balance in the economy also matters significantly, because it determines whether additional spending adds net new activity or crowds it out from other areas. A weak Canadian growth outlook the next couple years is favourable for defence spending to have a stimulative effect.
Importantly, multipliers are a short-run concept. Investing in M&E often makes sense even with a lower multiplier, because it adds to the capital stock. Similarly, it’s essential to think about the long-term productivity of defence spending.
5. What are the long-run economic impacts?
Here’s where it gets trickier. Empirical research on the effect of defence spending on long-run growth has found both positive and negative effects.
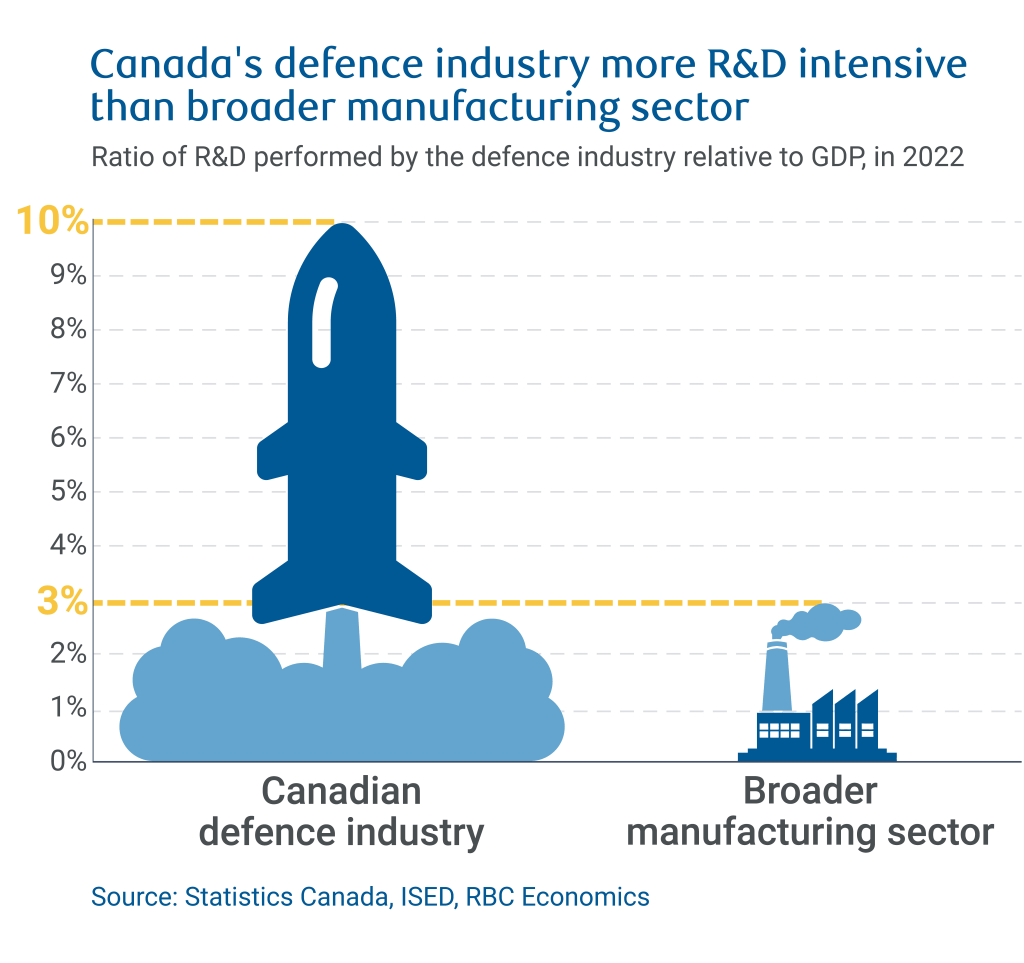
Positive impacts tend to arise through industrial development, innovation, and infrastructure channels. The defence sector is notably research-intensive. Dual-use civilian/defence infrastructure can also enhance internal connectivity and access to external markets.
Negative impacts tend to stem from capital leakage, fiscal overspending, and the risk of diverting resources from more productive sectors of the economy. Without a procurement framework that prioritizes domestic suppliers, increased defence spending could result in capital outflows.
Notably, the federal government has committed to collaborate with industry to develop a comprehensive defence industrial strategy in support of “Made-in-Canada” defence procurement. Still, Canada’s defence industry faces stiff competition from established global players—particularly the U.S.—which represents 43% of the global arms export market3.
6. What is Canada’s defence production industry?
Canada’s defence production industry spans three core domains: air and space systems, land and other defence, and marine. In 2022, it generated $14.3 billion in revenue from 586 firms. About 408 of the 586 firms were Canadian owned, collectively accounting for half of total industry sales.
Domestic sales made up 51% of total sales with 36% of total sales stemming from direct contracts with the federal government. The remaining industry revenue came from exports. The U.S. was the largest international market, representing 61% of export sales, followed by the Middle East and Africa, European Union, and United Kingdom.
Canada’s defence sector shows clear specialization by region. Strong manufacturing bases in Ontario and Quebec support areas like combat vehicle production, munitions, and aircraft fabrication and maintenance. In other regions, defence employment is concentrated in naval shipbuilding and marine vessel construction, and aircraft maintenance, repair and overhaul.
In 2022, 54% of total supply chain expenditures across the defence industry were directed to domestic sources. This share rises to 61% among Canadian-owned firms.
7. Can Canada ramp up defence production?
Statistics Canada’s 2022 survey of defence firms showed that roughly 45% were operating at 90 to 100% capacity—indicating some available slack. But, uncertainty remains about whether these firms can scale up production in both volume and complexity to meet increased demand.
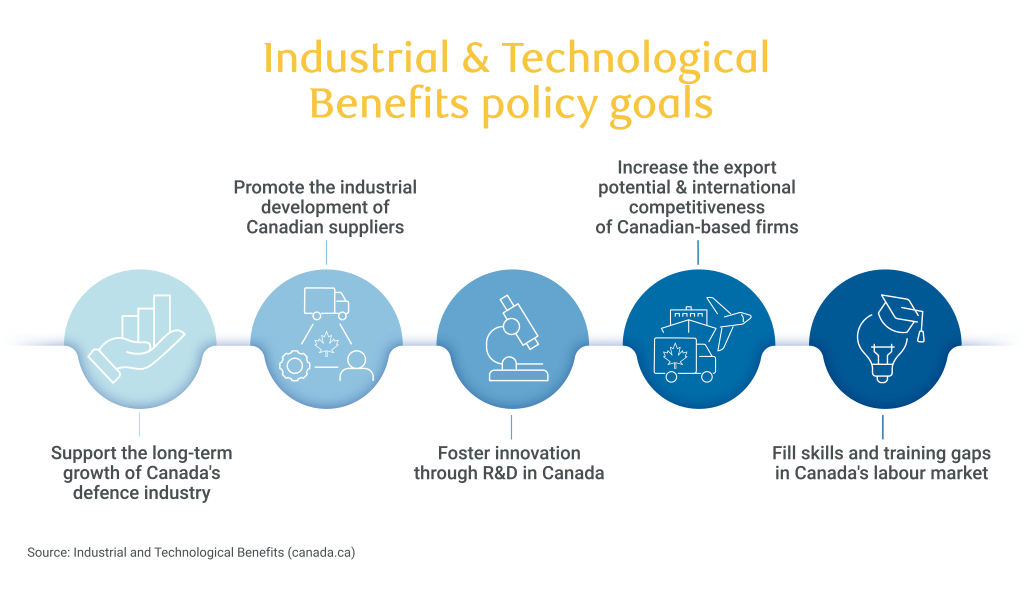
It would require more coherent and targeted support for the domestic sector. On one hand, Canada maintains an Industrial and Technology Benefits Policy that requires large defence procurement contractors to undertake business activity in Canada equal to the value of contracts they have won. There are also other Made-in-Canada directives like the National Shipbuilding Strategy.
Yet, the defence industry has not received the same level of export promotion or strategic policy support as other sectors in the economy. There is also a view that the Canadian Armed Forces has an engrained preference for American-made technology.
Recent U.S. hostility toward Canada has had the federal government talking about partnering with Europe on defence production and security. However, with much of Canada’s existing military kit and defence production integrated with U.S. technology and supply chains, ramping up partnerships with other nations may not be seamless.
The government’s announcement in June promises significant funding towards a defence industrial strategy and stronger defence partnerships with non-U.S. allies.
8. What does 2% defence spending mean for the government’s bottom line?
While the cash impact of spending matters for the economy, the government’s bottom line reflects the accrual impact.
The NATO target is computed on a cash basis, and with capital expenditures accounting for a peak 50% of incremental spending in the Liberal platform, the accrual impact of the platform proposal would be $24.9 billion over five years (versus $46.4 billion cash).
Immediately ramping up NATO spending to 2% per the recent announcement and, assuming it’s maintained at that level, could lead to an accrual impact of $42 billion over five years (versus $62 billion cash), according to our estimates. The funding committed in last year’s defence strategy update is already in the government’s budget.
Defence spending currently represents about 8% of total federal spending by our estimates (accrual), almost 20% of program spending and about 30% of the core government operating budget4—with these shares projected to rise.
9. Will defence dollars actually be spent?
There is concern over whether the Department of National Defence (DND) can mobilize its large and growing capital budget in a timely way. With a 17% boost to in-year defence spending from the government’s recent announcement—most of it for the DND, which already has the largest single budget among 130 federal organizations—this is a live issue.
The Office of the Parliamentary Budget Officer found that planned capital spending has repeatedly been pushed back under Canada’s prior defence strategy, Strong, Secure, Engaged: Canada’s Defence Policy (SSE). Over six years, almost $12 billion in capital spending was unspent from the planned $53 billion.
Defence procurement is a big challenge. Impediments include infrequent major procurements, lengthy processes during which requirements can be changed, and onerous rules. The desire to nurture a Canadian defence industry is also seen as a barrier to moving quickly. Last year’s defence strategy and the Liberal platform pledge to address defence procurement.
Strategy could also be key. Given rapidly shifting global developments, quickly articulating an updated defence strategy on the level of engagement with the U.S. or Europe, targeted sectors for a new defence industrial strategy, or changing requirements for modern warfare may be key first steps for streamlining procurement. And, with incentives tilted to just getting money out the door a strategy could help ensure value for money.
10. Will the 2% NATO target be enough?
NATO’s goal posts may be shifting. In 2023, after Russia’s second invasion of Ukraine, NATO members reiterated the 2% target as a minimum spending level.
NATO Secretary General Mark Rutte recently suggested that a 5% target would be discussed at the June summit—consistent with suggestions from the new U.S. administration. He speculated it could comprise of a 3.5% “hard target” aligned with current NATO formulas and a new 1.5% “soft target” that could include facilitating investments. This could potentially be spending in areas such as port or AI infrastructure or critical mineral development.
Prime Minister Mark Carney has stated that in addition to meeting the 2% of GDP defence spending target this year, Canada will accelerate its defence investments in the coming years to respond to an increasingly complex and dynamic global security environment.
As for official NATO targets, there is likely to be a lengthy negotiating process with additional defence demands hitting largely stretched national budgets and limited industrial capacity to ramp up in the medium term across the alliance.
Cynthia Leach is Assistant Chief Economist at RBC covering the team’s structural economic and policy analysis. She joined in 2020.
Salim Zanzana is an economist for RBC. He focuses on emerging macroeconomic themes, ranging from international trade to shifts in the long-term structural growth of Canada and other global economies
This article is intended as general information only and is not to be relied upon as constituting legal, financial or other professional advice. The reader is solely liable for any use of the information contained in this document and Royal Bank of Canada (“RBC”) nor any of its affiliates nor any of their respective directors, officers, employees or agents shall be held responsible for any direct or indirect damages arising from the use of this document by the reader. A professional advisor should be consulted regarding your specific situation. Information presented is believed to be factual and up-to-date but we do not guarantee its accuracy and it should not be regarded as a complete analysis of the subjects discussed. All expressions of opinion reflect the judgment of the authors as of the date of publication and are subject to change. No endorsement of any third parties or their advice, opinions, information, products or services is expressly given or implied by Royal Bank of Canada or any of its affiliates.
This document may contain forward-looking statements within the meaning of certain securities laws, which are subject to RBC’s caution regarding forward-looking statements. ESG (including climate) metrics, data and other information contained on this website are or may be based on assumptions, estimates and judgements. For cautionary statements relating to the information on this website, refer to the “Caution regarding forward-looking statements” and the “Important notice regarding this document” sections in our latest climate report or sustainability report, available at: https://www.rbc.com/community-social-impact/reporting-performance/index.html. Except as required by law, none of RBC nor any of its affiliates undertake to update any information in this document.
